1 Executive Summary
2 Market Introduction
2.1 Definition 14
2.2 Scope of the Study 14
2.3 Assumptions 15
2.4 Market Structure 15
2.5 Key Takeaways 16
2.6 Key Buying Criteria 16
3 Research Methodology
3.1 Research Process 18
3.2 Primary Research 19
3.3 Secondary Research 20
3.4 Market Size Estimation 20
3.5 Forecast Model 21
4 Market Dynamics
4.1 Introduction 23
4.2 Drivers 24
4.2.1 Increasing demand for powdered fruits in nutraceutical products 24
4.2.2 Increasing demand for superfruit powder 24
4.2.3 Increasing consumption of instant beverages 25
4.2.4 Drivers Impact Analysis 25
4.3 Restraints 26
4.3.1 Agro-climatic conditions 26
4.3.2 Restraints Impact Analysis 26
4.4 Opportunities 26
4.4.1 Increasing demand for clean label products 26
4.4.2 Product development 26
4.4.3 Innovative packaging 27
4.5 Challenges 27
4.5.1 Certifications 27
5 Market Factor Analysis
5.1 Value Chain Analysis 29
5.1.1 Washing & Sorting 30
5.1.2 Peeling & Slicing 30
5.1.3 Blanching 30
5.1.4 Drying 30
5.2 Supply Chain Analysis 30
5.3 Porter’s Five Forces Analysis 31
5.3.1.1 Threat of New Entrants 32
5.3.1.2 Threat of Substitutes 32
5.3.1.3 Bargaining Power of Buyers 32
5.3.1.4 Bargaining Power of Suppliers 33
5.3.1.5 Internal Rivalry 33
6 Dehydrated Fruits & Vegetables Market, By Type
6.1 Overview 35
7 Dehydrated Fruits & Vegetables Market, By Form
7.1 Overview 38
8 Global Dehydrated Fruits & Vegetables Market, By Region
8.1 Introduction 40
8.2 North America 41
Dehydrated Fruits & Vegetables Market, By Type
Dehydrated Fruits & Vegetables Market, By Form
8.2.1 U.S. 45
Dehydrated Fruits & Vegetables Market, By Type
Dehydrated Fruits & Vegetables Market, By Form
8.2.2 Canada 47
Dehydrated Fruits & Vegetables Market, By Type
Dehydrated Fruits & Vegetables Market, By Form
8.2.3 Mexico 50
Dehydrated Fruits & Vegetables Market, By Type
Dehydrated Fruits & Vegetables Market, By Form
8.3 Europe 53
Dehydrated Fruits & Vegetables Market, By Type
Dehydrated Fruits & Vegetables Market, By Form
8.3.1 U.K 56
Dehydrated Fruits & Vegetables Market, By Type
Dehydrated Fruits & Vegetables Market, By Form
8.3.2 Germany 59
Dehydrated Fruits & Vegetables Market, By Type
Dehydrated Fruits & Vegetables Market, By Form
8.3.3 France 62
Dehydrated Fruits & Vegetables Market, By Type
Dehydrated Fruits & Vegetables Market, By Form
8.3.4 Italy 64
Dehydrated Fruits & Vegetables Market, By Type
Dehydrated Fruits & Vegetables Market, By Form
8.3.5 Spain 67
Dehydrated Fruits & Vegetables Market, By Type
Dehydrated Fruits & Vegetables Market, By Form
8.3.6 Rest of Europe 70
Dehydrated Fruits & Vegetables Market, By Type
Dehydrated Fruits & Vegetables Market, By Form
8.4 Asia Pacific 73
Dehydrated Fruits & Vegetables Market, By Type
Dehydrated Fruits & Vegetables Market, By Form
8.4.1 China 77
Dehydrated Fruits & Vegetables Market, By Type
Dehydrated Fruits & Vegetables Market, By Form
8.4.2 India 79
Dehydrated Fruits & Vegetables Market, By Type
Dehydrated Fruits & Vegetables Market, By Form
8.4.3 Japan 82
Dehydrated Fruits & Vegetables Market, By Type
Dehydrated Fruits & Vegetables Market, By Form
8.4.4 Australia & New Zealand 85
Dehydrated Fruits & Vegetables Market, By Type
Dehydrated Fruits & Vegetables Market, By Form
8.4.5 Rest of Asia Pacific 88
Dehydrated Fruits & Vegetables Market, By Type
Dehydrated Fruits & Vegetables Market, By Form
8.5 Latin America 91
Dehydrated Fruits & Vegetables Market, By Type
Dehydrated Fruits & Vegetables Market, By Form
8.5.1 Brazil 95
Dehydrated Fruits & Vegetables Market, By Type
Dehydrated Fruits & Vegetables Market, By Form
8.5.2 Argentina 97
Dehydrated Fruits & Vegetables Market, By Type
Dehydrated Fruits & Vegetables Market, By Form
8.5.3 Rest of Latin America 100
Dehydrated Fruits & Vegetables Market, By Type
Dehydrated Fruits & Vegetables Market, By Form
8.6 Middle East & Africa 102
Dehydrated Fruits & Vegetables Market, By Type
Dehydrated Fruits & Vegetables Market, By Form
8.6.1 GCC Countries 106
Dehydrated Fruits & Vegetables Market, By Type
Dehydrated Fruits & Vegetables Market, By Form
8.6.2 South Africa 108
Dehydrated Fruits & Vegetables Market, By Type
Dehydrated Fruits & Vegetables Market, By Form
8.6.3 Rest of Middle East & Africa 111
Dehydrated Fruits & Vegetables Market, By Type
Dehydrated Fruits & Vegetables Market, By Form
9 Conclusion
9.1 Key Findings 115
9.1.1 CEO’s Viewpoint 115
9.1.2 Prediction 115
10 List of Tables
TABLE 1 MARKET SYNOPSIS 12
TABLE 2 LIST OF ASSUMPTIONS 15
TABLE 3 GLOBAL: DEHYDRATED FRUITS & VEGETABLES MARKET, BY TYPE, 2020-2027 (USD MILLION) 35
TABLE 4 GLOBAL: DEHYDRATED FRUITS & VEGETABLES MARKET, BY TYPE, 2020-2027 KILO TONS 36
TABLE 5 GLOBAL: DEHYDRATED FRUITS & VEGETABLES MARKET, BY FORM, 2020-2027 (USD MILLION) 38
TABLE 6 GLOBAL: DEHYDRATED FRUITS & VEGETABLES MARKET, BY FORM, 2020-2027 KILO TONS 38
TABLE 7 GLOBAL DEHYDRATED FRUITS & VEGETABLES MARKET, BY REGION, 2020-2027 (USD MILLION) 40
TABLE 8 GLOBAL DEHYDRATED FRUITS & VEGETABLES MARKET, BY REGION, 2020-2027 KILO TONS 41
TABLE 9 NORTH AMERICA: DEHYDRATED FRUITS & VEGETABLES MARKET, BY COUNTRY, 2020-2027 (USD MILLION) 41
TABLE 10 NORTH AMERICA: DEHYDRATED FRUITS & VEGETABLES MARKET, BY COUNTRY, 2020-2027 KILO TONS 42
TABLE 11 NORTH AMERICA: DEHYDRATED FRUITS & VEGETABLES MARKET, BY TYPE, 2020-2027 (USD MILLION) 42
TABLE 12 NORTH AMERICA: DEHYDRATED FRUITS & VEGETABLES MARKET, BY TYPE, 2020-2027 KILO TONS 43
TABLE 13 NORTH AMERICA: DEHYDRATED FRUITS & VEGETABLES MARKET, BY FORM, 2020-2027 (USD MILLION) 44
TABLE 14 NORTH AMERICA: DEHYDRATED FRUITS & VEGETABLES MARKET, BY FORM, 2020-2027 KILO TONS 44
TABLE 15 U.S.: DEHYDRATED FRUITS & VEGETABLES MARKET, BY TYPE, 2020-2027 (USD MILLION) 45
TABLE 16 U.S.: DEHYDRATED FRUITS & VEGETABLES MARKET, BY FORM, 2020-2027 (USD MILLION) 45
TABLE 17 U.S.: DEHYDRATED FRUITS & VEGETABLES MARKET, BY TYPE, 2020-2027 KILO TONS 46
TABLE 18 U.S.: DEHYDRATED FRUITS & VEGETABLES MARKET, BY FORM, 2020-2027 KILO TONS 47
TABLE 19 CANADA: DEHYDRATED FRUITS & VEGETABLES MARKET, BY TYPE, 2020-2027 (USD MILLION) 47
TABLE 20 CANADA: DEHYDRATED FRUITS & VEGETABLES MARKET, BY FORM, 2020-2027 (USD MILLION) 48
TABLE 21 CANADA: DEHYDRATED FRUITS & VEGETABLES MARKET, BY TYPE, 2020-2027 KILO TONS 49
TABLE 22 CANADA: DEHYDRATED FRUITS & VEGETABLES MARKET, BY FORM, 2020-2027 KILO TONS 49
TABLE 23 MEXICO: DEHYDRATED FRUITS & VEGETABLES MARKET, BY TYPE, 2020-2027 (USD MILLION) 50
TABLE 24 MEXICO: DEHYDRATED FRUITS & VEGETABLES MARKET, BY FORM, 2020-2027 (USD MILLION) 51
TABLE 25 MEXICO: DEHYDRATED FRUITS & VEGETABLES MARKET, BY TYPE, 2020-2027 KILO TONS 51
TABLE 26 MEXICO: DEHYDRATED FRUITS & VEGETABLES MARKET, BY FORM, 2020-2027 KILO TONS 52
TABLE 27 EUROPE: DEHYDRATED FRUITS & VEGETABLES MARKET, BY COUNTRY, 2020-2027 (USD MILLION) 53
TABLE 28 EUROPE: DEHYDRATED FRUITS & VEGETABLES MARKET, BY COUNTRY, 2020-2027 KILO TONS 53
TABLE 29 EUROPE: DEHYDRATED FRUITS & VEGETABLES MARKET, BY TYPE, 2020-2027 (USD MILLION) 54
TABLE 30 EUROPE: DEHYDRATED FRUITS & VEGETABLES MARKET, BY TYPE, 2020-2027 KILO TONS 55
TABLE 31 EUROPE: DEHYDRATED FRUITS & VEGETABLES MARKET, BY FORM, 2020-2027 (USD MILLION) 55
TABLE 32 EUROPE: DEHYDRATED FRUITS & VEGETABLES MARKET, BY FORM, 2020-2027 KILO TONS 56
TABLE 33 U.K: DEHYDRATED FRUITS & VEGETABLES MARKET, BY TYPE, 2020-2027 (USD MILLION) 56
TABLE 34 U.K: DEHYDRATED FRUITS & VEGETABLES MARKET, BY FORM, 2020-2027 (USD MILLION) 57
TABLE 35 U.K: DEHYDRATED FRUITS & VEGETABLES MARKET, BY TYPE, 2020-2027 KILO TONS 58
TABLE 36 U.K: DEHYDRATED FRUITS & VEGETABLES MARKET, BY FORM, 2020-2027 KILO TONS 58
TABLE 37 GERMANY: DEHYDRATED FRUITS & VEGETABLES MARKET, BY TYPE, 2020-2027 (USD MILLION) 59
TABLE 38 GERMANY: DEHYDRATED FRUITS & VEGETABLES MARKET, BY FORM, 2020-2027 (USD MILLION) 60
TABLE 39 GERMANY: DEHYDRATED FRUITS & VEGETABLES MARKET, BY TYPE, 2020-2027 KILO TONS 60
TABLE 40 GERMANY: DEHYDRATED FRUITS & VEGETABLES MARKET, BY FORM, 2020-2027 KILO TONS 61
TABLE 41 FRANCE: DEHYDRATED FRUITS & VEGETABLES MARKET, BY TYPE, 2020-2027 (USD MILLION) 62
TABLE 42 FRANCE: DEHYDRATED FRUITS & VEGETABLES MARKET, BY FORM, 2020-2027 (USD MILLION) 62
TABLE 43 FRANCE: DEHYDRATED FRUITS & VEGETABLES MARKET, BY TYPE, 2020-2027 KILO TONS 63
TABLE 44 FRANCE: DEHYDRATED FRUITS & VEGETABLES MARKET, BY FORM, 2020-2027 KILO TONS 64
TABLE 45 ITALY: DEHYDRATED FRUITS & VEGETABLES MARKET, BY TYPE, 2020-2027 (USD MILLION) 64
TABLE 46 ITALY: DEHYDRATED FRUITS & VEGETABLES MARKET, BY FORM, 2020-2027 (USD MILLION) 65
TABLE 47 ITALY: DEHYDRATED FRUITS & VEGETABLES MARKET, BY TYPE, 2020-2027 KILO TONS 66
TABLE 48 ITALY: DEHYDRATED FRUITS & VEGETABLES MARKET, BY FORM, 2020-2027 KILO TONS 66
TABLE 49 SPAIN: DEHYDRATED FRUITS & VEGETABLES MARKET, BY TYPE, 2020-2027 (USD MILLION) 67
TABLE 50 SPAIN: DEHYDRATED FRUITS & VEGETABLES MARKET, BY FORM, 2020-2027 (USD MILLION) 68
TABLE 51 SPAIN: DEHYDRATED FRUITS & VEGETABLES MARKET, BY TYPE, 2020-2027 KILO TONS 68
TABLE 52 SPAIN: DEHYDRATED FRUITS & VEGETABLES MARKET, BY FORM, 2020-2027 KILO TONS 69
TABLE 53 REST OF EUROPE: DEHYDRATED FRUITS & VEGETABLES MARKET, BY TYPE, 2020-2027 (USD MILLION) 70
TABLE 54 REST OF EUROPE: DEHYDRATED FRUITS & VEGETABLES MARKET, BY FORM, 2020-2027 (USD MILLION) 70
TABLE 55 REST OF EUROPE: DEHYDRATED FRUITS & VEGETABLES MARKET, BY TYPE, 2020-2027 KILO TONS 71
TABLE 56 REST OF EUROPE: DEHYDRATED FRUITS & VEGETABLES MARKET, BY FORM, 2020-2027 KILO TONS 72
TABLE 57 ASIA PACIFIC: DEHYDRATED FRUITS & VEGETABLES MARKET, BY COUNTRY, 2020-2027 (USD MILLION) 73
TABLE 58 ASIA PACIFIC: DEHYDRATED FRUITS & VEGETABLES MARKET, BY COUNTRY, 2020-2027 KILO TONS 73
TABLE 59 ASIA PACIFIC: DEHYDRATED FRUITS & VEGETABLES MARKET, BY TYPE, 2020-2027 (USD MILLION) 74
TABLE 60 ASIA PACIFIC: DEHYDRATED FRUITS & VEGETABLES MARKET, BY TYPE, 2020-2027 KILO TONS 75
TABLE 61 ASIA PACIFIC: DEHYDRATED FRUITS & VEGETABLES MARKET, BY FORM, 2020-2027 (USD MILLION) 75
TABLE 62 ASIA PACIFIC: DEHYDRATED FRUITS & VEGETABLES MARKET, BY FORM, 2020-2027 KILO TONS 76
TABLE 63 CHINA: DEHYDRATED FRUITS & VEGETABLES MARKET, BY TYPE, 2020-2027 (USD MILLION) 77
TABLE 64 CHINA: DEHYDRATED FRUITS & VEGETABLES MARKET, BY FORM, 2020-2027 (USD MILLION) 77
TABLE 65 CHINA: DEHYDRATED FRUITS & VEGETABLES MARKET, BY TYPE, 2020-2027 KILO TONS 78
TABLE 66 CHINA: DEHYDRATED FRUITS & VEGETABLES MARKET, BY FORM, 2020-2027 KILO TONS 79
TABLE 67 INDIA: DEHYDRATED FRUITS & VEGETABLES MARKET, BY TYPE, 2020-2027 (USD MILLION) 79
TABLE 68 INDIA: DEHYDRATED FRUITS & VEGETABLES MARKET, BY FORM, 2020-2027 (USD MILLION) 80
TABLE 69 INDIA: DEHYDRATED FRUITS & VEGETABLES MARKET, BY TYPE, 2020-2027 KILO TONS 81
TABLE 70 INDIA: DEHYDRATED FRUITS & VEGETABLES MARKET, BY FORM, 2020-2027 KILO TONS 81
TABLE 71 JAPAN: DEHYDRATED FRUITS & VEGETABLES MARKET, BY TYPE, 2020-2027 (USD MILLION) 82
TABLE 72 JAPAN: DEHYDRATED FRUITS & VEGETABLES MARKET, BY FORM, 2020-2027 (USD MILLION) 83
TABLE 73 JAPAN: DEHYDRATED FRUITS & VEGETABLES MARKET, BY TYPE, 2020-2027 KILO TONS 83
TABLE 74 JAPAN: DEHYDRATED FRUITS & VEGETABLES MARKET, BY FORM, 2020-2027 KILO TONS 84
TABLE 75 AUSTRALIA & NEW ZEALAND: DEHYDRATED FRUITS & VEGETABLES MARKET, BY TYPE, 2020-2027 (USD MILLION) 85
TABLE 76 AUSTRALIA & NEW ZEALAND: DEHYDRATED FRUITS & VEGETABLES MARKET, BY FORM, 2020-2027 (USD MILLION) 86
TABLE 77 AUSTRALIA & NEW ZEALAND: DEHYDRATED FRUITS & VEGETABLES MARKET, BY TYPE, 2020-2027 KILO TONS 86
TABLE 78 AUSTRALIA & NEW ZEALAND: DEHYDRATED FRUITS & VEGETABLES MARKET, BY FORM, 2020-2027 KILO TONS 87
TABLE 79 REST OF ASIA PACIFIC: DEHYDRATED FRUITS & VEGETABLES MARKET, BY TYPE, 2020-2027 (USD MILLION) 88
TABLE 80 REST OF ASIA PACIFIC: DEHYDRATED FRUITS & VEGETABLES MARKET, BY FORM, 2020-2027 (USD MILLION) 88
TABLE 81 REST OF ASIA PACIFIC: DEHYDRATED FRUITS & VEGETABLES MARKET, BY TYPE, 2020-2027 KILO TONS 89
TABLE 82 REST OF ASIA PACIFIC: DEHYDRATED FRUITS & VEGETABLES MARKET, BY FORM, 2020-2027 KILO TONS 90
TABLE 83 LATIN AMERICA: DEHYDRATED FRUITS & VEGETABLES MARKET, BY COUNTRY, 2020-2027 (USD MILLION) 91
TABLE 84 LATIN AMERICA: DEHYDRATED FRUITS & VEGETABLES MARKET, BY COUNTRY, 2020-2027 KILO TONS 91
TABLE 85 LATIN AMERICA: DEHYDRATED FRUITS & VEGETABLES MARKET, BY TYPE, 2020-2027 (USD MILLION) 92
TABLE 86 LATIN AMERICA: DEHYDRATED FRUITS & VEGETABLES MARKET, BY TYPE, 2020-2027 KILO TONS 93
TABLE 87 LATIN AMERICA: DEHYDRATED FRUITS & VEGETABLES MARKET, BY FORM, 2020-2027 (USD MILLION) 93
TABLE 88 LATIN AMERICA: DEHYDRATED FRUITS & VEGETABLES MARKET, BY FORM, 2020-2027 KILO TONS 94
TABLE 89 BRAZIL: DEHYDRATED FRUITS & VEGETABLES MARKET, BY TYPE, 2020-2027 (USD MILLION) 95
TABLE 90 BRAZIL: DEHYDRATED FRUITS & VEGETABLES MARKET, BY FORM, 2020-2027 (USD MILLION) 95
TABLE 91 BRAZIL: DEHYDRATED FRUITS & VEGETABLES MARKET, BY TYPE, 2020-2027 KILO TONS 96
TABLE 92 BRAZIL: DEHYDRATED FRUITS & VEGETABLES MARKET, BY FORM, 2020-2027 KILO TONS 96
TABLE 93 ARGENTINA: DEHYDRATED FRUITS & VEGETABLES MARKET, BY TYPE, 2020-2027 (USD MILLION) 97
TABLE 94 ARGENTINA: DEHYDRATED FRUITS & VEGETABLES MARKET, BY FORM, 2020-2027 (USD MILLION) 98
TABLE 95 ARGENTINA: DEHYDRATED FRUITS & VEGETABLES MARKET, BY TYPE, 2020-2027 KILO TONS 98
TABLE 96 ARGENTINA: DEHYDRATED FRUITS & VEGETABLES MARKET, BY FORM, 2020-2027 KILO TONS 99
TABLE 97 REST OF LATIN AMERICA: DEHYDRATED FRUITS & VEGETABLES MARKET, BY TYPE, 2020-2027 (USD MILLION) 100
TABLE 98 REST OF LATIN AMERICA: DEHYDRATED FRUITS & VEGETABLES MARKET, BY FORM, 2020-2027 (USD MILLION) 100
TABLE 99 REST OF LATIN AMERICA: DEHYDRATED FRUITS & VEGETABLES MARKET, BY TYPE, 2020-2027 KILO TONS 101
TABLE 100 REST OF LATIN AMERICA: DEHYDRATED FRUITS & VEGETABLES MARKET, BY FORM, 2020-2027 KILO TONS 102
TABLE 101 MIDDLE EAST & AFRICA: DEHYDRATED FRUITS & VEGETABLES MARKET, BY COUNTRY, 2020-2027 (USD MILLION) 102
TABLE 102 MIDDLE EAST & AFRICA: DEHYDRATED FRUITS & VEGETABLES MARKET, BY COUNTRY, 2020-2027 KILO TONS 103
TABLE 103 MIDDLE EAST & AFRICA: DEHYDRATED FRUITS & VEGETABLES MARKET, BY TYPE, 2020-2027 (USD MILLION) 103
TABLE 104 MIDDLE EAST & AFRICA: DEHYDRATED FRUITS & VEGETABLES MARKET, BY TYPE, 2020-2027 KILO TONS 104
TABLE 105 MIDDLE EAST & AFRICA: DEHYDRATED FRUITS & VEGETABLES MARKET, BY FORM, 2020-2027 (USD MILLION) 105
TABLE 106 MIDDLE EAST & AFRICA: DEHYDRATED FRUITS & VEGETABLES MARKET, BY FORM, 2020-2027 KILO TONS 105
TABLE 107 GCC COUNTRIES: DEHYDRATED FRUITS & VEGETABLES MARKET, BY TYPE, 2020-2027 (USD MILLION) 106
TABLE 108 GCC COUNTRIES: DEHYDRATED FRUITS & VEGETABLES MARKET, BY FORM, 2020-2027 (USD MILLION) 106
TABLE 109 GCC COUNTRIES: DEHYDRATED FRUITS & VEGETABLES MARKET, BY TYPE, 2020-2027 KILO TONS 107
TABLE 110 GCC COUNTRIES: DEHYDRATED FRUITS & VEGETABLES MARKET, BY FORM, 2020-2027 KILO TONS 108
TABLE 111 SOUTH AFRICA: DEHYDRATED FRUITS & VEGETABLES MARKET, BY TYPE, 2020-2027 (USD MILLION) 108
TABLE 112 SOUTH AFRICA: DEHYDRATED FRUITS & VEGETABLES MARKET, BY FORM, 2020-2027 (USD MILLION) 109
TABLE 113 SOUTH AFRICA: DEHYDRATED FRUITS & VEGETABLES MARKET, BY TYPE, 2020-2027 KILO TONS 110
TABLE 114 REST OF MIDDLE EAST & AFRICA: DEHYDRATED FRUITS & VEGETABLES MARKET, BY TYPE, 2020-2027 (USD MILLION) 111
TABLE 115 REST OF MIDDLE EAST & AFRICA: DEHYDRATED FRUITS & VEGETABLES MARKET, BY FORM, 2020-2027 (USD MILLION) 111
TABLE 116 REST OF MIDDLE EAST & AFRICA: DEHYDRATED FRUITS & VEGETABLES MARKET, BY TYPE, 2020-2027 KILO TONS 112
TABLE 117 REST OF MIDDLE EAST & AFRICA: DEHYDRATED FRUITS & VEGETABLES MARKET, BY FORM, 2020-2027 KILO TONS 113
 
11 List of Figures
FIGURE 1 GLOBAL DEHYDRATED FRUITS & VEGETABLES MARKET: MARKET STRUCTURE 15
FIGURE 2 KEY TAKEAWAYS OF THE DEHYDRATED FRUITS & VEGETABLES MARKET 16
FIGURE 3 KEY BUYING CRITERIA OF DEHYDRATED FRUITS & VEGETABLES 16
FIGURE 4 RESEARCH PROCESS OF MRFR 18
FIGURE 5 TOP DOWN & BOTTOM-UP APPROACH 21
FIGURE 6 MARKET DYNAMICS OF GLOBAL DEHYDRATED FRUITS & VEGETABLES MARKET 23
FIGURE 7 DRIVERS IMPACT ANALYSIS: GLOBAL DEHYDRATED FRUITS & VEGETABLES MARKET 25
FIGURE 8 RESTRAINTS IMPACT ANALYSIS: DEHYDRATED FRUITS & VEGETABLES MARKET 26
FIGURE 9 VALUE CHAIN ANALYSIS: DEHYDRATED FRUITS & VEGETABLES MARKET 29
FIGURE 10 SUPPLY CHAIN ANALYSIS: DEHYDRATED FRUITS & VEGETABLES MARKET 30
FIGURE 11 PORTER'S FIVE FORCES ANALYSIS OF THE GLOBAL DEHYDRATED FRUITS & VEGETABLES MARKET 31
$37.89 Bn
4.56%
North America
2021-2030
Market Snapshot
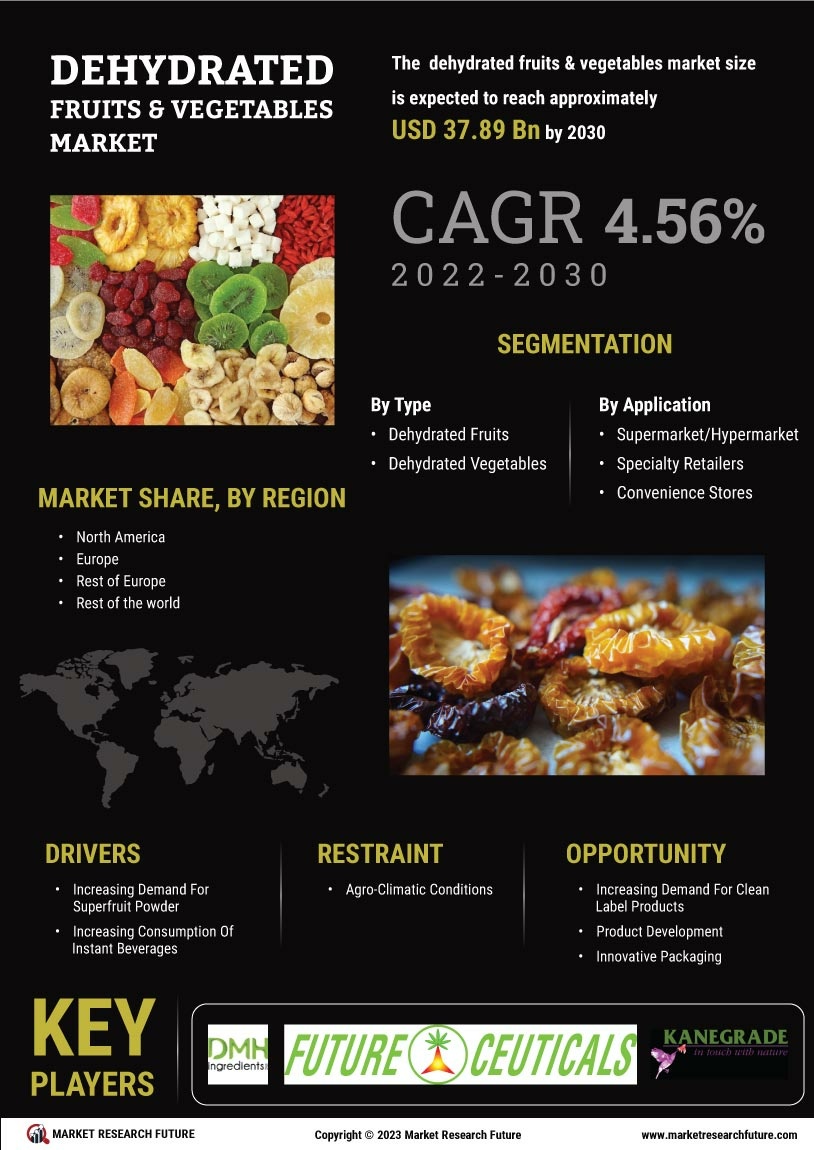
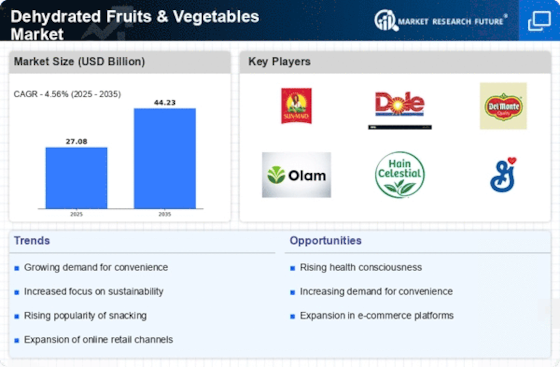
Global consumption of dehydrated fruits & vegetables continues to grow on the back of changing lifestyle and consumer purchasing pattern. At the same time, increased efforts to develop solutions that allow extended food preservation without the use of unhealthy preservatives is also driving the popularity of dehydrated fruits and vegetables. By 2030, the global market size for dehydrated fruits & vegetables is expected to surpass UDS 37.89 Bn at a CAGR 4.56%. This indicates towards a strong growth of the market during the review period (2021-2030). Dehydration of fruits & vegetables enhances their shelf life, which also makes a positive impact on profit margins for retailers as the spoilage rate reduces. Healthiness is major factor that also comes into play – dehydration usually preserves most of the nutrition and other properties of fruits and vegetables. Therefore, they are popular among health-conscious consumers.
Report Overview
This MRFR report focusses on the current market prospects for dehydrated fruits and vegetables on a global scale. It offers an in-depth analysis of the key aspects that are likely to influence the market trends in the forthcoming years. Major growth opportunities and threats are also discussed in the report. The scope of the research covers revenue assessment on the basis of fruits and vegetables. An analysis based on different forms (power, granules and others) of dehydrated fruits and vegetables is also available in the research document. It identifies new revenue pockets and makes an unbiased observation on their growth potentials. This report covers the dehydrated fruits & vegetables market across North America, Europe, Asia Pacific, Latin America and the Middle East & Africa (MEA), with the respective country-level market sizing.
Report Coverage
Historical market trends, market dynamics, forecast, market value by region as well as by segmentation, country-level analysis for each market segment, key player’s market share analysis and market factor analysis which covers Porter's five forces analysis of the market.
Players Covered
DMH Ingredients (U.S.), FutureCeuticals, Inc. (U.S.), Kanegrade Limited (U.K), Saipro Biotech Private Limited (India), NutraDry (Australia), Paradise Fruits Solutions Gmbh & Co. (Germany), Activz LLC (U.S.), Baobab Foods, LLC (U.S.), Milne MicroDried (U.S), Herbafood Ingredients GmbH (Germany).
Research Methodology
Market Research Future (MRFR) employs rigorous analytical methods combined with cutting-edge tools for delivering actionable insights. The projections are supported by statistically sound data sourced from an exclusive combination of primary and secondary research which includes in-person interviews with esteemed industry opinion holders, SEC filings, whitepaper references, paid database services, and, financial reports published by key players among others. Fail-safe scientific approaches are engaged for providing informative and critical market foresight, which enables our clients to identify opportunities and areas of concern. Emphasis is on delivering accurate and reliable statistical observations which assists the report users in devising impactful and intelligent growth strategies. Top-down and bottom-up approaches are employed to validate the accuracy of market size and revenue estimation. A multi-layer verification process ensures the forecast and analysis consistency, which reaffirms the quality of the market intelligence delivered through our reports.
Other Description
For the scope of the research, MRFR’s report offers a comprehensive segmental analysis of the global market for dehydrated fruits & vegetable
By Type
By Form
By Region
Intended Audience:
Frequently Asked Questions (FAQ) :
Dehydrated Fruits & Vegetables Market valuation in 2016 was USD 22.34 billion.
Dehydrated Fruits & Vegetables Market valuation in 2030 would be USD 37.89 bn.
Dehydrated Fruits & Vegetables Market valuation would 4.56% during the forecast 2030.
The powder form would lead Dehydrated Fruits & Vegetables Market.
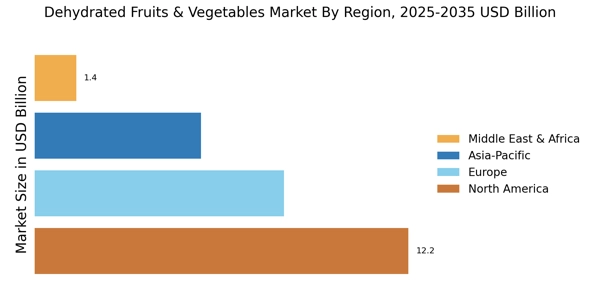
North America would enjoy the control of the Dehydrated Fruits & Vegetables Market.
Key players in the dehydrated fruits & vegetable market have a high focus on strategic product launch to draw attention towards their product range
Global dehydrated fruits & vegetable market is a progressing market with key market players intensely competing at the global level. The key industry players in the dehydrated fruits & vegetables market have adopted strategies such as geographic expansion, partnership, acquisition, new product development, and product promotion to strengthen their business portfolio. Most of the companies operating in this market are focusing on expanding their operations across the geographies, expanding their capabilities and investing in research and development to offer products with better functionality.
The key players involved in this strategy are DMH Ingredients (U.S.), FutureCeuticals, Inc. (U.S.), Kanegrade Limited (U.K), Saipro Biotech Private Limited (India), NutraDry (Australia), Paradise Fruits Solutions Gmbh & Co. (Germany), Activz LLC (U.S.), Baobab Foods, LLC (U.S.), Milne MicroDried (U.S), Herbafood Ingredients GmbH (Germany) are among others.
DMH Ingredients, Inc. provides food services. The Company wholesale distributes artificial sweeteners, coffee and tea, dehydrated vegetables, essential oils, flavors, food chemicals, freeze-dried fruits, fruit powders, gums, natural sweeteners, nuts and seeds, oleoresins, savory, and spices. DMH Ingredients operates throughout the United States. The company is strongly positioned and committed to driving growth in specific niches within dairy and other food segments. Also, high inclination towards technological advancements to cater to emerging consumer and food market trends, and deliver high impact and value to its customers is found to be one of the strategies. Furthermore, the increase in production capacity of dehydrated fruits is anticipated to uplift the company’s growth in terms of revenue.
FutureCeuticals, Inc. manufactures, develops vegetables and fruit-based powders for cosmetics, functional food, and dietary supplements. The company is a subsidiary company of R. J. Van Drunen & Sons, Inc. The company majorly focuses on the growth strategy. The company also focuses on identifying new paths to enhance performance and generate revenue through diversified sectors, geographies, products, and solutions. The company is deeply committed to scientific innovation and to continue as a leading investor in industrial R&D, driving sustained long-term growth through greater flexibility, external orientation, speed – and ultimately greater returns. Furthermore, the company is focused on creating brand awareness through various promotional activities.
Kanegrade Limited is a leading supplier of ingredients to major food, pharmaceutical, flavor, and beverage manufacturers. The company's line of business includes manufacturing prepared foods and miscellaneous food specialties. The company also believes in collaborating with various partners across the supply chain to offer advanced products to the consumers. Together with the value-contributing acquisitions the company has strengthened its businesses segments. The company also plans to expand its operations to the existing and new geographical markets to increase their revenue stream further.