Request Free Sample ×

Kindly complete the form below to receive a free sample of this Report

* Please use a valid business email

Leading companies partner with us for data-driven Insights

clients tt-cursor
Hero Background

Tower Mounted Amplifier Market

ID: MRFR/SEM/31025-HCR
200 Pages
Aarti Dhapte
Last Updated: April 06, 2026

Informe de investigación de mercado de Amplificadores montados en torre (TMA) por tipo de amplificador (amplificadores de estado sólido, amplificadores de tubo de onda progresiva, amplificadores de alta potencia), por aplicación (telecomunicaciones, radiodifusión, comunicación por satélite), por rango de frecuencia (VHF, UHF, SHF, EHF), por potencia de salida (baja potencia, media potencia, alta potencia), por tipo de instalación (interior, exterior) y por región (América del Norte, Europa, América del Sur, Asia Pacífico, Medio Oriente y África): pronóstico para 2032

Compartir
Download PDF ×

We do not share your information with anyone. However, we may send you emails based on your report interest from time to time. You may contact us at any time to opt-out.

Tower Mounted Amplifier Market Infographic
Purchase Options
  1. 1 RESUMEN EJECUTIVO
    1. 1.1 Descripción general del mercado
    2. 1.2 Hallazgos clave
    3. 1.3 Segmentación del mercado
    4. 1.4 Panorama Competitivo
    5. 1.5 Retos y Oportunidades
    6. 1.6 Perspectivas futuras
  2. 2 INTRODUCCIÓN AL MERCADO
    1. 2.1 Definición
    2. 2.2 Alcance del estudio
      1. 2.2.1 Objetivo de la investigación
      2. 2.2.2 Supuesto
      3. 2.2.3 Limitaciones
  3. 3 METODOLOGÍA DE LA INVESTIGACIÓN
    1. 3.1 Descripción general
    2. 3.2 Minería de datos
    3. 3.3 Investigación Secundaria
    4. 3.4 Investigación Primaria
      1. 3.4.1 Entrevistas primarias y proceso de recopilación de información
      2. 3.4.2 Desglose de los encuestados principales
    5. 3.5 Modelo de previsión
    6. 3.6 Estimación del tamaño del mercado
      1. 3.6.1 Enfoque ascendente
      2. 3.6.2 Enfoque de arriba hacia abajo
    7. 3.7 Triangulación de datos
    8. 3.8 Validación
  4. 4 DINÁMICA DEL MERCADO
    1. 4.1 Descripción general
    2. 4.2 Conductores
    3. 4.3 Restricciones
    4. 4.4 Oportunidades
  5. 5 ANÁLISIS DE FACTORES DE MERCADO
    1. 5.1 Análisis de la cadena de valor
    2. 5.2 Análisis de las cinco fuerzas de Porter
      1. 5.2.1 Poder de negociación de los proveedores
      2. 5.2.2 Poder de negociación de los compradores
      3. 5.2.3 Amenaza de nuevos participantes
      4. 5.2.4 Amenaza de sustitutos
      5. 5.2.5 Intensidad de la rivalidad
    3. 5.3 Análisis de impacto de COVID-19
      1. 5.3.1 Análisis de Impacto en el Mercado
      2. 5.3.2 Impacto Regional
      3. 5.3.3 Análisis de oportunidades y amenazas
  6. 6 MERCADO DE AMPLIFICADORES TMA MONTADOS EN TORRE, POR TIPO DE AMPLIFICADOR (MILLONES DE USD)
    1. 6.1 Amplificadores de Estado Sólido
    2. 6.2 Amplificadores de válvulas de onda viajera
    3. 6.3 Amplificadores de alta potencia
  7. 7 MERCADO DE AMPLIFICADORES TMA MONTADOS EN TORRE, POR APLICACIÓN (MILLONES DE USD)
    1. 7.1 Telecomunicaciones
    2. 7.2 Radiodifusión
    3. 7.3 Comunicación por satélite
  8. 8 MERCADO DE AMPLIFICADORES TMA MONTADOS EN TORRE, POR RANGO DE FRECUENCIA (MILLONES DE USD)
    1. 8.1 VHF
    2. 8.2 UHF
    3. 8.3 SHF
    4. 8.4 EHF
  9. 9 MERCADO DE AMPLIFICADORES TMA MONTADOS EN TORRE, POR POTENCIA DE SALIDA (MILLONES DE USD)
    1. 9.1 Bajo consumo
    2. 9.2 Potencia Media
    3. 9.3 Alta potencia
  10. 10 MERCADO DE AMPLIFICADORES TMA MONTADOS EN TORRE, POR TIPO DE INSTALACIÓN (MILLONES DE USD)
    1. 10.1 Interior
    2. 10.2 Exterior
  11. 11 MERCADO DE AMPLIFICADORES TMA MONTADOS EN TORRE, POR REGIONAL (MILLONES DE USD)
    1. 11.1 América del Norte
      1. 11.1.1 Estados Unidos
      2. 11.1.2 Canadá
    2. 11.2 Europa
      1. 11.2.1 Alemania
      2. 11.2.2 Reino Unido
      3. 11.2.3 Francia
      4. 11.2.4 Rusia
      5. 11.2.5 Italia
      6. 11.2.6 España
      7. 11.2.7 Resto de Europa
    3. 11.3 Asia Pacífico
      1. 11.3.1 China
      2. 11.3.2 India
      3. 11.3.3 Japón
      4. 11.3.4 Corea del Sur
      5. 11.3.5 Malasia
      6. 11.3.6 Tailandia
      7. 11.3.7 Indonesia
      8. 11.3.8 Resto de APAC
    4. 11.4 América del Sur
      1. 11.4.1 Brasil
      2. 11.4.2 México
      3. 11.4.3 Argentina
      4. 11.4.4 Resto de Sudamérica
    5. 11.5 AMUMA
      1. 11.5.1 Países del CCG
      2. 11.5.2 Sudáfrica
      3. 11.5.3 Resto de MEA
  12. 12 PANORAMA COMPETITIVO
    1. 12.1 Descripción general
    2. 12.2 Análisis competitivo
    3. 12.3 Análisis de cuota de mercado
    4. 12.4 Importante estrategia de crecimiento en el mercado TMA de amplificadores montados en torre
    5. 12.5 Benchmarking Competitivo
    6. 12.6 Principales actores en términos de número de desarrollos en el mercado TMA de amplificadores montados en torre
    7. 12.7 Desarrollos clave y estrategias de crecimiento
      1. 12.7.1 Lanzamiento de nuevos productos/implementación de servicios
      2. 12.7.2 Fusión y Adquisiciones
      3. 12.7.3 Empresas conjuntas
    8. 12.8 Matriz financiera de los principales actores
      1. 12.8.1 Ventas e ingresos operativos
      2. 12.8.2 Gasto en I+D de los principales actores. 2023
  13. 13 PERFILES DE LA EMPRESA
    1. 13.1 Corporación Harris
      1. 13.1.1 Panorama financiero
      2. 13.1.2 Productos Ofrecidos
      3. 13.1.3 Desarrollos clave
      4. 13.1.4 Análisis FODA
      5. 13.1.5 Estrategias clave
    2. 13.2 Corporación EMR
      1. 13.2.1 Panorama financiero
      2. 13.2.2 Productos Ofrecidos
      3. 13.2.3 Desarrollos clave
      4. 13.2.4 Análisis FODA
      5. 13.2.5 Estrategias clave
    3. 13.3 Tecnologías Teledyne
      1. 13.3.1 Panorama financiero
      2. 13.3.2 Productos Ofrecidos
      3. 13.3.3 Desarrollos clave
      4. 13.3.4 Análisis FODA
      5. 13.3.5 Estrategias clave
    4. 13.4 Nokia
      1. 13.4.1 Panorama financiero
      2. 13.4.2 Productos Ofrecidos
      3. 13.4.3 Desarrollos clave
      4. 13.4.4 Análisis FODA
      5. 13.4.5 Estrategias clave
    5. 13.5 Tecnologías Alfa
      1. 13.5.1 Panorama financiero
      2. 13.5.2 Productos ofrecidos
      3. 13.5.3 Desarrollos clave
      4. 13.5.4 Análisis FODA
      5. 13.5.5 Estrategias clave
    6. 13.6 KMW
      1. 13.6.1 Panorama financiero
      2. 13.6.2 Productos ofrecidos
      3. 13.6.3 Desarrollos clave
      4. 13.6.4 Análisis FODA
      5. 13.6.5 Estrategias clave
    7. 13.7 CommScope
      1. 13.7.1 Panorama financiero
      2. 13.7.2 Productos ofrecidos
      3. 13.7.3 Desarrollos clave
      4. 13.7.4 Análisis FODA
      5. 13.7.5 Estrategias clave
    8. 13.8 Inalámbrico Wildflower
      1. 13.8.1 Panorama financiero
      2. 13.8.2 Productos ofrecidos
      3. 13.8.3 Desarrollos clave
      4. 13.8.4 Análisis FODA
      5. 13.8.5 Estrategias clave
    9. 13.9 Fujikura
      1. 13.9.1 Panorama financiero
      2. 13.9.2 Productos Ofrecidos
      3. 13.9.3 Desarrollos clave
      4. 13.9.4 Análisis FODA
      5. 13.9.5 Estrategias clave
    10. 13.10 Soluciones Viavi
      1. 13.10.1 Panorama financiero
      2. 13.10.2 Productos Ofrecidos
      3. 13.10.3 Desarrollos clave
      4. 13.10.4 Análisis FODA
      5. 13.10.5 Estrategias clave
    11. 13.11 Optus
      1. 13.11.1 Panorama financiero
      2. 13.11.2 Productos Ofrecidos
      3. 13.11.3 Desarrollos clave
      4. 13.11.4 Análisis FODA
      5. 13.11.5 Estrategias clave
    12. 13.12 Anfenol
      1. 13.12.1 Panorama financiero
      2. 13.12.2 Productos Ofrecidos
      3. 13.12.3 Desarrollos clave
      4. 13.12.4 Análisis FODA
      5. 13.12.5 Estrategias clave
    13. 13.13 Cobham Wireless
      1. 13.13.1 Panorama financiero
      2. 13.13.2 Productos Ofrecidos
      3. 13.13.3 Desarrollos clave
      4. 13.13.4 Análisis FODA
      5. 13.13.5 Estrategias clave
    14. 13.14 PCT Internacional
      1. 13.14.1 Panorama financiero
      2. 13.14.2 Productos Ofrecidos
      3. 13.14.3 Desarrollos clave
      4. 13.14.4 Análisis FODA
      5. 13.14.5 Estrategias clave
    15. 13.15 RFS
      1. 13.15.1 Panorama financiero
      2. 13.15.2 Productos Ofrecidos
      3. 13.15.3 Desarrollos clave
      4. 13.15.4 Análisis FODA
      5. 13.15.5 Estrategias clave
  14. 14 APÉNDICE
    1. 14.1 Referencias
    2. 14.2 Informes relacionados
    3. LISTA DE TABLAS
    4. TABLA 1. LISTA DE SUPUESTOS
    5. TABLA 2. ESTIMACIONES DEL TAMAÑO DEL MERCADO TMA DE AMPLIFICADOR MONTADO EN TORRE DE AMÉRICA DEL NORTE &erio; PRONÓSTICO, POR TIPO DE AMPLIFICADOR, 2019-2032 (MILES DE MILLONES DE USD)
    6. TABLA 3. ESTIMACIONES Y ESTIMACIONES DEL TAMAÑO DEL MERCADO TMA DE AMPLIFICADOR MONTADO EN TORRE DE AMÉRICA DEL NORTE. PRONÓSTICO, POR APLICACIÓN, 2019-2032 (MILES DE MILLONES DE USD)
    7. TABLA 4. ESTIMACIONES Y ESTIMACIONES DEL TAMAÑO DEL MERCADO TMA DE AMPLIFICADOR MONTADO EN TORRE DE AMÉRICA DEL NORTE. PRONÓSTICO, POR RANGO DE FRECUENCIA, 2019-2032 (MILES DE MILLONES DE USD)
    8. TABLA 5. ESTIMACIONES Y ESTIMACIONES DEL TAMAÑO DEL MERCADO TMA DE AMPLIFICADOR MONTADO EN TORRE DE AMÉRICA DEL NORTE. PRONÓSTICO, POR POTENCIA DE SALIDA, 2019-2032 (MILES DE MILLONES DE USD)
    9. TABLA 6. ESTIMACIONES Y ESTIMACIONES DEL TAMAÑO DEL MERCADO TMA DE AMPLIFICADOR MONTADO EN TORRE DE AMÉRICA DEL NORTE. PRONÓSTICO, POR TIPO DE INSTALACIÓN, 2019-2032 (MILES DE MILLONES DE USD)
    10. TABLA 7. ESTIMACIONES Y ESTIMACIONES DEL TAMAÑO DEL MERCADO TMA DE AMPLIFICADOR MONTADO EN TORRE DE AMÉRICA DEL NORTE. PRONÓSTICO, POR REGIONAL, 2019-2032 (MILES DE MILLONES DE USD)
    11. TABLA 8. ESTIMACIONES Y ESTIMACIONES DEL TAMAÑO DEL MERCADO TMA DE AMPLIFICADOR MONTADO EN TORRE DE EE. UU. PRONÓSTICO, POR TIPO DE AMPLIFICADOR, 2019-2032 (MILES DE MILLONES DE USD)
    12. TABLA 9. ESTIMACIONES Y ESTIMACIONES DEL TAMAÑO DEL MERCADO TMA DE AMPLIFICADOR MONTADO EN TORRE DE EE. UU. PRONÓSTICO, POR APLICACIÓN, 2019-2032 (MILES DE MILLONES DE USD)
    13. TABLA 10. ESTIMACIONES Y ESTIMACIONES DEL TAMAÑO DEL MERCADO TMA DEL AMPLIFICADOR MONTADO EN TORRE DE EE. UU. PRONÓSTICO, POR RANGO DE FRECUENCIA, 2019-2032 (MILES DE MILLONES DE USD)
    14. TABLA 11. ESTIMACIONES Y ESTIMACIONES DEL TAMAÑO DEL MERCADO TMA DE AMPLIFICADOR MONTADO EN TORRE DE EE. UU. PRONÓSTICO, POR POTENCIA DE SALIDA, 2019-2032 (MILES DE MILLONES DE USD)
    15. TABLA 12. ESTIMACIONES Y ESTIMACIONES DEL TAMAÑO DEL MERCADO TMA DEL AMPLIFICADOR MONTADO EN TORRE DE EE. UU. PRONÓSTICO, POR TIPO DE INSTALACIÓN, 2019-2032 (MILES DE MILLONES DE USD)
    16. TABLA 13. ESTIMACIONES Y ESTIMACIONES DEL TAMAÑO DEL MERCADO TMA DEL AMPLIFICADOR MONTADO EN TORRE DE EE. UU. PRONÓSTICO, POR REGIONAL, 2019-2032 (MILES DE MILLONES DE USD)
    17. TABLA 14. ESTIMACIONES Y ESTIMACIONES DEL TAMAÑO DEL MERCADO TMA DEL AMPLIFICADOR MONTADO EN TORRE DE CANADÁ. PRONÓSTICO, POR TIPO DE AMPLIFICADOR, 2019-2032 (MILES DE MILLONES DE USD)
    18. TABLA 15. ESTIMACIONES Y ESTIMACIONES DEL TAMAÑO DEL MERCADO TMA DE AMPLIFICADOR MONTADO EN TORRE DE CANADÁ. PRONÓSTICO, POR APLICACIÓN, 2019-2032 (MILES DE MILLONES DE USD)
    19. TABLA 16. ESTIMACIONES Y POTENCIAS DEL TAMAÑO DEL MERCADO TMA DEL AMPLIFICADOR MONTADO EN TORRE DE CANADÁ. PRONÓSTICO, POR RANGO DE FRECUENCIA, 2019-2032 (MILES DE MILLONES DE USD)
    20. TABLA 17. ESTIMACIONES Y ESTIMACIONES DEL TAMAÑO DEL MERCADO TMA DEL AMPLIFICADOR MONTADO EN TORRE DE CANADÁ. PRONÓSTICO, POR POTENCIA DE SALIDA, 2019-2032 (MILES DE MILLONES DE USD)
    21. TABLA 18. ESTIMACIONES Y ESTIMACIONES DEL TAMAÑO DEL MERCADO TMA DEL AMPLIFICADOR MONTADO EN TORRE DE CANADÁ. PRONÓSTICO, POR TIPO DE INSTALACIÓN, 2019-2032 (MILES DE MILLONES DE USD)
    22. TABLA 19. ESTIMACIONES Y ESTIMACIONES DEL TAMAÑO DEL MERCADO TMA DEL AMPLIFICADOR MONTADO EN TORRE DE CANADÁ. PRONÓSTICO, POR REGIONAL, 2019-2032 (MILES DE MILLONES DE USD)
    23. TABLA 20. ESTIMACIONES Y ESTIMACIONES DEL TAMAÑO DEL MERCADO TMA DE AMPLIFICADOR MONTADO EN TORRE EN EUROPA. PRONÓSTICO, POR TIPO DE AMPLIFICADOR, 2019-2032 (MILES DE MILLONES DE USD)
    24. TABLA 21. ESTIMACIONES Y ESTIMACIONES DEL TAMAÑO DEL MERCADO TMA DE AMPLIFICADOR MONTADO EN TORRE EN EUROPA. PRONÓSTICO, POR APLICACIÓN, 2019-2032 (MILES DE MILLONES DE USD)
    25. TABLA 22. ESTIMACIONES Y ESTIMACIONES DEL TAMAÑO DEL MERCADO TMA DE AMPLIFICADOR MONTADO EN TORRE EN EUROPA. PRONÓSTICO, POR RANGO DE FRECUENCIA, 2019-2032 (MILES DE MILLONES DE USD)
    26. TABLA 23. ESTIMACIONES Y ESTIMACIONES DEL TAMAÑO DEL MERCADO TMA DE AMPLIFICADOR MONTADO EN TORRE EN EUROPA. PRONÓSTICO, POR POTENCIA DE SALIDA, 2019-2032 (MILES DE MILLONES DE USD)
    27. TABLA 24. ESTIMACIONES Y ESTIMACIONES DEL TAMAÑO DEL MERCADO TMA DEL AMPLIFICADOR MONTADO EN TORRE EN EUROPA. PRONÓSTICO, POR TIPO DE INSTALACIÓN, 2019-2032 (MILES DE MILLONES DE USD)
    28. TABLA 25. ESTIMACIONES Y ESTIMACIONES DEL TAMAÑO DEL MERCADO TMA DE AMPLIFICADOR MONTADO EN TORRE EN EUROPA. PRONÓSTICO, POR REGIONAL, 2019-2032 (MILES DE MILLONES DE USD)
    29. TABLA 26. ESTIMACIONES Y ESTIMACIONES DEL TAMAÑO DEL MERCADO TMA DEL AMPLIFICADOR MONTADO EN TORRE DE ALEMANIA. PRONÓSTICO, POR TIPO DE AMPLIFICADOR, 2019-2032 (MILES DE MILLONES DE USD)
    30. TABLA 27. ESTIMACIONES Y ESTIMACIONES DEL TAMAÑO DEL MERCADO TMA DE AMPLIFICADOR MONTADO EN TORRE DE ALEMANIA. PRONÓSTICO, POR APLICACIÓN, 2019-2032 (MILES DE MILLONES DE USD)
    31. TABLA 28. ESTIMACIONES Y ESTIMACIONES DEL TAMAÑO DEL MERCADO TMA DEL AMPLIFICADOR MONTADO EN TORRE DE ALEMANIA. PRONÓSTICO, POR RANGO DE FRECUENCIA, 2019-2032 (MILES DE MILLONES DE USD)
    32. TABLA 29. ESTIMACIONES Y ESTIMACIONES DEL TAMAÑO DEL MERCADO TMA DE AMPLIFICADOR MONTADO EN TORRE DE ALEMANIA. PRONÓSTICO, POR POTENCIA DE SALIDA, 2019-2032 (MILES DE MILLONES DE USD)
    33. TABLA 30. ESTIMACIONES Y ESTIMACIONES DEL TAMAÑO DEL MERCADO TMA DEL AMPLIFICADOR MONTADO EN TORRE DE ALEMANIA. PRONÓSTICO, POR TIPO DE INSTALACIÓN, 2019-2032 (MILES DE MILLONES DE USD)
    34. TABLA 31. ESTIMACIONES Y ESTIMACIONES DEL TAMAÑO DEL MERCADO TMA DEL AMPLIFICADOR MONTADO EN TORRE DE ALEMANIA. PRONÓSTICO, POR REGIONAL, 2019-2032 (MILES DE MILLONES DE USD)
    35. TABLA 32. ESTIMACIONES Y ESTIMACIONES DEL TAMAÑO DEL MERCADO TMA DEL AMPLIFICADOR MONTADO EN TORRE DEL REINO UNIDO. PRONÓSTICO, POR TIPO DE AMPLIFICADOR, 2019-2032 (MILES DE MILLONES DE USD)
    36. TABLA 33. ESTIMACIONES Y ESTIMACIONES DEL TAMAÑO DEL MERCADO TMA DE AMPLIFICADOR MONTADO EN TORRE DEL REINO UNIDO. PRONÓSTICO, POR APLICACIÓN, 2019-2032 (MILES DE MILLONES DE USD)
    37. TABLA 34. ESTIMACIONES Y ESTIMACIONES DEL TAMAÑO DEL MERCADO TMA DEL AMPLIFICADOR MONTADO EN TORRE DEL REINO UNIDO. PRONÓSTICO, POR RANGO DE FRECUENCIA, 2019-2032 (MILES DE MILLONES DE USD)
    38. TABLA 35. ESTIMACIONES Y ESTIMACIONES DEL TAMAÑO DEL MERCADO TMA DEL AMPLIFICADOR MONTADO EN TORRE DEL REINO UNIDO. PRONÓSTICO, POR POTENCIA DE SALIDA, 2019-2032 (MILES DE MILLONES DE USD)
    39. TABLA 36. ESTIMACIONES Y ESTIMACIONES DEL TAMAÑO DEL MERCADO TMA DEL AMPLIFICADOR MONTADO EN TORRE DEL REINO UNIDO. PRONÓSTICO, POR TIPO DE INSTALACIÓN, 2019-2032 (MILES DE MILLONES DE USD)
    40. TABLA 37. ESTIMACIONES Y ESTIMACIONES DEL TAMAÑO DEL MERCADO TMA DEL AMPLIFICADOR MONTADO EN TORRE DEL REINO UNIDO. PRONÓSTICO, POR REGIONAL, 2019-2032 (MILES DE MILLONES DE USD)
    41. TABLA 38. ESTIMACIONES DEL TAMAÑO DEL MERCADO TMA DEL AMPLIFICADOR MONTADO EN TORRE DE FRANCIA Y ESTIMACIONES Y PREVISIÓN DE TAMAÑO DEL MERCADO TMA DE AMPLIFICADOR MONTADO EN TORRE EN FRANCIA. PRONÓSTICO, POR TIPO DE AMPLIFICADOR, 2019-2032 (MILES DE MILLONES DE USD)
    42. TABLA 39. ESTIMACIONES Y ESTIMACIONES DEL TAMAÑO DEL MERCADO TMA DE AMPLIFICADOR MONTADO EN TORRE DE FRANCIA. PRONÓSTICO, POR APLICACIÓN, 2019-2032 (MILES DE MILLONES DE USD)
    43. TABLA 40. ESTIMACIONES DEL TAMAÑO DEL MERCADO TMA DEL AMPLIFICADOR MONTADO EN TORRE DE FRANCIA Y ESTIMACIONES Y PRONÓSTICOS DEL TAMAÑO DEL MERCADO TMA DEL AMPLIFICADOR MONTADO EN TORRE DE FRANCIA. PRONÓSTICO, POR RANGO DE FRECUENCIA, 2019-2032 (MILES DE MILLONES DE USD)
    44. TABLA 41. ESTIMACIONES Y ESTIMACIONES DEL TAMAÑO DEL MERCADO TMA DE AMPLIFICADOR MONTADO EN TORRE DE FRANCIA. PRONÓSTICO, POR POTENCIA DE SALIDA, 2019-2032 (MILES DE MILLONES DE USD)
    45. TABLA 42. ESTIMACIONES DEL TAMAÑO DEL MERCADO TMA DEL AMPLIFICADOR MONTADO EN TORRE DE FRANCIA Y ESTIMACIONES DE TAMAÑO DEL MERCADO TMA DEL AMPLIFICADOR MONTADO EN TORRE DE FRANCIA. PRONÓSTICO, POR TIPO DE INSTALACIÓN, 2019-2032 (MILES DE MILLONES DE USD)
    46. TABLA 43. ESTIMACIONES Y ESTIMACIONES DEL TAMAÑO DEL MERCADO TMA DEL AMPLIFICADOR MONTADO EN TORRE DE FRANCIA. PRONÓSTICO, POR REGIONAL, 2019-2032 (MILES DE MILLONES DE USD)
    47. TABLA 44. ESTIMACIONES Y ESTIMACIONES DEL TAMAÑO DEL MERCADO TMA DEL AMPLIFICADOR MONTADO EN TORRE DE RUSIA. PRONÓSTICO, POR AMTIPO DE PLIFICADOR, 2019-2032 (MILES DE MILLONES DE USD)
    48. TABLA 45. ESTIMACIONES Y ESTIMACIONES DEL TAMAÑO DEL MERCADO TMA DEL AMPLIFICADOR MONTADO EN TORRE DE RUSIA. PRONÓSTICO, POR APLICACIÓN, 2019-2032 (MILES DE MILLONES DE USD)
    49. TABLA 46. ESTIMACIONES Y ESTIMACIONES DEL TAMAÑO DEL MERCADO TMA DEL AMPLIFICADOR MONTADO EN TORRE DE RUSIA. PRONÓSTICO, POR RANGO DE FRECUENCIA, 2019-2032 (MILES DE MILLONES DE USD)
    50. TABLA 47. ESTIMACIONES Y ESTIMACIONES DEL TAMAÑO DEL MERCADO TMA DEL AMPLIFICADOR MONTADO EN TORRE DE RUSIA. PRONÓSTICO, POR POTENCIA DE SALIDA, 2019-2032 (MILES DE MILLONES DE USD)
    51. TABLA 48. ESTIMACIONES Y ESTIMACIONES DEL TAMAÑO DEL MERCADO TMA DEL AMPLIFICADOR MONTADO EN TORRE DE RUSIA. PRONÓSTICO, POR TIPO DE INSTALACIÓN, 2019-2032 (MILES DE MILLONES DE USD)
    52. TABLA 49. ESTIMACIONES Y ESTIMACIONES DEL TAMAÑO DEL MERCADO TMA DEL AMPLIFICADOR MONTADO EN TORRE DE RUSIA. PRONÓSTICO, POR REGIONAL, 2019-2032 (MILES DE MILLONES DE USD)
    53. TABLA 50. ESTIMACIONES Y ESTIMACIONES DEL TAMAÑO DEL MERCADO TMA DEL AMPLIFICADOR MONTADO EN TORRE DE ITALIA. PRONÓSTICO, POR TIPO DE AMPLIFICADOR, 2019-2032 (MILES DE MILLONES DE USD)
    54. TABLA 51. ESTIMACIONES Y ESTIMACIONES DEL TAMAÑO DEL MERCADO TMA DE AMPLIFICADOR MONTADO EN TORRE DE ITALIA. PRONÓSTICO, POR APLICACIÓN, 2019-2032 (MILES DE MILLONES DE USD)
    55. TABLA 52. ESTIMACIONES Y ESTIMACIONES DEL TAMAÑO DEL MERCADO TMA DEL AMPLIFICADOR MONTADO EN TORRE DE ITALIA. PRONÓSTICO, POR RANGO DE FRECUENCIA, 2019-2032 (MILES DE MILLONES DE USD)
    56. TABLA 53. ESTIMACIONES Y ESTIMACIONES DEL TAMAÑO DEL MERCADO TMA DE AMPLIFICADOR MONTADO EN TORRE DE ITALIA. PRONÓSTICO, POR POTENCIA DE SALIDA, 2019-2032 (MILES DE MILLONES DE USD)
    57. TABLA 54. ESTIMACIONES Y ESTIMACIONES DEL TAMAÑO DEL MERCADO TMA DEL AMPLIFICADOR MONTADO EN TORRE DE ITALIA. PRONÓSTICO, POR TIPO DE INSTALACIÓN, 2019-2032 (MILES DE MILLONES DE USD)
    58. TABLA 55. ESTIMACIONES Y ESTIMACIONES DEL TAMAÑO DEL MERCADO TMA DEL AMPLIFICADOR MONTADO EN TORRE DE ITALIA. PRONÓSTICO, POR REGIONAL, 2019-2032 (MILES DE MILLONES DE USD)
    59. TABLA 56. ESTIMACIONES Y ESTIMACIONES DEL TAMAÑO DEL MERCADO TMA DEL AMPLIFICADOR MONTADO EN TORRE EN ESPAÑA. PRONÓSTICO, POR TIPO DE AMPLIFICADOR, 2019-2032 (MILES DE MILLONES DE USD)
    60. TABLA 57. ESTIMACIONES Y ESTIMACIONES DEL TAMAÑO DEL MERCADO TMA DE AMPLIFICADOR MONTADO EN TORRE EN ESPAÑA. PRONÓSTICO, POR APLICACIÓN, 2019-2032 (MILES DE MILLONES DE USD)
    61. TABLA 58. ESTIMACIONES Y ESTIMACIONES DEL TAMAÑO DEL MERCADO TMA DEL AMPLIFICADOR MONTADO EN TORRE EN ESPAÑA. PRONÓSTICO, POR RANGO DE FRECUENCIA, 2019-2032 (MILES DE MILLONES DE USD)
    62. TABLA 59. ESTIMACIONES Y ESTIMACIONES DEL TAMAÑO DEL MERCADO TMA DE AMPLIFICADORES MONTADOS EN TORRE EN ESPAÑA. PRONÓSTICO, POR POTENCIA DE SALIDA, 2019-2032 (MILES DE MILLONES DE USD)
    63. TABLA 60. ESTIMACIONES Y ESTIMACIONES DEL TAMAÑO DEL MERCADO TMA DEL AMPLIFICADOR MONTADO EN TORRE EN ESPAÑA. PRONÓSTICO, POR TIPO DE INSTALACIÓN, 2019-2032 (MILES DE MILLONES DE USD)
    64. TABLA 61. ESTIMACIONES Y ESTIMACIONES DEL TAMAÑO DEL MERCADO TMA DEL AMPLIFICADOR MONTADO EN TORRE EN ESPAÑA. PRONÓSTICO, POR REGIONAL, 2019-2032 (MILES DE MILLONES DE USD)
    65. TABLA 62. ESTIMACIONES Y ESTIMACIONES DEL TAMAÑO DEL MERCADO TMA DEL AMPLIFICADOR MONTADO EN TORRE DEL RESTO DE EUROPA. PRONÓSTICO, POR TIPO DE AMPLIFICADOR, 2019-2032 (MILES DE MILLONES DE USD)
    66. TABLA 63. ESTIMACIONES Y ESTIMACIONES DEL TAMAÑO DEL MERCADO TMA DE AMPLIFICADOR MONTADO EN TORRE DEL RESTO DE EUROPA. PRONÓSTICO, POR APLICACIÓN, 2019-2032 (MILES DE MILLONES DE USD)
    67. TABLA 64. ESTIMACIONES Y ESTIMACIONES DEL TAMAÑO DEL MERCADO TMA DEL AMPLIFICADOR MONTADO EN TORRE DEL RESTO DE EUROPA. PRONÓSTICO, POR RANGO DE FRECUENCIA, 2019-2032 (MILES DE MILLONES DE USD)
    68. TABLA 65. ESTIMACIONES Y ESTIMACIONES DEL TAMAÑO DEL MERCADO TMA DE AMPLIFICADOR MONTADO EN TORRE DEL RESTO DE EUROPA. PRONÓSTICO, POR POTENCIA DE SALIDA, 2019-2032 (MILES DE MILLONES DE USD)
    69. TABLA 66. ESTIMACIONES Y ESTIMACIONES DEL TAMAÑO DEL MERCADO TMA DE AMPLIFICADORES MONTADOS EN TORRE DEL RESTO DE EUROPA. PRONÓSTICO, POR TIPO DE INSTALACIÓN, 2019-2032 (MILES DE MILLONES DE USD)
    70. TABLA 67. ESTIMACIONES Y ESTIMACIONES DEL TAMAÑO DEL MERCADO TMA DE AMPLIFICADOR MONTADO EN TORRE DEL RESTO DE EUROPA. PRONÓSTICO, POR REGIONAL, 2019-2032 (MILES DE MILLONES DE USD)
    71. TABLA 68. ESTIMACIONES Y ESTIMACIONES DEL TAMAÑO DEL MERCADO TMA DEL AMPLIFICADOR MONTADO EN TORRE DE APAC. PRONÓSTICO, POR TIPO DE AMPLIFICADOR, 2019-2032 (MILES DE MILLONES DE USD)
    72. TABLA 69. ESTIMACIONES Y ESTIMACIONES DEL TAMAÑO DEL MERCADO TMA DEL AMPLIFICADOR MONTADO EN TORRE DE APAC. PRONÓSTICO, POR APLICACIÓN, 2019-2032 (MILES DE MILLONES DE USD)
    73. TABLA 70. ESTIMACIONES Y ESTIMACIONES DEL TAMAÑO DEL MERCADO TMA DEL AMPLIFICADOR MONTADO EN TORRE DE APAC. PRONÓSTICO, POR RANGO DE FRECUENCIA, 2019-2032 (MILES DE MILLONES DE USD)
    74. TABLA 71. ESTIMACIONES Y ESTIMACIONES DEL TAMAÑO DEL MERCADO TMA DEL AMPLIFICADOR MONTADO EN TORRE DE APAC. PRONÓSTICO, POR POTENCIA DE SALIDA, 2019-2032 (MILES DE MILLONES DE USD)
    75. TABLA 72. ESTIMACIONES Y ESTIMACIONES DEL TAMAÑO DEL MERCADO TMA DEL AMPLIFICADOR MONTADO EN TORRE DE APAC. PRONÓSTICO, POR TIPO DE INSTALACIÓN, 2019-2032 (MILES DE MILLONES DE USD)
    76. TABLA 73. ESTIMACIONES Y ESTIMACIONES DEL TAMAÑO DEL MERCADO TMA DEL AMPLIFICADOR MONTADO EN TORRE DE APAC. PRONÓSTICO, POR REGIONAL, 2019-2032 (MILES DE MILLONES DE USD)
    77. TABLA 74. ESTIMACIONES Y ESTIMACIONES DEL TAMAÑO DEL MERCADO TMA DEL AMPLIFICADOR MONTADO EN TORRE DE CHINA. PRONÓSTICO, POR TIPO DE AMPLIFICADOR, 2019-2032 (MILES DE MILLONES DE USD)
    78. TABLA 75. ESTIMACIONES Y ESTIMACIONES DEL TAMAÑO DEL MERCADO TMA DEL AMPLIFICADOR MONTADO EN TORRE DE CHINA. PRONÓSTICO, POR APLICACIÓN, 2019-2032 (MILES DE MILLONES DE USD)
    79. TABLA 76. ESTIMACIONES Y ESTIMACIONES DEL TAMAÑO DEL MERCADO TMA DEL AMPLIFICADOR MONTADO EN TORRE DE CHINA. PRONÓSTICO, POR RANGO DE FRECUENCIA, 2019-2032 (MILES DE MILLONES DE USD)
    80. TABLA 77. ESTIMACIONES Y ESTIMACIONES DEL TAMAÑO DEL MERCADO TMA DEL AMPLIFICADOR MONTADO EN TORRE DE CHINA. PRONÓSTICO, POR POTENCIA DE SALIDA, 2019-2032 (MILES DE MILLONES DE USD)
    81. TABLA 78. ESTIMACIONES Y ESTIMACIONES DEL TAMAÑO DEL MERCADO TMA DEL AMPLIFICADOR MONTADO EN TORRE DE CHINA. PRONÓSTICO, POR TIPO DE INSTALACIÓN, 2019-2032 (MILES DE MILLONES DE USD)
    82. TABLA 79. ESTIMACIONES Y ESTIMACIONES DEL TAMAÑO DEL MERCADO TMA DEL AMPLIFICADOR MONTADO EN TORRE DE CHINA. PRONÓSTICO, POR REGIONAL, 2019-2032 (MILES DE MILLONES DE USD)
    83. TABLA 80. ESTIMACIONES Y ESTIMACIONES DEL TAMAÑO DEL MERCADO TMA DEL AMPLIFICADOR MONTADO EN TORRE DE LA INDIA. PRONÓSTICO, POR TIPO DE AMPLIFICADOR, 2019-2032 (MILES DE MILLONES DE USD)
    84. TABLA 81. ESTIMACIONES Y ESTIMACIONES DEL TAMAÑO DEL MERCADO TMA DE AMPLIFICADOR MONTADO EN TORRE DE LA INDIA. PRONÓSTICO, POR APLICACIÓN, 2019-2032 (MILES DE MILLONES DE USD)
    85. TABLA 82. ESTIMACIONES Y ESTIMACIONES DEL TAMAÑO DEL MERCADO TMA DEL AMPLIFICADOR MONTADO EN TORRE DE LA INDIA. PRONÓSTICO, POR RANGO DE FRECUENCIA, 2019-2032 (MILES DE MILLONES DE USD)
    86. TABLA 83. ESTIMACIONES Y ESTIMACIONES DEL TAMAÑO DEL MERCADO TMA DEL AMPLIFICADOR MONTADO EN TORRE DE LA INDIA. PRONÓSTICO, POR POTENCIA DE SALIDA, 2019-2032 (MILES DE MILLONES DE USD)
    87. TABLA 84. ESTIMACIONES Y ESTIMACIONES DEL TAMAÑO DEL MERCADO TMA DEL AMPLIFICADOR MONTADO EN TORRE DE LA INDIA. PRONÓSTICO, POR TIPO DE INSTALACIÓN, 2019-2032 (MILES DE MILLONES DE USD)
    88. TABLA 85. ESTIMACIONES Y ESTIMACIONES DEL TAMAÑO DEL MERCADO TMA DEL AMPLIFICADOR MONTADO EN TORRE DE LA INDIA. PRONÓSTICO, POR REGIONAL, 2019-2032 (MILES DE MILLONES DE USD)
    89. TABLA 86. ESTIMACIONES Y ESTIMACIONES DEL TAMAÑO DEL MERCADO TMA DEL AMPLIFICADOR MONTADO EN TORRE DE JAPÓN. PRONÓSTICO, POR TIPO DE AMPLIFICADOR, 2019-2032 (MILES DE MILLONES DE USD)
    90. TABLA 87. ESTIMACIONES Y ESTIMACIONES DEL TAMAÑO DEL MERCADO TMA DE AMPLIFICADOR MONTADO EN TORRE DE JAPÓN PRONÓSTICO, POR APLICACIÓN, 2019-2032 (MILES DE MILLONES DE USD)
    91. TABLA 88. ESTIMACIONES Y ESTIMACIONES DEL TAMAÑO DEL MERCADO TMA DEL AMPLIFICADOR MONTADO EN TORRE DE JAPÓN. PRONÓSTICO, POR RANGO DE FRECUENCIA, 2019-2032 (MILES DE MILLONES DE USD)
    92. TABLA 89. ESTIMACIONES Y ESTIMACIONES DEL TAMAÑO DEL MERCADO TMA DEL AMPLIFICADOR MONTADO EN TORRE DE JAPÓN. PRONÓSTICO, POR POTENCIA DE SALIDA, 2019-2032 (MILES DE MILLONES DE USD)
    93. TABLA 90. ESTIMACIONES Y ESTIMACIONES DEL TAMAÑO DEL MERCADO TMA DEL AMPLIFICADOR MONTADO EN TORRE DE JAPÓN. PRONÓSTICO, POR TIPO DE INSTALACIÓN, 2019-2032 (MILES DE MILLONES DE USD)
    94. TABLA 91. ESTIMACIONES Y ESTIMACIONES DEL TAMAÑO DEL MERCADO TMA DEL AMPLIFICADOR MONTADO EN TORRE DE JAPÓN. PRONÓSTICO, POR REGIONAL, 2019-2032 (MILES DE MILLONES DE USD)
    95. TABLA 92. ESTIMACIONES Y ESTIMACIONES DEL TAMAÑO DEL MERCADO TMA DEL AMPLIFICADOR MONTADO EN TORRE DE COREA DEL SUR. PRONÓSTICO, POR TIPO DE AMPLIFICADOR, 2019-2032 (MILES DE MILLONES DE USD)
    96. TABLA 93. ESTIMACIONES Y ESTIMACIONES DEL TAMAÑO DEL MERCADO TMA DE AMPLIFICADOR MONTADO EN TORRE DE COREA DEL SUR. PRONÓSTICO, POR APLICACIÓN, 2019-2032 (MILES DE MILLONES DE USD)
    97. TABLA 94. ESTIMACIONES Y ESTIMACIONES DEL TAMAÑO DEL MERCADO TMA DEL AMPLIFICADOR MONTADO EN TORRE DE COREA DEL SUR. PRONÓSTICO, POR RANGO DE FRECUENCIA, 2019-2032 (MILES DE MILLONES DE USD)
    98. TABLA 95. ESTIMACIONES Y ESTIMACIONES DEL TAMAÑO DEL MERCADO TMA DE AMPLIFICADOR MONTADO EN TORRE DE COREA DEL SUR. PRONÓSTICO, POR POTENCIA DE SALIDA, 2019-2032 (MILES DE MILLONES DE USD)
    99. TABLA 96. ESTIMACIONES Y ESTIMACIONES DEL TAMAÑO DEL MERCADO TMA DEL AMPLIFICADOR MONTADO EN TORRE DE COREA DEL SUR. PRONÓSTICO, POR TIPO DE INSTALACIÓN, 2019-2032 (MILES DE MILLONES DE USD)
    100. TABLA 97. ESTIMACIONES Y ESTIMACIONES DEL TAMAÑO DEL MERCADO TMA DEL AMPLIFICADOR MONTADO EN TORRE DE COREA DEL SUR. PRONÓSTICO, POR REGIONAL, 2019-2032 (MILES DE MILLONES DE USD)
    101. TABLA 98. ESTIMACIONES Y ESTIMACIONES DEL TAMAÑO DEL MERCADO TMA DEL AMPLIFICADOR MONTADO EN TORRE DE MALASIA. PRONÓSTICO, POR TIPO DE AMPLIFICADOR, 2019-2032 (MILES DE MILLONES DE USD)
    102. TABLA 99. ESTIMACIONES Y ESTIMACIONES DEL TAMAÑO DEL MERCADO TMA DE AMPLIFICADOR MONTADO EN TORRE DE MALASIA. PRONÓSTICO, POR APLICACIÓN, 2019-2032 (MILES DE MILLONES DE USD)
    103. TABLA 100. ESTIMACIONES Y ESTIMACIONES DEL TAMAÑO DEL MERCADO TMA DEL AMPLIFICADOR MONTADO EN TORRE DE MALASIA. PRONÓSTICO, POR RANGO DE FRECUENCIA, 2019-2032 (MILES DE MILLONES DE USD)
    104. TABLA 101. ESTIMACIONES Y ESTIMACIONES DEL TAMAÑO DEL MERCADO TMA DEL AMPLIFICADOR MONTADO EN TORRE DE MALASIA. PRONÓSTICO, POR POTENCIA DE SALIDA, 2019-2032 (MILES DE MILLONES DE USD)
    105. TABLA 102. ESTIMACIONES Y ESTIMACIONES DEL TAMAÑO DEL MERCADO TMA DEL AMPLIFICADOR MONTADO EN TORRE DE MALASIA. PRONÓSTICO, POR TIPO DE INSTALACIÓN, 2019-2032 (MILES DE MILLONES DE USD)
    106. TABLA 103. ESTIMACIONES Y ESTIMACIONES DEL TAMAÑO DEL MERCADO TMA DEL AMPLIFICADOR MONTADO EN TORRE DE MALASIA. PRONÓSTICO, POR REGIONAL, 2019-2032 (MILES DE MILLONES DE USD)
    107. TABLA 104. ESTIMACIONES Y ESTIMACIONES DEL TAMAÑO DEL MERCADO TMA DEL AMPLIFICADOR MONTADO EN TORRE DE TAILANDIA. PRONÓSTICO, POR TIPO DE AMPLIFICADOR, 2019-2032 (MILES DE MILLONES DE USD)
    108. TABLA 105. ESTIMACIONES Y ESTIMACIONES DEL TAMAÑO DEL MERCADO TMA DE AMPLIFICADOR MONTADO EN TORRE DE TAILANDIA. PRONÓSTICO, POR APLICACIÓN, 2019-2032 (MILES DE MILLONES DE USD)
    109. TABLA 106. ESTIMACIONES Y ESTIMACIONES DEL TAMAÑO DEL MERCADO TMA DEL AMPLIFICADOR MONTADO EN TORRE DE TAILANDIA. PRONÓSTICO, POR RANGO DE FRECUENCIA, 2019-2032 (MILES DE MILLONES DE USD)
    110. TABLA 107. ESTIMACIONES Y ESTIMACIONES DEL TAMAÑO DEL MERCADO TMA DEL AMPLIFICADOR MONTADO EN TORRE DE TAILANDIA. PRONÓSTICO, POR POTENCIA DE SALIDA, 2019-2032 (MILES DE MILLONES DE USD)
    111. TABLA 108. ESTIMACIONES Y ESTIMACIONES DEL TAMAÑO DEL MERCADO TMA DEL AMPLIFICADOR MONTADO EN TORRE DE TAILANDIA. PRONÓSTICO, POR TIPO DE INSTALACIÓN, 2019-2032 (MILES DE MILLONES DE USD)
    112. TABLA 109. ESTIMACIONES Y ESTIMACIONES DEL TAMAÑO DEL MERCADO TMA DEL AMPLIFICADOR MONTADO EN TORRE DE TAILANDIA. PRONÓSTICO, POR REGIONAL, 2019-2032 (MILES DE MILLONES DE USD)
    113. TABLA 110. ESTIMACIONES Y ESTIMACIONES DEL TAMAÑO DEL MERCADO TMA DEL AMPLIFICADOR MONTADO EN TORRE DE INDONESIA. PRONÓSTICO, POR TIPO DE AMPLIFICADOR, 2019-2032 (MILES DE MILLONES DE USD)
    114. TABLA 111. ESTIMACIONES Y ESTIMACIONES DEL TAMAÑO DEL MERCADO TMA DE AMPLIFICADOR MONTADO EN TORRE DE INDONESIA. PRONÓSTICO, POR APLICACIÓN, 2019-2032 (MILES DE MILLONES DE USD)
    115. TABLA 112. ESTIMACIONES Y ESTIMACIONES DEL TAMAÑO DEL MERCADO TMA DEL AMPLIFICADOR MONTADO EN TORRE DE INDONESIA. PRONÓSTICO, POR RANGO DE FRECUENCIA, 2019-2032 (MILES DE MILLONES DE USD)
    116. TABLA 113. ESTIMACIONES Y ESTIMACIONES DEL TAMAÑO DEL MERCADO TMA DEL AMPLIFICADOR MONTADO EN TORRE DE INDONESIA. PRONÓSTICO, POR POTENCIA DE SALIDA, 2019-2032 (MILES DE MILLONES DE USD)
    117. TABLA 114. ESTIMACIONES Y ESTIMACIONES DEL TAMAÑO DEL MERCADO TMA DEL AMPLIFICADOR MONTADO EN TORRE DE INDONESIA. PRONÓSTICO, POR TIPO DE INSTALACIÓN, 2019-2032 (MILES DE MILLONES DE USD)
    118. TABLA 115. ESTIMACIONES Y ESTIMACIONES DEL TAMAÑO DEL MERCADO TMA DEL AMPLIFICADOR MONTADO EN TORRE DE INDONESIA. PRONÓSTICO, POR REGIONAL, 2019-2032 (MILES DE MILLONES DE USD)
    119. TABLA 116. ESTIMACIONES Y ESTIMACIONES DEL TAMAÑO DEL MERCADO TMA DEL RESTO DE AMPLIFICADORES MONTADOS EN TORRE DE APAC PRONÓSTICO, POR TIPO DE AMPLIFICADOR, 2019-2032 (MILES DE MILLONES DE USD)
    120. TABLA 117. ESTIMACIONES Y ESTIMACIONES DEL TAMAÑO DEL MERCADO TMA DE AMPLIFICADOR MONTADO EN TORRE DEL RESTO DE APAC Y AMPLIACIÓN. PRONÓSTICO, POR APLICACIÓN, 2019-2032 (MILES DE MILLONES DE USD)
    121. TABLA 118. ESTIMACIONES Y ESTIMACIONES DEL TAMAÑO DEL MERCADO TMA DEL RESTO DE AMPLIFICADORES MONTADOS EN TORRE DE APAC. PRONÓSTICO, POR RANGO DE FRECUENCIA, 2019-2032 (MILES DE MILLONES DE USD)
    122. TABLA 119. ESTIMACIONES Y ESTIMACIONES DEL TAMAÑO DEL MERCADO TMA DE AMPLIFICADORES MONTADOS EN TORRE DEL RESTO DE APAC. PRONÓSTICO, POR POTENCIA DE SALIDA, 2019-2032 (MILES DE MILLONES DE USD)
    123. TABLA 120. ESTIMACIONES Y ESTIMACIONES DEL TAMAÑO DEL MERCADO TMA DEL RESTO DE AMPLIFICADORES MONTADOS EN TORRE DE APAC PRONÓSTICO, POR TIPO DE INSTALACIÓN, 2019-2032 (MILES DE MILLONES DE USD)
    124. TABLA 121. ESTIMACIONES Y ESTIMACIONES DEL TAMAÑO DEL MERCADO TMA DEL RESTO DE AMPLIFICADORES MONTADOS EN TORRE DE APAC. PRONÓSTICO, POR REGIONAL, 2019-2032 (MILES DE MILLONES DE USD)
    125. TABLA 122. ESTIMACIONES Y ESTIMACIONES DEL TAMAÑO DEL MERCADO TMA DE AMPLIFICADOR MONTADO EN TORRE DE AMÉRICA DEL SUR. PRONÓSTICO, POR TIPO DE AMPLIFICADOR, 2019-2032 (MILES DE MILLONES DE USD)
    126. TABLA 123. ESTIMACIONES Y ESTIMACIONES DEL TAMAÑO DEL MERCADO TMA DE AMPLIFICADOR MONTADO EN TORRE DE AMÉRICA DEL SUR. PRONÓSTICO, POR APLICACIÓN, 2019-2032 (MILES DE MILLONES DE USD)
    127. TABLA 124. ESTIMACIONES Y ESTIMACIONES DEL TAMAÑO DEL MERCADO TMA DE AMPLIFICADOR MONTADO EN TORRE DE AMÉRICA DEL SUR. PRONÓSTICO, POR RANGO DE FRECUENCIA, 2019-2032 (MILES DE MILLONES DE USD)
    128. TABLA 125. ESTIMACIONES Y ESTIMACIONES DEL TAMAÑO DEL MERCADO TMA DE AMPLIFICADORES MONTADOS EN TORRE DE AMÉRICA DEL SUR. PRONÓSTICO, POR POTENCIA DE SALIDA, 2019-2032 (MILES DE MILLONES DE USD)
    129. TABLA 126. ESTIMACIONES Y ESTIMACIONES DEL TAMAÑO DEL MERCADO TMA DE AMPLIFICADOR MONTADO EN TORRE DE AMÉRICA DEL SUR. PRONÓSTICO, POR TIPO DE INSTALACIÓN, 2019-2032 (MILES DE MILLONES DE USD)
    130. TABLA 127. ESTIMACIONES Y ESTIMACIONES DEL TAMAÑO DEL MERCADO TMA DE AMPLIFICADOR MONTADO EN TORRE DE AMÉRICA DEL SUR. PRONÓSTICO, POR REGIONAL, 2019-2032 (MILES DE MILLONES DE USD)
    131. TABLA 128. ESTIMACIONES Y ESTIMACIONES DEL TAMAÑO DEL MERCADO TMA DEL AMPLIFICADOR MONTADO EN TORRE DE BRASIL. PRONÓSTICO, POR TIPO DE AMPLIFICADOR, 2019-2032 (MILES DE MILLONES DE USD)
    132. TABLA 129. ESTIMACIONES Y ESTIMACIONES DEL TAMAÑO DEL MERCADO TMA DE AMPLIFICADOR MONTADO EN TORRE DE BRASIL. PRONÓSTICO, POR APLICACIÓN, 2019-2032 (MILES DE MILLONES DE USD)
    133. TABLA 130. ESTIMACIONES Y ESTIMACIONES DEL TAMAÑO DEL MERCADO TMA DEL AMPLIFICADOR MONTADO EN TORRE DE BRASIL. PRONÓSTICO, POR RANGO DE FRECUENCIA, 2019-2032 (MILES DE MILLONES DE USD)
    134. TABLA 131. ESTIMACIONES Y ESTIMACIONES DEL TAMAÑO DEL MERCADO TMA DE AMPLIFICADOR MONTADO EN TORRE DE BRASIL. PRONÓSTICO, POR POTENCIA DE SALIDA, 2019-2032 (MILES DE MILLONES DE USD)
    135. TABLA 132. ESTIMACIONES Y ESTIMACIONES DEL TAMAÑO DEL MERCADO TMA DEL AMPLIFICADOR MONTADO EN TORRE DE BRASIL. PRONÓSTICO, POR TIPO DE INSTALACIÓN, 2019-2032 (MILES DE MILLONES DE USD)
    136. TABLA 133. ESTIMACIONES Y ESTIMACIONES DEL TAMAÑO DEL MERCADO TMA DEL AMPLIFICADOR MONTADO EN TORRE DE BRASIL. PRONÓSTICO, POR REGIONAL, 2019-2032 (MILES DE MILLONES DE USD)
    137. TABLA 134. MÉXICO TORRE MONTADA AESTIMACIONES Y ESTIMACIONES DEL TAMAÑO DEL MERCADO DE MPLIFIER TMA PRONÓSTICO, POR TIPO DE AMPLIFICADOR, 2019-2032 (MILES DE MILLONES DE USD)
    138. TABLA 135. ESTIMACIONES Y ESTIMACIONES DEL TAMAÑO DEL MERCADO TMA DE AMPLIFICADOR MONTADO EN TORRE EN MÉXICO. PRONÓSTICO, POR APLICACIÓN, 2019-2032 (MILES DE MILLONES DE USD)
    139. TABLA 136. ESTIMACIONES Y ESTIMACIONES DEL TAMAÑO DEL MERCADO TMA DEL AMPLIFICADOR MONTADO EN TORRE EN MÉXICO. PRONÓSTICO, POR RANGO DE FRECUENCIA, 2019-2032 (MILES DE MILLONES DE USD)
    140. TABLA 137. ESTIMACIONES Y ESTIMACIONES DEL TAMAÑO DEL MERCADO TMA DE AMPLIFICADORES MONTADOS EN TORRE EN MÉXICO. PRONÓSTICO, POR POTENCIA DE SALIDA, 2019-2032 (MILES DE MILLONES DE USD)
    141. TABLA 138. ESTIMACIONES Y ESTIMACIONES DEL TAMAÑO DEL MERCADO TMA DEL AMPLIFICADOR MONTADO EN TORRE EN MÉXICO. PRONÓSTICO, POR TIPO DE INSTALACIÓN, 2019-2032 (MILES DE MILLONES DE USD)
    142. TABLA 139. ESTIMACIONES DEL TAMAÑO DEL MERCADO TMA DE AMPLIFICADOR MONTADO EN TORRE EN MÉXICO Y PRONÓSTICOS. PRONÓSTICO, POR REGIONAL, 2019-2032 (MILES DE MILLONES DE USD)
    143. TABLA 140. ESTIMACIONES Y ESTIMACIONES DEL TAMAÑO DEL MERCADO TMA DE AMPLIFICADOR MONTADO EN TORRE DE ARGENTINA. PRONÓSTICO, POR TIPO DE AMPLIFICADOR, 2019-2032 (MILES DE MILLONES DE USD)
    144. TABLA 141. ESTIMACIONES Y ESTIMACIONES DEL TAMAÑO DEL MERCADO TMA DE AMPLIFICADOR MONTADO EN TORRE DE ARGENTINA. PRONÓSTICO, POR APLICACIÓN, 2019-2032 (MILES DE MILLONES DE USD)
    145. TABLA 142. ESTIMACIONES Y ESTIMACIONES DEL TAMAÑO DEL MERCADO TMA DE AMPLIFICADOR MONTADO EN TORRE DE ARGENTINA. PRONÓSTICO, POR RANGO DE FRECUENCIA, 2019-2032 (MILES DE MILLONES DE USD)
    146. TABLA 143. ESTIMACIONES Y ESTIMACIONES DEL TAMAÑO DEL MERCADO TMA DE AMPLIFICADOR MONTADO EN TORRE DE ARGENTINA. PRONÓSTICO, POR POTENCIA DE SALIDA, 2019-2032 (MILES DE MILLONES DE USD)
    147. TABLA 144. ESTIMACIONES Y ESTIMACIONES DEL TAMAÑO DEL MERCADO TMA DEL AMPLIFICADOR MONTADO EN TORRE DE ARGENTINA. PRONÓSTICO, POR TIPO DE INSTALACIÓN, 2019-2032 (MILES DE MILLONES DE USD)
    148. TABLA 145. ESTIMACIONES Y ESTIMACIONES DEL TAMAÑO DEL MERCADO TMA DE AMPLIFICADOR MONTADO EN TORRE DE ARGENTINA. PRONÓSTICO, POR REGIONAL, 2019-2032 (MILES DE MILLONES DE USD)
    149. TABLA 146. ESTIMACIONES Y ESTIMACIONES DEL TAMAÑO DEL MERCADO TMA DE AMPLIFICADOR MONTADO EN TORRE DEL RESTO DE SUDAMÉRICA. PRONÓSTICO, POR TIPO DE AMPLIFICADOR, 2019-2032 (MILES DE MILLONES DE USD)
    150. TABLA 147. ESTIMACIONES Y ESTIMACIONES DEL TAMAÑO DEL MERCADO TMA DE AMPLIFICADOR MONTADO EN TORRE DEL RESTO DE SUDAMÉRICA. PRONÓSTICO, POR APLICACIÓN, 2019-2032 (MILES DE MILLONES DE USD)
    151. TABLA 148. ESTIMACIONES DEL TAMAÑO DEL MERCADO TMA DE AMPLIFICADOR MONTADO EN TORRE DEL RESTO DE SUDAMÉRICA Y PREVISIÓN DE US$ PRONÓSTICO, POR RANGO DE FRECUENCIA, 2019-2032 (MILES DE MILLONES DE USD)
    152. TABLA 149. ESTIMACIONES Y ESTIMACIONES DEL TAMAÑO DEL MERCADO TMA DE AMPLIFICADORES MONTADOS EN TORRE DEL RESTO DE SUDAMÉRICA. PRONÓSTICO, POR POTENCIA DE SALIDA, 2019-2032 (MILES DE MILLONES DE USD)
    153. TABLA 150. ESTIMACIONES Y ESTIMACIONES DEL TAMAÑO DEL MERCADO TMA DE AMPLIFICADORES MONTADOS EN TORRE DEL RESTO DE SUDAMÉRICA. PRONÓSTICO, POR TIPO DE INSTALACIÓN, 2019-2032 (MILES DE MILLONES DE USD)
    154. TABLA 151. ESTIMACIONES Y ESTIMACIONES DEL TAMAÑO DEL MERCADO TMA DE AMPLIFICADOR MONTADO EN TORRE DEL RESTO DE SUDAMÉRICA. PRONÓSTICO, POR REGIONAL, 2019-2032 (MILES DE MILLONES DE USD)
    155. TABLA 152. ESTIMACIONES DEL TAMAÑO DEL MERCADO TMA DEL AMPLIFICADOR MONTADO EN TORRE DE MEA Y ESTIMACIONES Y PRONÓSTICOS DEL MERCADO. PRONÓSTICO, POR TIPO DE AMPLIFICADOR, 2019-2032 (MILES DE MILLONES DE USD)
    156. TABLA 153. ESTIMACIONES Y ESTIMACIONES DEL TAMAÑO DEL MERCADO DEL AMPLIFICADOR MONTADO EN TORRE MEA TMA. PRONÓSTICO, POR APLICACIÓN, 2019-2032 (MILES DE MILLONES DE USD)
    157. TABLA 154. ESTIMACIONES DEL TAMAÑO DEL MERCADO TMA DEL AMPLIFICADOR MONTADO EN TORRE DE MEA Y PREVISIÓN DE PRONÓSTICO, POR APLICACIÓN, 2019-2032 (MILES DE MILLONES DE USD) PRONÓSTICO, POR RANGO DE FRECUENCIA, 2019-2032 (MILES DE MILLONES DE USD)
    158. TABLA 155. ESTIMACIONES Y ESTIMACIONES DEL TAMAÑO DEL MERCADO DEL AMPLIFICADOR MONTADO EN TORRE MEA TMA. PRONÓSTICO, POR POTENCIA DE SALIDA, 2019-2032 (MILES DE MILLONES DE USD)
    159. TABLA 156. ESTIMACIONES Y ESTIMACIONES DEL TAMAÑO DEL MERCADO DEL AMPLIFICADOR MONTADO EN TORRE MEA TMA. PRONÓSTICO, POR TIPO DE INSTALACIÓN, 2019-2032 (MILES DE MILLONES DE USD)
    160. TABLA 157. ESTIMACIONES Y ESTIMACIONES DEL TAMAÑO DEL MERCADO DEL AMPLIFICADOR MONTADO EN TORRE MEA TMA. PRONÓSTICO, POR REGIONAL, 2019-2032 (MILES DE MILLONES DE USD)
    161. TABLA 158. ESTIMACIONES Y ESTIMACIONES DEL TAMAÑO DEL MERCADO TMA DE AMPLIFICADOR MONTADO EN TORRE DE LOS PAÍSES DEL CCG. PRONÓSTICO, POR TIPO DE AMPLIFICADOR, 2019-2032 (MILES DE MILLONES DE USD)
    162. TABLA 159. ESTIMACIONES Y ESTIMACIONES DEL TAMAÑO DEL MERCADO TMA DE AMPLIFICADOR MONTADO EN TORRE DE LOS PAÍSES DEL CCG. PRONÓSTICO, POR APLICACIÓN, 2019-2032 (MILES DE MILLONES DE USD)
    163. TABLA 160. ESTIMACIONES Y ESTIMACIONES DEL TAMAÑO DEL MERCADO TMA DE AMPLIFICADOR MONTADO EN TORRE DE LOS PAÍSES DEL CCG. PRONÓSTICO, POR RANGO DE FRECUENCIA, 2019-2032 (MILES DE MILLONES DE USD)
    164. TABLA 161. ESTIMACIONES Y ESTIMACIONES DEL TAMAÑO DEL MERCADO TMA DE AMPLIFICADORES MONTADOS EN TORRE DE LOS PAÍSES DEL CCG. PRONÓSTICO, POR POTENCIA DE SALIDA, 2019-2032 (MILES DE MILLONES DE USD)
    165. TABLA 162. ESTIMACIONES Y ESTIMACIONES DEL TAMAÑO DEL MERCADO TMA DE AMPLIFICADORES MONTADOS EN TORRE DE LOS PAÍSES DEL CCG. PRONÓSTICO, POR TIPO DE INSTALACIÓN, 2019-2032 (MILES DE MILLONES DE USD)
    166. TABLA 163. ESTIMACIONES Y ESTIMACIONES DEL TAMAÑO DEL MERCADO TMA DE AMPLIFICADOR MONTADO EN TORRE DE LOS PAÍSES DEL CCG. PRONÓSTICO, POR REGIONAL, 2019-2032 (MILES DE MILLONES DE USD)
    167. TABLA 164. ESTIMACIONES Y ESTIMACIONES DEL TAMAÑO DEL MERCADO TMA DEL AMPLIFICADOR MONTADO EN TORRE DE SUDÁFRICA. PRONÓSTICO, POR TIPO DE AMPLIFICADOR, 2019-2032 (MILES DE MILLONES DE USD)
    168. TABLA 165. ESTIMACIONES Y ESTIMACIONES DEL TAMAÑO DEL MERCADO TMA DE AMPLIFICADOR MONTADO EN TORRE DE SUDÁFRICA. PRONÓSTICO, POR APLICACIÓN, 2019-2032 (MILES DE MILLONES DE USD)
    169. TABLA 166. ESTIMACIONES Y ESTIMACIONES DEL TAMAÑO DEL MERCADO TMA DEL AMPLIFICADOR MONTADO EN TORRE DE SUDÁFRICA. PRONÓSTICO, POR RANGO DE FRECUENCIA, 2019-2032 (MILES DE MILLONES DE USD)
    170. TABLA 167. ESTIMACIONES Y ESTIMACIONES DEL TAMAÑO DEL MERCADO TMA DEL AMPLIFICADOR MONTADO EN TORRE DE SUDÁFRICA. PRONÓSTICO, POR POTENCIA DE SALIDA, 2019-2032 (MILES DE MILLONES DE USD)
    171. TABLA 168. ESTIMACIONES Y ESTIMACIONES DEL TAMAÑO DEL MERCADO TMA DEL AMPLIFICADOR MONTADO EN TORRE DE SUDÁFRICA. PRONÓSTICO, POR TIPO DE INSTALACIÓN, 2019-2032 (MILES DE MILLONES DE USD)
    172. TABLA 169. ESTIMACIONES Y ESTIMACIONES DEL TAMAÑO DEL MERCADO TMA DEL AMPLIFICADOR MONTADO EN TORRE DE SUDÁFRICA. PRONÓSTICO, POR REGIONAL, 2019-2032 (MILES DE MILLONES DE USD)
    173. TABLA 170. ESTIMACIONES DEL TAMAÑO DEL MERCADO TMA DEL AMPLIFICADOR MONTADO EN TORRE DEL RESTO DE MEA Y ESTIMACIONES DE TAMAÑO DEL MERCADO TMA. PRONÓSTICO, POR TIPO DE AMPLIFICADOR, 2019-2032 (MILES DE MILLONES DE USD)
    174. TABLA 171. ESTIMACIONES Y ESTIMACIONES DEL TAMAÑO DEL MERCADO DEL RESTO DE AMPLIFICADORES MONTADOS EN TORRE TMA DE MEA. PRONÓSTICO, POR APLICACIÓN, 2019-2032 (MILES DE MILLONES DE USD)
    175. TABLA 172. ESTIMACIONES DEL TAMAÑO DEL MERCADO TMA DEL AMPLIFICADOR MONTADO EN TORRE DEL RESTO DE MEA Y ESTIMACIONES Y PREVISIÓN. PRONÓSTICO, POR RANGO DE FRECUENCIA, 2019-2032 (MILES DE MILLONES DE USD)
    176. TABLA 173. ESTIMACIONES DEL TAMAÑO DEL MERCADO TMA DEL AMPLIFICADOR MONTADO EN TORRE DEL RESTO DE MEA Y ESTIMACIONES Y PREVISIÓN. PRONÓSTICO, POR POTENCIA DE SALIDA, 2019-2032 (MILES DE MILLONES DE USD)
    177. TABLA 174. ESTIMACIONES DEL TAMAÑO DEL MERCADO TMA DEL AMPLIFICADOR MONTADO EN TORRE DEL RESTO DE MEA Y ESTIMACIONES Y PREVISIÓN. PRONÓSTICO, POR TIPO DE INSTALACIÓN, 2019-2032 (MILES DE MILLONES DE USD)
    178. TABLA 175. ESTIMACIONES DEL TAMAÑO DEL MERCADO TMA DEL AMPLIFICADOR MONTADO EN TORRE DEL RESTO DE MEA Y PREVISIÓN. PRONÓSTICO, POR REGIONAL, 2019-2032 (MILES DE MILLONES DE USD)
    179. TABLA 176. LANZAMIENTO/DESARROLLO/APROBACIÓN DE PRODUCTOS
    180. TABLA 177. ADQUISICIÓN/ASOCIACIÓN
    181. LISTA DE CIFRAS
    182. FIGURA 1. SINOPSIS DEL MERCADO
    183. FIGURA 2. ANÁLISIS DEL MERCADO TMA DE AMPLIFICADORES MONTADOS EN TORRE DE AMÉRICA DEL NORTE
    184. FIGURA 3. ANÁLISIS DEL MERCADO TMA DE AMPLIFICADORES MONTADOS EN TORRE DE EE. UU. POR TIPO DE AMPLIFICADOR
    185. FIGURA 4. ANÁLISIS DEL MERCADO TMA DE AMPLIFICADORES MONTADOS EN TORRE DE EE. UU. POR APLICACIÓN
    186. FIGURA 5. AMPLIFICADOR MONTADO EN TORRE DE EE. UU. ANÁLISIS DEL MERCADO TMA POR RANGO DE FRECUENCIA
    187. FIGURA 6. AMPLIFICADOR MONTADO EN TORRE DE EE. UU. ANÁLISIS DEL MERCADO TMA POR POTENCIA DE SALIDA
    188. FIGURA 7. ANÁLISIS DEL MERCADO TMA AMPLIFICADOR MONTADO EN TORRE DE EE. UU. POR TIPO DE INSTALACIÓN
    189. FIGURA 8. MONTADO EN TORRE DE EE. UU. MERCADO DE AMPLIFICADORES TMA ANÁLISIS POR REGIONAL
    190. FIGURA 9. ANÁLISIS DEL MERCADO TMA DE AMPLIFICADORES MONTADOS EN TORRE DE CANADÁ POR TIPO DE AMPLIFICADOR
    191. FIGURA 10. ANÁLISIS DEL MERCADO TMA DE AMPLIFICADORES MONTADOS EN TORRE DE CANADÁ POR APLICACIÓN
    192. FIGURA 11. ANÁLISIS DEL MERCADO TMA DE AMPLIFICADORES MONTADOS EN TORRE DE CANADÁ POR FRECUENCIA GAMA
    193. FIGURA 12. ANÁLISIS DEL MERCADO TMA DE AMPLIFICADORES MONTADOS EN TORRE DE CANADÁ POR POTENCIA DE SALIDA
    194. FIGURA 13. ANÁLISIS DEL MERCADO TMA DE AMPLIFICADORES MONTADOS EN TORRE DE CANADÁ POR TIPO DE INSTALACIÓN
    195. FIGURA 14. ANÁLISIS DEL MERCADO TMA DE AMPLIFICADORES MONTADOS EN TORRE DE CANADÁ POR REGIONALES
    196. />FIGURA 15. ANÁLISIS DEL MERCADO TMA DE AMPLIFICADORES MONTADOS EN TORRE EN EUROPA
    197. FIGURA 16. ANÁLISIS DEL MERCADO TMA DE AMPLIFICADORES MONTADOS EN TORRE EN ALEMANIA POR TIPO DE AMPLIFICADOR
    198. FIGURA 17. ANÁLISIS DEL MERCADO TMA DE AMPLIFICADORES MONTADOS EN TORRE EN ALEMANIA POR APLICACIÓN
    199. FIGURA 18. ANÁLISIS DEL MERCADO DE AMPLIFICADORES TMA DE TORRE DE ALEMANIA POR RANGO DE FRECUENCIA
    200. FIGURA 19. ANÁLISIS DEL MERCADO DE TMA DE AMPLIFICADORES DE TORRE DE ALEMANIA POR POTENCIA DE SALIDA
    201. FIGURA 20. ANÁLISIS DEL MERCADO DE TMA DE AMPLIFICADORES DE TORRE DE ALEMANIA POR TIPO DE INSTALACIÓN
    202. FIGURA 21. ANÁLISIS DEL MERCADO TMA DE AMPLIFICADORES MONTADOS EN TORRE EN ALEMANIA POR REGIONAL
    203. FIGURA 22. ANÁLISIS DEL MERCADO TMA DE AMPLIFICADORES MONTADOS EN TORRE DEL REINO UNIDO POR TIPO DE AMPLIFICADOR
    204. FIGURA 23. ANÁLISIS DEL MERCADO TMA DE AMPLIFICADORES MONTADOS EN TORRE DEL REINO UNIDO POR APLICACIÓN
    205. FIGURA 24 REINO UNIDO MONTADO EN TORRE. ANÁLISIS DEL MERCADO DEL AMPLIFICADOR TMA POR RANGO DE FRECUENCIA
    206. FIGURA 25. ANÁLISIS DEL MERCADO DEL AMPLIFICADOR TMA MONTADO EN TORRE POR POTENCIA DE SALIDA
    207. FIGURA 26. ANÁLISIS DEL MERCADO DEL AMPLIFICADOR TMA MONTADO EN TORRE DEL REINO UNIDO POR TIPO DE INSTALACIÓN
    208. FIGURA 27. TORRE DEL REINO UNIDO AMPLIFICADOR MONTADO ANÁLISIS DEL MERCADO TMA POR REGIONAL
    209. FIGURA 28. FRANCIA AMPLIFICADOR MONTADO EN TORRE ANÁLISIS DEL MERCADO TMA POR TIPO DE AMPLIFICADOR
    210. FIGURA 29. FRANCIA AMPLIFICADOR MONTADO EN TORRE ANÁLISIS DEL MERCADO TMA POR APLICACIÓN
    211. FIGURA 30. FRANCIA AMPLIFICADOR MONTADO EN TORRE TMA ANÁLISIS DE MERCADO POR RANGO DE FRECUENCIA
    212. FIGURA 31. ANÁLISIS DEL MERCADO DE AMPLIFICADORES TMA DE TORRE DE FRANCIA POR POTENCIA DE SALIDA
    213. FIGURA 32. ANÁLISIS DEL MERCADO DE AMPLIFICADORES TMA DE TORRE DE FRANCIA POR TIPO DE INSTALACIÓN
    214. FIGURA 33. MERCADO DE TMA DE AMPLIFICADORES DE TORRE DE FRANCIA ANÁLISIS POR REGIONAL
    215. FIGURA 34. ANÁLISIS DEL MERCADO TMA DE AMPLIFICADORES MONTADOS EN TORRE DE RUSIA POR TIPO DE AMPLIFICADOR
    216. FIGURA 35. ANÁLISIS DEL MERCADO TMA DE AMPLIFICADORES MONTADOS EN TORRE DE RUSIA POR APLICACIÓN
    217. FIGURA 36. ANÁLISIS DEL MERCADO TMA DE AMPLIFICADORES MONTADOS EN TORRE DE RUSIA POR RANGO DE FRECUENCIA
    218. FIGURA 37. ANÁLISIS DEL MERCADO TMA DE AMPLIFICADORES MONTADOS EN TORRE DE RUSIA POR POTENCIA DE SALIDA
    219. FIGURA 38. ANÁLISIS DEL MERCADO TMA DE AMPLIFICADORES MONTADOS EN TORRE DE RUSIA POR TIPO DE INSTALACIÓN
    220. FIGURA 39. MERCADO TMA DE AMPLIFICADORES MONTADOS EN TORRE DE RUSIA ANÁLISIS POR REGIONAL
    221. FIGURA 40. ITALIA AMPLIFICADOR MONTADO EN TORRE TMA ANÁLISIS POR TIPO DE AMPLIFICADOR
    222. FIGURA 41. ITALIA AMPLIFICADOR MONTADO EN TORRE TMA ANÁLISIS POR APLICACIÓN
    223. FIGURA 42. ITALIA AMPLIFICADOR MONTADO EN TORRE TMA ANÁLISIS POR RANGO DE FRECUENCIA
    224. FIGURA 43. ANÁLISIS DEL MERCADO TMA DE AMPLIFICADORES MONTADOS EN TORRE DE ITALIA POR POTENCIA DE SALIDA
    225. FIGURA 44. ANÁLISIS DEL MERCADO TMA DE AMPLIFICADORES MONTADOS EN TORRE DE ITALIA POR TIPO DE INSTALACIÓN
    226. FIGURA 45. ANÁLISIS DEL MERCADO TMA DE AMPLIFICADORES MONTADOS EN TORRE DE ITALIA POR REGIONAL
    227. FIGURA 46. ANÁLISIS DEL MERCADO DE AMPLIFICADORES TMA DE TORRE EN ESPAÑA POR TIPO DE AMPLIFICADOR
    228. FIGURA 47. ANÁLISIS DEL MERCADO DE TMA DE AMPLIFICADORES DE TORRE EN ESPAÑA POR APLICACIÓN
    229. FIGURA 48. ANÁLISIS DEL MERCADO DE TMA DE AMPLIFICADORES DE TORRE EN ESPAÑA POR APLICACIÓN RANGO DE FRECUENCIA
    230. FIGURA 49. ANÁLISIS DEL MERCADO DE AMPLIFICADOR DE TORRE TMA EN ESPAÑA POR POTENCIA DE SALIDA
    231. FIGURA 50. ANÁLISIS DEL MERCADO DE AMPLIFICADOR DE TORRE TMA EN ESPAÑA POR TIPO DE INSTALACIÓN
    232. FIGURA 51. ANÁLISIS DEL MERCADO DE AMPLIFICADOR DE TORRE TMA EN ESPAÑA POR TIPOS REGIONALES
    233. FIGURA 52. RESTO DE EUROPA ANÁLISIS DEL MERCADO TMA DE AMPLIFICADORES MONTADOS EN TORRE POR TIPO DE AMPLIFICADOR
    234. FIGURA 53. ANÁLISIS DEL MERCADO TMA DE AMPLIFICADORES MONTADOS EN TORRE RESTO DE EUROPA POR APLICACIÓN
    235. FIGURA 54. ANÁLISIS DEL MERCADO TMA DE AMPLIFICADORES MONTADOS EN TORRE RESTO DE EUROPA POR FRECUENCIA GAMA
    236. />FIGURA 55. ANÁLISIS DEL MERCADO DE AMPLIFICADORES TMA DE TORRE DEL RESTO DE EUROPA POR POTENCIA DE SALIDA
    237. FIGURA 56. ANÁLISIS DEL MERCADO DE AMPLIFICADORES DE TORRE TMA DEL RESTO DE EUROPA POR TIPO DE INSTALACIÓN
    238. FIGURA 57. AMPLIFICADOR DE TORRE TMA DEL RESTO DE EUROPA ANÁLISIS DE MERCADO POR REGIONALES
    239. FIGURA 58. ANÁLISIS DEL MERCADO TMA DE AMPLIFICADORES MONTADOS EN TORRE DE APAC
    240. FIGURA 59. ANÁLISIS DEL MERCADO TMA DE AMPLIFICADORES MONTADOS EN TORRE DE CHINA POR TIPO DE AMPLIFICADOR
    241. FIGURA 60. ANÁLISIS DEL MERCADO TMA DE AMPLIFICADORES MONTADOS EN TORRE DE CHINA POR APLICACIÓN
    242. GRÁFICO 61. CHINA ANÁLISIS DEL MERCADO TMA DEL AMPLIFICADOR MONTADO EN TORRE POR RANGO DE FRECUENCIA
    243. FIGURA 62. ANÁLISIS DEL MERCADO TMA DEL AMPLIFICADOR MONTADO EN TORRE DE CHINA POR POTENCIA DE SALIDA
    244. FIGURA 63. ANÁLISIS DEL MERCADO TMA DEL AMPLIFICADOR MONTADO EN TORRE DE CHINA POR TIPO DE INSTALACIÓN
    245. FIGURA 64. TORRE CHINA ANÁLISIS DEL MERCADO DE TMA DE AMPLIFICADOR MONTADO EN TORRE POR REGIONAL
    246. FIGURA 65. ANÁLISIS DEL MERCADO DE TMA DE AMPLIFICADOR MONTADO EN TORRE DE INDIA POR TIPO DE AMPLIFICADOR
    247. FIGURA 66. ANÁLISIS DEL MERCADO DE TMA DE AMPLIFICADOR MONTADO EN TORRE DE INDIA POR APLICACIÓN
    248. FIGURA 67. MONTADO EN TORRE DE INDIA AMPLIFICADOR TMA ANÁLISIS DE MERCADO POR RANGO DE FRECUENCIA
    249. FIGURA 68. INDIA AMPLIFICADOR MONTADO EN TORRE TMA ANÁLISIS DE MERCADO POR POTENCIA DE SALIDA
    250. FIGURA 69. INDIA AMPLIFICADOR MONTADO EN TORRE TMA ANÁLISIS DEL MERCADO POR TIPO DE INSTALACIÓN
    251. FIGURA 70. INDIA AMPLIFICADOR MONTADO EN TORRE TMA ANÁLISIS DE MERCADO POR REGIONAL
    252. FIGURA 71. AMPLIFICADOR TMA MONTADO EN TORRE DE JAPÓN ANÁLISIS DEL MERCADO POR TIPO DE AMPLIFICADOR
    253. FIGURA 72. ANÁLISIS DEL MERCADO TMA DE AMPLIFICADOR MONTADO EN TORRE JAPÓN POR APLICACIÓN
    254. FIGURA 73. MERCADO TMA DE AMPLIFICADOR MONTADO EN TORRE JAPÓN ANÁLISIS POR RANGO DE FRECUENCIA
    255. FIGURA 74. AMPLIFICADOR MONTADO EN TORRE DE JAPÓNANÁLISIS DEL MERCADO ER TMA POR POTENCIA DE SALIDA
    256. FIGURA 75. ANÁLISIS DEL MERCADO TMA AMPLIFICADOR MONTADO EN TORRE DE JAPÓN POR TIPO DE INSTALACIÓN
    257. FIGURA 76. ANÁLISIS DEL MERCADO TMA AMPLIFICADOR MONTADO EN TORRE DE JAPÓN POR REGIONAL
    258. FIGURA 77. TORRE DE COREA DEL SUR AMPLIFICADOR MONTADO ANÁLISIS DEL MERCADO DE TMA POR TIPO DE AMPLIFICADOR
    259. FIGURA 78. COREA DEL SUR ANÁLISIS DEL MERCADO DE TMA DE AMPLIFICADOR MONTADO EN TORRE POR APLICACIÓN
    260. FIGURA 79. COREA DEL SUR ANÁLISIS DEL MERCADO DE TMA DE AMPLIFICADOR MONTADO EN TORRE POR RANGO DE FRECUENCIA
    261. FIGURA 80. COREA DEL SUR TORRE ANÁLISIS DE MERCADO DE AMPLIFICADOR MONTADO EN TORRE TMA POR POTENCIA DE SALIDA
    262. FIGURA 81. ANÁLISIS DE MERCADO DE AMPLIFICADOR MONTADO EN TORRE DE COREA DEL SUR POR TIPO DE INSTALACIÓN
    263. FIGURA 82. ANÁLISIS DEL MERCADO DE AMPLIFICADOR MONTADO EN TORRE DE COREA DEL SUR POR REGIONAL
    264. FIGURA 83. MALASIA ANÁLISIS DEL MERCADO DE AMPLIFICADOR TMA MONTADO EN TORRE POR TIPO DE AMPLIFICADOR
    265. FIGURA 84. ANÁLISIS DEL MERCADO DE TMA AMPLIFICADOR MONTADO EN TORRE DE MALASIA POR APLICACIÓN
    266. FIGURA 85. ANÁLISIS DEL MERCADO DE TMA AMPLIFICADOR MONTADO EN TORRE DE MALASIA POR RANGO DE FRECUENCIA
    267. FIGURA 86. ANÁLISIS DEL MERCADO TMA DE AMPLIFICADOR MONTADO EN TORRE DE MALASIA POR POTENCIA DE SALIDA
    268. FIGURA 87. ANÁLISIS DEL MERCADO TMA DE AMPLIFICADOR MONTADO EN TORRE DE MALASIA POR TIPO DE INSTALACIÓN
    269. FIGURA 88. ANÁLISIS DEL MERCADO TMA DE AMPLIFICADOR MONTADO EN TORRE DE MALASIA POR REGIONAL
    270. FIGURA 89. ANÁLISIS DEL MERCADO TMA DE AMPLIFICADOR MONTADO EN TORRE DE TAILANDIA POR TIPO DE AMPLIFICADOR
    271. FIGURA 90. ANÁLISIS DEL MERCADO TMA DE AMPLIFICADOR MONTADO EN TORRE DE TAILANDIA POR APLICACIÓN
    272. FIGURA 91. ANÁLISIS DEL MERCADO TMA DE AMPLIFICADOR MONTADO EN TORRE DE TAILANDIA POR RANGO DE FRECUENCIA
    273. FIGURA 92. ANÁLISIS DEL MERCADO TMA DE AMPLIFICADOR MONTADO EN TORRE DE TAILANDIA POR POTENCIA DE SALIDA
    274. FIGURA 93. ANÁLISIS DEL MERCADO TMA DE AMPLIFICADOR MONTADO EN TORRE DE TAILANDIA POR TIPO DE INSTALACIÓN
    275. FIGURA 94. ANÁLISIS DEL MERCADO TMA DE AMPLIFICADOR MONTADO EN TORRE DE TAILANDIA POR REGIONAL
    276. FIGURA 95. INDONESIA ANÁLISIS DEL MERCADO TMA DE AMPLIFICADOR MONTADO EN TORRE POR TIPO DE AMPLIFICADOR
    277. FIGURA 96. ANÁLISIS DEL MERCADO TMA DE AMPLIFICADOR MONTADO EN TORRE DE INDONESIA POR APLICACIÓN
    278. FIGURA 97. ANÁLISIS DEL MERCADO TMA DE AMPLIFICADOR MONTADO EN TORRE DE INDONESIA POR RANGO DE FRECUENCIA
    279. FIGURA 98. ANÁLISIS DEL MERCADO TMA DE AMPLIFICADORES MONTADOS EN TORRE DE INDONESIA POR POTENCIA DE SALIDA
    280. FIGURA 99. ANÁLISIS DEL MERCADO TMA DE AMPLIFICADORES MONTADOS EN TORRE DE INDONESIA POR TIPO DE INSTALACIÓN
    281. FIGURA 100. ANÁLISIS DEL MERCADO TMA DE AMPLIFICADORES MONTADOS EN TORRE DE INDONESIA POR REGIONAL
    282. FIGURA 101. ANÁLISIS DEL MERCADO TMA DE AMPLIFICADORES MONTADOS EN TORRE DEL RESTO DE APAC POR TIPO DE AMPLIFICADOR
    283. FIGURA 102. ANÁLISIS DEL MERCADO TMA DE AMPLIFICADORES MONTADOS EN TORRE DEL RESTO DE APAC POR APLICACIÓN
    284. FIGURA 103. ANÁLISIS DEL MERCADO TMA DE AMPLIFICADORES MONTADOS EN TORRE DEL RESTO DE APAC POR FRECUENCIA GAMA
    285. FIGURA 104. RESTO DEL MERCADO TMA DE AMPLIFICADORES MONTADOS EN TORRE DE APAC POR POTENCIA DE SALIDA
    286. FIGURA 105. ANÁLISIS DEL MERCADO TMA DE AMPLIFICADORES MONTADOS EN TORRE DEL RESTO DE APAC POR TIPO DE INSTALACIÓN
    287. FIGURA 106. RESTO DE LA TORRE DE APAC AMPLIFICADOR MONTADO TMA MERCADO ANÁLISIS POR REGIONAL
    288. FIGURA 107. ANÁLISIS DEL MERCADO TMA DE AMPLIFICADOR MONTADO EN TORRE DE AMÉRICA DEL SUR
    289. FIGURA 108. ANÁLISIS DEL MERCADO TMA DE AMPLIFICADOR MONTADO EN TORRE DE BRASIL POR TIPO DE AMPLIFICADOR
    290. FIGURA 109. ANÁLISIS DEL MERCADO TMA DE AMPLIFICADOR MONTADO EN TORRE DE BRASIL POR APLICACIÓN
    291. FIGURA 110. ANÁLISIS DEL MERCADO TMA DE AMPLIFICADORES MONTADOS EN TORRE DE BRASIL POR RANGO DE FRECUENCIA
    292. FIGURA 111. ANÁLISIS DEL MERCADO TMA DE AMPLIFICADORES MONTADOS EN TORRE DE BRASIL POR POTENCIA DE SALIDA
    293. FIGURA 112. ANÁLISIS DEL MERCADO TMA DE AMPLIFICADORES MONTADOS EN TORRE DE BRASIL POR TIPO DE INSTALACIÓN
    294. FIGURA 113. ANÁLISIS DEL MERCADO TMA DE AMPLIFICADORES MONTADOS EN TORRE DE BRASIL POR REGIONAL
    295. FIGURA 114. ANÁLISIS DEL MERCADO TMA DE AMPLIFICADORES MONTADOS EN TORRE DE MÉXICO POR TIPO DE AMPLIFICADOR
    296. FIGURA 115. MERCADO TMA DE AMPLIFICADORES MONTADOS EN TORRE DE MÉXICO ANÁLISIS POR APLICACIÓN
    297. FIGURA 116. MERCADO DE AMPLIFICADORES TMA DE TORRE ANÁLISIS POR RANGO DE FRECUENCIA
    298. FIGURA 117. MERCADO DE AMPLIFICADORES TMA DE TORRE ANÁLISIS POR POTENCIA DE SALIDA
    299. FIGURA 118. MERCADO DE AMPLIFICADORES TMA DE TORRE DE MÉXICO ANÁLISIS POR TIPO DE INSTALACIÓN
    300. FIGURA 119. MERCADO DE AMPLIFICADORES DE TORRE TMA ANÁLISIS POR REGIONAL
    301. FIGURA 120. ARGENTINA AMPLIFICADORES DE TORRE TMA ANÁLISIS DEL MERCADO POR TIPO DE AMPLIFICADOR
    302. FIGURA 121. ARGENTINA AMPLIFICADORES DE TORRE TMA ANÁLISIS DE MERCADO POR APLICACIÓN
    303. FIGURA 122. ARGENTINA AMPLIFICADOR TMA DE TORRE ANÁLISIS DE MERCADO POR RANGO DE FRECUENCIA
    304. FIGURA 123. ARGENTINA AMPLIFICADOR TMA DE TORRE ANÁLISIS POR POTENCIA DE SALIDA
    305. FIGURA 124. ARGENTINA TORRE MONTADA ANÁLISIS DE MERCADO DE AMPLIFICADORES TMA POR TIPO DE INSTALACIÓN
    306. FIGURA 125. ARGENTINA ANÁLISIS DE MERCADO DE AMPLIFICADORES TMA DE TORRE POR REGIONAL
    307. FIGURA 126. RESTO DE SUDAMÉRICA ANÁLISIS DE MERCADO DE AMPLIFICADORES TMA DE TORRE POR TIPO DE AMPLIFICADOR
    308. FIGURA 127. RESTO DE SUDAMÉRICA ANÁLISIS DEL MERCADO TMA AMPLIFICADOR MONTADO EN TORRE POR APLICACIÓN
    309. FIGURA 128. ANÁLISIS DEL MERCADO TMA AMPLIFICADOR MONTADO EN TORRE RESTO DE SUDAMÉRICA POR RANGO DE FRECUENCIA
    310. FIGURA 129. ANÁLISIS DEL MERCADO TMA AMPLIFICADOR MONTADO EN TORRE RESTO DE SUDAMÉRICA POR POTENCIA DE SALIDA
    311. FIGURA 130. RESTO DE SUDAMÉRICA ANÁLISIS DEL MERCADO DE AMPLIFICADORES TMA DE TORRE POR TIPO DE INSTALACIÓN
    312. FIGURA 131. RESTO DE SUDAMÉRICA ANÁLISIS DEL MERCADO DE AMPLIFICADORES DE TORRE TMA POR REGIONAL
    313. FIGURA 132. MEA MONTADO EN TORRE ANÁLISIS DEL MERCADO DE AMPLIFICADOR TMA
    314. FIGURA 133. PAÍSES DEL CCG ANÁLISIS DEL MERCADO DE AMPLIFICADOR TMA MONTADO EN TORRE POR TIPO DE AMPLIFICADOR
    315. FIGURA 134. PAÍSES DEL CCG ANÁLISIS DEL MERCADO DE AMPLIFICADOR TMA MONTADO EN TORRE POR APLICACIÓN
    316. FIGURA 135. PAÍSES DEL CCG MONTADO EN TORRE ANÁLISIS DEL MERCADO DE AMPLIFICADORES TMA POR RANGO DE FRECUENCIA
    317. FIGURA 136. PAÍSES DEL CCG ANÁLISIS DEL MERCADO DE AMPLIFICADORES TMA MONTADOS EN TORRE POR POTENCIA DE SALIDA
    318. FIGURA 137. PAÍSES DEL CCG ANÁLISIS DEL MERCADO DE AMPLIFICADORES TMA MONTADOS EN TORRE POR TIPO DE INSTALACIÓN
    319. FIGURA 138. PAÍSES DEL CCG ANÁLISIS DEL MERCADO DE TMA DE AMPLIFICADOR MONTADO EN TORRE POR REGIONAL
    320. FIGURA 139. ANÁLISIS DEL MERCADO DE TMA DE AMPLIFICADOR MONTADO EN TORRE DE SUDÁFRICA POR TIPO DE AMPLIFICADOR
    321. FIGURA 140. ANÁLISIS DEL MERCADO DE TMA DE AMPLIFICADOR MONTADO EN TORRE DE SUDÁFRICA POR APLICACIÓN
    322. FIGURA 141. ANÁLISIS DEL MERCADO TMA DE AMPLIFICADORES MONTADOS EN TORRE DE SUDÁFRICA POR RANGO DE FRECUENCIA
    323. FIGURA 142. ANÁLISIS DEL MERCADO TMA DE AMPLIFICADORES MONTADOS EN TORRE DE SUDÁFRICA POR POTENCIA DE SALIDA
    324. FIGURA 143. ANÁLISIS DEL MERCADO TMA DE AMPLIFICADORES MONTADOS EN TORRE DE SUDÁFRICA POR INSTALACIÓN TIPO
    325. FIGURA 144. ANÁLISIS DEL MERCADO TMA DE AMPLIFICADORES MONTADOS EN TORRE DE SUDÁFRICA POR REGIONAL
    326. FIGURA 145. ANÁLISIS DEL MERCADO TMA DE AMPLIFICADORES MONTADOS EN TORRE DEL RESTO DE MEA POR TIPO DE AMPLIFICADOR
    327. FIGURA 146. RESTO DE AMPLIFICADORES MONTADOS EN TORRE DE MEA MERCADO TMA ANÁLISIS POR APLICACIÓN
    328. FIGURA 147. RESTO DE MEA AMPLIFICADORES DE TORRE TMA ANÁLISIS DE MERCADO POR RANGO DE FRECUENCIA
    329. FIGURA 148. RESTO DE MEA AMPLIFICADORES DE TORRE TMA ANÁLISIS DEL MERCADO POR POTENCIA DE SALIDA
    330. FIGURA 149. RESTO DE MEA MONTADO EN TORRE ANÁLISIS DE MERCADO DE AMPLIFICADORES TMA POR TIPO DE INSTALACIÓN
    331. FIGURA 150. RESTO DE MEA ANÁLISIS DE MERCADO DE AMPLIFICADORES TMA DE TORRE POR REGIONALES
    332. FIGURA 151. CRITERIOS CLAVE DE COMPRA DEL MERCADO DE AMPLIFICADORES DE TORRE TMA
    333. FIGURA 152. PROCESO DE INVESTIGACIÓN DE MRFR
    334. FIGURA 153. ANÁLISIS DRO DEL MERCADO TMA DE AMPLIFICADORES MONTADOS EN TORRE
    335. FIGURA 154. ANÁLISIS DE IMPACTO DE LOS IMPULSORES: MERCADO TMA DE AMPLIFICADORES MONTADOS EN TORRE
    336. FIGURA 155. ANÁLISIS DE IMPACTO DE LAS RESTRICCIONES: MERCADO TMA DE AMPLIFICADORES MONTADOS EN TORRE
    337. FIGURA 156. CADENA DE SUMINISTRO / VALOR: MERCADO TMA DE AMPLIFICADOR MONTADO EN TORRE
    338. FIGURA 157. MERCADO TMA DE AMPLIFICADOR MONTADO EN TORRE, POR TIPO DE AMPLIFICADOR, 2024 (% PARTICIPACIÓN)
    339. FIGURA 158. MERCADO TMA DE AMPLIFICADOR MONTADO EN TORRE, POR TIPO DE AMPLIFICADOR, 2019 HASTA 2032 (USD Miles de millones)
    340. FIGURA 159. MERCADO TMA DE AMPLIFICADORES MONTADOS EN TORRE, POR APLICACIÓN, 2024 (% DE PARTICIPACIÓN)
    341. FIGURA 160. MERCADO TMA DE AMPLIFICADORES MONTADOS EN TORRE, POR APLICACIÓN, 2019 A 2032 (Miles de millones de USD)
    342. FIGURA 161. AMPLIFICADOR TMA MONTADO EN TORRE MERCADO, POR RANGO DE FRECUENCIA, 2024 (% DE PARTICIPACIÓN)
    343. FIGURA 162. MERCADO TMA DE AMPLIFICADOR MONTADO EN TORRE, POR RANGO DE FRECUENCIA, 2019 A 2032 (Miles de millones de USD)
    344. FIGURA 163. MERCADO TMA DE AMPLIFICADOR MONTADO EN TORRE, POR POTENCIA PRODUCCIÓN, 2024 (% PARTICIPACIÓN)
    345. FIGURA 164. MERCADO TMA DE AMPLIFICADORES MONTADOS EN TORRE, POR POTENCIA DE SALIDA, 2019 A 2032 (Miles de millones de USD)
    346. FIGURA 165. MERCADO TMA DE AMPLIFICADORES MONTADOS EN TORRE, POR TIPO DE INSTALACIÓN, 2024 (% PARTICIPACIÓN)
    347. FIGURA 166. MONTADO EN TORRE MERCADO DE AMPLIFICADORES TMA, POR TIPO DE INSTALACIÓN, 2019 A 2032 (Miles de millones de USD)
    348. FIGURA 167. MERCADO DE AMPLIFICADORES TMA MONTADOS EN TORRE, POR REGIONAL, 2024 (% DE PARTICIPACIÓN)
    349. FIGURA 168. MERCADO DE AMPLIFICADORES TMA MONTADOS EN TORRE, POR REGIONALES, 2019 A 2032 (Miles de millones de dólares)
    350. GRÁFICO 169. EVALUACIÓN COMPARABLE DE LOS PRINCIPALES COMPETIDORES

Segmentación del mercado TMA de amplificadores montados en torre

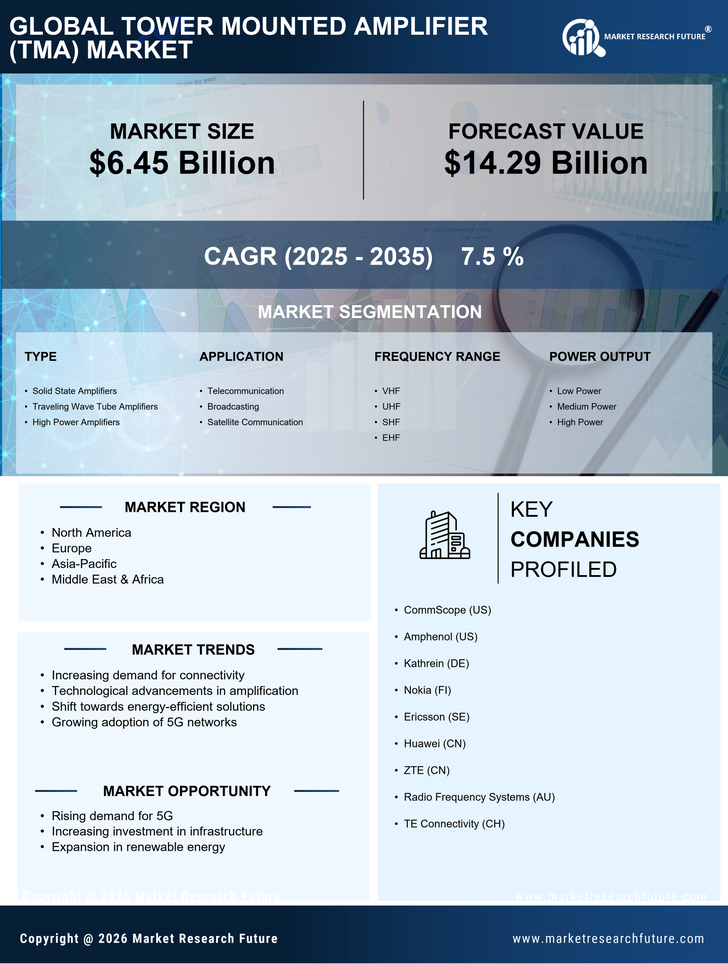
  • Mercado de TMA de amplificadores montados en torre por tipo de amplificador (miles de millones de dólares, 2019-2032)
    • Amplificadores de estado sólido
    • Amplificadores de válvulas de onda viajera
    • Amplificadores de alta potencia
  • Mercado de TMA de amplificadores montados en torre por aplicación (miles de millones de dólares, 2019-2032)
    • Telecomunicaciones
    • Transmisión
    • Comunicación por satélite
  • Mercado de TMA de amplificadores montados en torre por rango de frecuencia (miles de millones de dólares, 2019-2032)
    • VHF
    • UHF
    • SHF
    • EHF
  • Mercado de TMA de amplificadores montados en torre por potencia de salida (miles de millones de dólares, 2019-2032)
    • Bajo consumo
    • Potencia media
    • Alta potencia
  • Mercado de TMA de amplificadores montados en torre por tipo de instalación (miles de millones de dólares, 2019-2032)
    • Interior
    • Al aire libre
  • Mercado TMA de amplificadores montados en torre por región (miles de millones de dólares, 2019-2032)
    • América del Norte
    • Europa
    • América del Sur
    • Asia Pacífico
    • Medio Oriente y África

Perspectiva regional del mercado TMA de amplificadores montados en torre (miles de millones de dólares, 2019-2032)

  • Perspectivas de América del Norte (miles de millones de dólares, 2019-2032)
    • Mercado TMA de amplificadores montados en torre de América del Norte por tipo de amplificador
      • Amplificadores de estado sólido
      • Amplificadores de válvulas de onda viajera
      • Amplificadores de alta potencia
    • Mercado TMA de amplificadores montados en torre de América del Norte por tipo de aplicación
      • Telecomunicaciones
      • Transmisión
      • Comunicación por satélite
    • Mercado TMA de amplificadores montados en torre de América del Norte por tipo de rango de frecuencia
      • VHF
      • UHF
      • SHF
      • EHF
    • Mercado TMA de amplificadores montados en torre de América del Norte por tipo de salida de potencia
      • Bajo consumo
      • Potencia media
      • Alta potencia
    • Mercado TMA de amplificadores montados en torre de América del Norte por tipo de instalación
      • Interior
      • Al aire libre
    • Mercado TMA de amplificadores montados en torre de América del Norte por tipo regional
      • EE.UU.
      • Canadá
    • Perspectivas de EE. UU. (miles de millones de dólares, 2019-2032)
    • Mercado TMA de amplificadores montados en torre de EE. UU. por tipo de amplificador
      • Amplificadores de estado sólido
      • Amplificadores de válvulas de onda viajera
      • Amplificadores de alta potencia
    • Mercado TMA de amplificadores montados en torre de EE. UU. por tipo de aplicación
      • Telecomunicaciones
      • Transmisión
      • Comunicación por satélite
    • Mercado TMA de amplificadores montados en torre de EE. UU. por tipo de rango de frecuencia
      • VHF
      • UHF
      • SHF
      • EHF
    • Mercado TMA de amplificadores montados en torre de EE. UU. por tipo de salida de potencia
      • Bajo consumo
      • Potencia media
      • Alta potencia
    • Mercado TMA de amplificadores montados en torre de EE. UU. por tipo de instalación
      • Interior
      • Al aire libre
    • Perspectivas de CANADÁ (miles de millones de dólares, 2019-2032)
    • Mercado TMA de amplificadores montados en torre de CANADÁ por tipo de amplificador
      • Amplificadores de estado sólido
      • Amplificadores de válvulas de onda viajera
      • Amplificadores de alta potencia
    • Mercado TMA de amplificadores montados en torre de CANADÁ por tipo de aplicación
      • Telecomunicaciones
      • Transmisión
      • Comunicación por satélite
    • Mercado TMA de amplificadores montados en torre de CANADÁ por tipo de rango de frecuencia
      • VHF
      • UHF
      • SHF
      • EHF
    • Mercado TMA de amplificadores montados en torre de CANADÁ por tipo de salida de potencia
      • Bajo consumo
      • Potencia media
      • Alta potencia
    • Mercado TMA de amplificadores montados en torre de CANADÁ por tipo de instalación
      • Interior
      • Al aire libre
    • Perspectivas de Europa (miles de millones de dólares, 2019-2032)
      • Mercado europeo de amplificadores montados en torre TMA por tipo de amplificador
        • Amplificadores de estado sólido
        • Amplificadores de válvulas de onda viajera
        • Amplificadores de alta potencia
      • Mercado europeo TMA de amplificadores montados en torre por tipo de aplicación
        • Telecomunicaciones
        • Transmisión
        • Comunicación por satélite
      • Mercado europeo de amplificadores montados en torre TMA por tipo de rango de frecuencia
        • VHF
        • UHF
        • SHF
        • EHF
      • Mercado europeo de amplificadores montados en torre TMA por tipo de potencia de salida
        • Bajo consumo
        • Potencia media
        • Alta potencia
      • Mercado europeo de amplificadores montados en torre TMA por tipo de instalación
        • Interior
        • Al aire libre
      • Mercado europeo de amplificadores montados en torre TMA por tipo regional
        • Alemania
        • Reino Unido
        • Francia
        • Rusia
        • Italia
        • España
        • Resto de Europa
      • Perspectivas de ALEMANIA (miles de millones de dólares, 2019-2032)
      • Mercado TMA de amplificadores montados en torre de ALEMANIA por tipo de amplificador
        • Amplificadores de estado sólido
        • Amplificadores de válvulas de onda viajera
        • Amplificadores de alta potencia
      • Mercado TMA de amplificadores montados en torre de ALEMANIA por tipo de aplicación
        • Telecomunicaciones
        • Transmisión
        • Comunicación por satélite
      • Mercado TMA de amplificadores montados en torre de ALEMANIA por tipo de rango de frecuencia
        • VHF
        • UHF
        • SHF
        • EHF
      • Mercado TMA de amplificadores montados en torre de ALEMANIA por tipo de salida de potencia
        • Bajo consumo
        • Potencia media
        • Alta potencia
      • Mercado TMA de amplificadores montados en torre de ALEMANIA por tipo de instalación
        • Interior
        • Al aire libre
      • Perspectivas del Reino Unido (miles de millones de dólares, 2019-2032)
      • Mercado TMA de amplificadores montados en torre del Reino Unido por tipo de amplificador
        • Amplificadores de estado sólido
        • Amplificadores de válvulas de onda viajera
        • Amplificadores de alta potencia
      • Mercado TMA de amplificadores montados en torre del Reino Unido por tipo de aplicación
        • Telecomunicaciones
        • Transmisión
        • Comunicación por satélite
      • Mercado TMA de amplificadores montados en torre del Reino Unido por tipo de rango de frecuencia
        • VHF
        • UHF
        • SHF
        • EHF
      • Mercado TMA de amplificadores montados en torre del Reino Unido por tipo de salida de potencia
        • Bajo consumo
        • Potencia media
        • Alta potencia
      • Mercado TMA de amplificadores montados en torre del Reino Unido por tipo de instalación
        • Interior
        • Al aire libre
      • Perspectivas de FRANCIA (miles de millones de dólares, 2019-2032)
      • Mercado TMA de amplificadores montados en torre de FRANCIA por tipo de amplificador
        • Amplificadores de estado sólido
        • Amplificadores de válvulas de onda viajera
        • Amplificadores de alta potencia
      • Mercado TMA de amplificadores montados en torre de FRANCIA por tipo de aplicación
        • Telecomunicaciones
        • Transmisión
        • Comunicación por satélite
      • Mercado TMA de amplificadores montados en torre de FRANCIA por tipo de rango de frecuencia
        • VHF
        • UHF
        • SHF
        • EHF
      • Mercado TMA de amplificadores montados en torre de FRANCIA por tipo de salida de potencia
        • Bajo consumo
        • Potencia media
        • Alta potencia
      • Mercado TMA de amplificadores montados en torre de FRANCIA por tipo de instalación
        • Interior
        • Al aire libre
      • Perspectivas de RUSIA (miles de millones de dólares, 2019-2032)
      • Mercado TMA de amplificadores montados en torre de RUSIA por tipo de amplificador
        • Amplificadores de estado sólido
        • Amplificadores de válvulas de onda viajera
        • Amplificadores de alta potencia
      • Mercado TMA de amplificadores montados en torre de RUSIA por tipo de aplicación
        • Telecomunicaciones
        • Transmisión
        • Comunicación por satélite
      • Mercado TMA de amplificadores montados en torre de RUSIA por tipo de rango de frecuencia
        • VHF
        • UHF
        • SHF
        • EHF
      • Mercado TMA de amplificadores montados en torre de RUSIA por tipo de salida de potencia
        • Bajo consumo
        • Potencia media
        • Alta potencia
      • Mercado TMA de amplificadores montados en torre de RUSIA por tipo de instalación
        • Interior
        • Al aire libre
      • Perspectivas de ITALIA (miles de millones de dólares, 2019-2032)
      • Mercado TMA de amplificadores montados en torre de ITALIA por tipo de amplificador
        • Amplificadores de estado sólido
        • Amplificadores de válvulas de onda viajera
        • Amplificadores de alta potencia
      • Mercado TMA de amplificadores montados en torre de ITALIA por tipo de aplicación
        • Telecomunicaciones
        • Transmisión
        • Comunicación por satélite
      • Mercado TMA de amplificadores montados en torre de ITALIA por tipo de rango de frecuencia
        • VHF
        • UHF
        • SHF
        • EHF
      • Mercado TMA de amplificadores montados en torre de ITALIA por tipo de salida de potencia
        • Bajo consumo
        • Potencia media
        • Alta potencia
      • Mercado TMA de amplificadores montados en torre de ITALIA por tipo de instalación
        • Interior
        • Al aire libre
      • Perspectivas de ESPAÑA (miles de millones de dólares, 2019-2032)
      • Mercado TMA de amplificadores de torre de ESPAÑA por tipo de amplificador
        • Amplificadores de estado sólido
        • Amplificadores de válvulas de onda viajera
        • Amplificadores de alta potencia
      • Mercado TMA de amplificadores de torre en ESPAÑA por tipo de aplicación
        • Telecomunicaciones
        • Transmisión
        • Comunicación por satélite
      • Mercado de amplificadores de torre TMA de ESPAÑA por tipo de rango de frecuencia
        • VHF
        • UHF
        • SHF
        • EHF
      • Mercado de amplificadores de torre TMA de ESPAÑA por tipo de potencia de salida
        • Bajo consumo
        • Potencia media
        • Alta potencia
      • Mercado de Amplificadores de torre TMA en ESPAÑA por tipo de instalación
        • Interior
        • Al aire libre
      • Perspectivas DEL RESTO DE EUROPA (Miles de millones de dólares, 2019-2032)
      • RESTO DE EUROPA Mercado de amplificadores montados en torre TMA por tipo de amplificador
        • Amplificadores de estado sólido
        • Amplificadores de válvulas de onda viajera
        • Amplificadores de alta potencia
      • RESTO DE EUROPA Mercado TMA de amplificadores montados en torre por tipo de aplicación
        • Telecomunicaciones
        • Transmisión
        • Comunicación por satélite
      • RESTO DE EUROPA Mercado TMA de amplificadores montados en torre por tipo de rango de frecuencia
        • VHF
        • UHF
        • SHF
        • EHF
      • Mercado TMA de amplificadores montados en torre del RESTO DE EUROPA por tipo de salida de potencia
        • Bajo consumo
        • Potencia media
        • Alta potencia
      • RESTO DE EUROPA Mercado de amplificadores montados en torre TMA por tipo de instalación
        • Interior
        • Al aire libre
      • Perspectivas de Asia Pacífico (miles de millones de dólares, 2019-2032)
        • Mercado TMA de amplificadores montados en torre de APAC por tipo de amplificador
          • Amplificadores de estado sólido
          • Amplificadores de válvulas de onda viajera
          • Amplificadores de alta potencia
        • Mercado TMA de amplificadores montados en torre de APAC por tipo de aplicación
          • Telecomunicaciones
          • Transmisión
          • Comunicación por satélite
        • Mercado TMA de amplificadores montados en torre de APAC por tipo de rango de frecuencia
          • VHF
          • UHF
          • SHF
          • EHF
        • Mercado TMA de amplificadores montados en torre de APAC por tipo de salida de potencia
          • Bajo consumo
          • Potencia media
          • Alta potencia
        • Mercado TMA de amplificadores montados en torre de APAC por tipo de instalación
          • Interior
          • Al aire libre
        • Mercado TMA de amplificadores montados en torre de APAC por tipo regional
          • China
          • India
          • Japón
          • Corea del Sur
          • Malasia
          • Tailandia
          • Indonesia
          • Resto de APAC
        • CHIPerspectivas de NA (miles de millones de dólares, 2019-2032)
        • Mercado TMA de amplificadores montados en torre de CHINA por tipo de amplificador
          • Amplificadores de estado sólido
          • Amplificadores de válvulas de onda viajera
          • Amplificadores de alta potencia
        • Mercado CHINA Amplificador montado en torre TMA por tipo de aplicación
          • Telecomunicaciones
          • Transmisión
          • Comunicación por satélite
        • Mercado TMA de amplificadores montados en torre de CHINA por tipo de rango de frecuencia
          • VHF
          • UHF
          • SHF
          • EHF
        • Mercado TMA de amplificadores montados en torre de CHINA por tipo de salida de potencia
          • Bajo consumo
          • Potencia media
          • Alta potencia
        • Mercado CHINA de amplificadores montados en torre TMA por tipo de instalación
          • Interior
          • Al aire libre
        • Perspectivas de la INDIA (miles de millones de dólares, 2019-2032)
        • Mercado TMA de amplificadores montados en torre de INDIA por tipo de amplificador
          • Amplificadores de estado sólido
          • Amplificadores de válvulas de onda viajera
          • Amplificadores de alta potencia
        • Mercado TMA de amplificadores montados en torre de INDIA por tipo de aplicación
          • Telecomunicaciones
          • Transmisión
          • Comunicación por satélite
        • Mercado TMA de amplificadores montados en torre de INDIA por tipo de rango de frecuencia
          • VHF
          • UHF
          • SHF
          • EHF
        • Mercado TMA de amplificadores montados en torre de INDIA por tipo de salida de potencia
          • Bajo consumo
          • Potencia media
          • Alta potencia
        • Mercado TMA de amplificadores montados en torre de INDIA por tipo de instalación
          • Interior
          • Al aire libre
        • Perspectivas de JAPÓN (miles de millones de dólares, 2019-2032)
        • Mercado TMA de amplificadores montados en torre de Japón por tipo de amplificador
          • Amplificadores de estado sólido
          • Amplificadores de válvulas de onda viajera
          • Amplificadores de alta potencia
        • Mercado TMA de amplificadores montados en torre de Japón por tipo de aplicación
          • Telecomunicaciones
          • Transmisión
          • Comunicación por satélite
        • Mercado TMA de amplificadores montados en torre de Japón por tipo de rango de frecuencia
          • VHF
          • UHF
          • SHF
          • EHF
        • Mercado TMA de amplificadores montados en torre de Japón por tipo de salida de potencia
          • Bajo consumo
          • Potencia media
          • Alta potencia
        • Mercado TMA de amplificadores montados en torre de Japón por tipo de instalación
          • Interior
          • Al aire libre
        • Perspectivas de COREA DEL SUR (miles de millones de dólares, 2019-2032)
        • Mercado TMA de amplificadores montados en torre de COREA DEL SUR por tipo de amplificador
          • Amplificadores de estado sólido
          • Amplificadores de válvulas de onda viajera
          • Amplificadores de alta potencia
        • Mercado TMA de amplificadores montados en torre de COREA DEL SUR por tipo de aplicación
          • Telecomunicaciones
          • Transmisión
          • Comunicación por satélite
        • Mercado TMA de amplificadores montados en torre de COREA DEL SUR por tipo de rango de frecuencia
          • VHF
          • UHF
          • SHF
          • EHF
        • Mercado TMA de amplificadores montados en torre de COREA DEL SUR por tipo de salida de potencia
          • Bajo consumo
          • Potencia media
          • Alta potencia
        • Mercado TMA de amplificadores montados en torre de COREA DEL SUR por tipo de instalación
          • Interior
          • Al aire libre
        • Perspectivas de MALASIA (miles de millones de dólares, 2019-2032)
        • Mercado TMA de amplificadores montados en torre de MALASIA por tipo de amplificador
          • Amplificadores de estado sólido
          • Amplificadores de válvulas de onda viajera
          • Amplificadores de alta potencia
        • Mercado TMA de amplificadores montados en torre de MALASIA por tipo de aplicación
          • Telecomunicaciones
          • Transmisión
          • Comunicación por satélite
        • Mercado TMA de amplificadores montados en torre de MALASIA por tipo de rango de frecuencia
          • VHF
          • UHF
          • SHF
          • EHF
        • Mercado TMA de amplificadores montados en torre de MALASIA por tipo de salida de potencia
          • Bajo consumo
          • Potencia media
          • Alta potencia
        • Mercado TMA de amplificadores montados en torre de MALASIA por tipo de instalación
          • Interior
          • Al aire libre
        • Perspectivas de TAILANDIA (miles de millones de dólares, 2019-2032)
        • Mercado TMA de amplificadores montados en torre de TAILANDIA por tipo de amplificador
          • Amplificadores de estado sólido
          • Amplificadores de válvulas de onda viajera
          • Amplificadores de alta potencia
        • Mercado TMA de amplificadores montados en torre de TAILANDIA por tipo de aplicación
          • Telecomunicaciones
          • Transmisión
          • Comunicación por satélite
        • Mercado TMA de amplificadores montados en torre de TAILANDIA por tipo de rango de frecuencia
          • VHF
          • UHF
          • SHF
          • EHF
        • Mercado TMA de amplificadores montados en torre de TAILANDIA por tipo de salida de potencia
          • Bajo consumo
          • Potencia media
          • Alta potencia
        • Mercado TMA de amplificadores montados en torre de TAILANDIA por tipo de instalación
          • Interior
          • Al aire libre
        • Perspectivas de INDONESIA (miles de millones de dólares, 2019-2032)
        • Mercado TMA de amplificadores montados en torre de INDONESIA por tipo de amplificador
          • Amplificadores de estado sólido
          • Amplificadores de válvulas de onda viajera
          • Amplificadores de alta potencia
        • Mercado TMA de amplificadores montados en torre de INDONESIA por tipo de aplicación
          • Telecomunicaciones
          • Transmisión
          • Comunicación por satélite
        • Mercado TMA de amplificadores montados en torre de INDONESIA por tipo de rango de frecuencia
          • VHF
          • UHF
          • SHF
          • EHF
        • Mercado TMA de amplificadores montados en torre de INDONESIA por tipo de salida de potencia
          • Bajo consumo
          • Potencia media
          • Alta potencia
        • Mercado TMA de amplificadores montados en torre de INDONESIA por tipo de instalación
          • Interior
          • Al aire libre
        • Perspectivas del RESTO DE APAC (miles de millones de dólares, 2019-2032)
        • RESTO DEL Mercado TMA de amplificadores montados en torre de APAC por tipo de amplificador
          • Amplificadores de estado sólido
          • Amplificadores de válvulas de onda viajera
          • Amplificadores de alta potencia
        • RESTO DEL Mercado TMA de amplificadores montados en torre de APAC por tipo de aplicación
          • Telecomunicaciones
          • Transmisión
          • Comunicación por satélite
        • RESTO DEL Mercado TMA de amplificadores montados en torre de APAC por tipo de rango de frecuencia
          • VHF
          • UHF
          • SHF
          • EHF
        • RESTO DEL Mercado TMA de amplificadores montados en torre de APAC por tipo de salida de potencia
          • Bajo consumo
          • Potencia media
          • Alta potencia
        • RESTO DEL Mercado TMA de amplificadores montados en torre de APAC por tipo de instalación
          • Interior
          • Al aire libre
        • Perspectivas de América del Sur (miles de millones de dólares, 2019-2032)
          • Mercado TMA de amplificadores montados en torre de América del Sur por tipo de amplificador
            • Amplificadores de estado sólido
            • Amplificadores de válvulas de onda viajera
            • Amplificadores de alta potencia
          • Mercado TMA de amplificadores montados en torre de América del Sur por tipo de aplicación
            • Telecomunicaciones
            • Transmisión
            • Comunicación por satélite
          • Mercado TMA de amplificadores montados en torre de América del Sur por tipo de rango de frecuencia
            • VHF
            • UHF
            • SHF
            • EHF
          • Mercado TMA de amplificadores montados en torre de América del Sur por tipo de salida de potencia
            • Bajo consumo
            • Potencia media
            • Alta potencia
          • Mercado TMA de amplificadores montados en torre de América del Sur por tipo de instalación
            • Interior
            • Al aire libre
          • Mercado TMA de amplificadores montados en torre de América del Sur por tipo regional
            • Brasil
            • México
            • Argentina
            • Resto de Sudamérica
          • Perspectivas de BRASIL (miles de millones de dólares, 2019-2032)
          • Mercado TMA de amplificadores montados en torre de BRASIL por tipo de amplificador
            • Amplificadores de estado sólido
            • Amplificadores de válvulas de onda viajera
            • Amplificadores de alta potencia
          • Mercado TMA de amplificadores montados en torre de BRASIL por tipo de aplicación
            • Telecomunicaciones
            • Transmisión
            • Comunicación por satélite
          • Mercado TMA de amplificadores montados en torre de BRASIL por tipo de rango de frecuencia
            • VHF
            • UHF
            • SHF
            • EHF
          • Mercado TMA de amplificadores montados en torre de BRASIL por tipo de salida de potencia
            • Bajo consumo
            • Potencia media
            • Alta potencia
          • Mercado TMA de amplificadores montados en torre de BRASIL por tipo de instalación
            • Interior
            • Al aire libre
          • Perspectivas de MÉXICO (Miles de millones de dólares, 2019-2032)
          • Mercado TMA de amplificadores montados en torre en MÉXICO por tipo de amplificador
            • Amplificadores de estado sólido
            • Amplificadores de válvulas de onda viajera
            • Amplificadores de alta potencia
          • Mercado TMA de amplificadores montados en torre en MÉXICO por tipo de aplicación
            • Telecomunicaciones
            • Transmisión
            • Comunicación por satélite
          • Mercado TMA de amplificadores montados en torre en MÉXICO por tipo de rango de frecuencia
            • VHF
            • UHF
            • SHF
            • EHF
          • Mercado TMA de amplificadores montados en torre en MÉXICO por tipo de salida de potencia
            • Bajo consumo
            • Potencia media
            • Alta potencia
          • Mercado TMA de amplificadores montados en torre en MÉXICO por tipo de instalación
            • Interior
            • Al aire libre
          • Perspectivas de ARGENTINA (miles de millones de dólares, 2019-2032)
          • Mercado ARGENTINA de amplificadores montados en torre TMA por tipo de amplificador
            • Amplificadores de estado sólido
            • Amplificadores de válvulas de onda viajera
            • Amplificadores de alta potencia
          • Mercado ARGENTINA Amplificador montado en torre TMA por tipo de aplicación
            • Telecomunicaciones
            • Transmisión
            • Comunicación por satélite
          • Mercado ARGENTINA de amplificadores montados en torre TMA por tipo de rango de frecuencia
            • VHF
            • UHF
            • SHF
            • EHF
          • Mercado ARGENTINA de amplificadores montados en torre TMA por tipo de potencia de salida
            • Bajo consumo
            • Potencia media
            • Alta potencia
          • Mercado ARGENTINA de amplificadores montados en torre TMA por tipo de instalación
            • Interior
            • Al aire libre
          • Perspectivas DEL RESTO DE AMÉRICA DEL SUR (Miles de millones de dólares, 2019-2032)
          • RESTO DE AMÉRICA DEL SUR Mercado TMA de amplificadores montados en torre por tipo de amplificador
            • Amplificadores de estado sólido
            • Amplificadores de válvulas de onda viajera
            • Amplificadores de alta potencia
          • RESTO DE AMÉRICA DEL SUR Mercado TMA de amplificadores montados en torre por tipo de aplicación
            • Telecomunicaciones
            • Transmisión
            • Comunicación por satélite
          • RESTO DE AMÉRICA DEL SUR Mercado de amplificadores montados en torre TMA por tipo de rango de frecuencia
            • VHF
            • UHF
            • SHF
            • EHF
          • RESTO DE AMÉRICA DEL SUR Mercado de amplificadores montados en torre TMA por tipo de potencia de salida
            • Bajo consumo
            • Potencia media
            • Alta potencia
          • RESTO DE AMÉRICA DEL SUR Mercado TMA de amplificadores montados en torre por tipo de instalación
            • Interior
            • Al aire libre
          • Perspectivas de los MEA (miles de millones de dólares, 2019-2032)
            • Mercado TMA de amplificadores montados en torre MEA por tipo de amplificador
              • Amplificadores de estado sólido
              • Amplificadores de válvulas de onda viajera
              • Amplificadores de alta potencia
            • Mercado TMA de amplificadores montados en torre MEA por tipo de aplicación
              • Telecomunicaciones
              • Transmisión
              • Comunicación por satélite
            • Mercado TMA de amplificadores montados en torre MEA por tipo de rango de frecuencia
              • VHF
              • UHF
              • SHF
              • EHF
            • Mercado TMA de amplificadores montados en torre MEA por tipo de salida de potencia
              • Bajo consumo
              • Potencia media
              • Alta potencia
            • Amplificador montado en torre MEA TMAMercado por tipo de instalación
              • Interior
              • Al aire libre
            • Mercado TMA de amplificadores montados en torre MEA por tipo regional
              • Países del CCG
              • Sudáfrica
              • Resto de MEA
            • Perspectivas de los PAÍSES del CCG (miles de millones de dólares, 2019-2032)
            • PAÍSES DEL CCG Mercado TMA de amplificadores montados en torre por tipo de amplificador
              • Amplificadores de estado sólido
              • Amplificadores de válvulas de onda viajera
              • Amplificadores de alta potencia
            • Países del CCG Mercado TMA de amplificadores montados en torre por tipo de aplicación
              • Telecomunicaciones
              • Transmisión
              • Comunicación por satélite
            • PAÍSES DEL CCG Mercado de amplificadores montados en torre TMA por tipo de rango de frecuencia
              • VHF
              • UHF
              • SHF
              • EHF
            • Países del CCG Mercado TMA de amplificadores montados en torre por tipo de salida de potencia
              • Bajo consumo
              • Potencia media
              • Alta potencia
            • Países del CCG Mercado de amplificadores montados en torre TMA por tipo de instalación
              • Interior
              • Al aire libre
            • Perspectivas de SUDÁFRICA (miles de millones de dólares, 2019-2032)
            • Mercado TMA de amplificadores montados en torre de SUDÁFRICA por tipo de amplificador
              • Amplificadores de estado sólido
              • Amplificadores de válvulas de onda viajera
              • Amplificadores de alta potencia
            • Mercado TMA de amplificadores montados en torre de SUDÁFRICA por tipo de aplicación
              • Telecomunicaciones
              • Transmisión
              • Comunicación por satélite
            • Mercado TMA de amplificadores montados en torre de SUDÁFRICA por tipo de rango de frecuencia
              • VHF
              • UHF
              • SHF
              • EHF
            • Mercado TMA de amplificadores montados en torre de SUDÁFRICA por tipo de salida de potencia
              • Bajo consumo
              • Potencia media
              • Alta potencia
            • Mercado TMA de amplificadores montados en torre de SUDÁFRICA por tipo de instalación
              • Interior
              • Al aire libre
            • Perspectivas del RESTO DE MEA (miles de millones de dólares, 2019-2032)
            • RESTO DEL Mercado TMA de amplificadores montados en torre de MEA por tipo de amplificador
              • Amplificadores de estado sólido
              • Amplificadores de válvulas de onda viajera
              • Amplificadores de alta potencia
            • RESTO DEL Mercado TMA de amplificadores montados en torre MEA por tipo de aplicación
              • Telecomunicaciones
              • Transmisión
              • Comunicación por satélite
            • RESTO DEL Mercado TMA de amplificadores montados en torre de MEA por tipo de rango de frecuencia
              • VHF
              • UHF
              • SHF
              • EHF
            • RESTO DEL Mercado TMA de amplificadores montados en torre de MEA por tipo de salida de potencia
              • Bajo consumo
              • Potencia media
              • Alta potencia
            • RESTO DEL Mercado TMA de amplificadores montados en torre de MEA por tipo de instalación
              • Interior
              • Al aire libre

Compare Licence

×
Features License Type
Single User Multiuser License Enterprise User
Price $4,950 $5,950 $7,250
Maximum User Access Limit 1 User Upto 10 Users Unrestricted Access Throughout the Organization
Free Customization
Direct Access to Analyst
Deliverable Format
Platform Access
Discount on Next Purchase 10% 15% 15%
Printable Versions