Request Free Sample ×

Kindly complete the form below to receive a free sample of this Report

* Please use a valid business email

Leading companies partner with us for data-driven Insights

clients tt-cursor
Hero Background

Metaverse Market

ID: MRFR/ICT/9260-CR
153 Pages
Aarti Dhapte
Last Updated: April 24, 2026

Informe de investigación de mercado de Metaverso: Información por componente (software, hardware), por plataforma (computadoras de escritorio/portátiles, móviles, wearables), por tecnología (blockchain, VR y AR, realidad mixta, otras), por aplicación (compras en línea, creación de contenido, juegos, redes sociales, otras), por usuario final (consumidor, empresas), por región (Norteamérica, Asia-Pacífico, Europa y resto del mundo): tamaño de la industria, crecimiento de la participación y pronóstico hasta 2030.

Compartir
Download PDF ×

We do not share your information with anyone. However, we may send you emails based on your report interest from time to time. You may contact us at any time to opt-out.

Metaverse Market Infographic
Purchase Options
  1. 1 RESUMEN EJECUTIVO 19
    1. 1.1 ANÁLISIS DEL ATRACTIVO DEL MERCADO 21
  2. 2 INTRODUCCIÓN AL MERCADO 22
    1. 2.1 DEFINICIÓN 22
    2. 2.2 ALCANCE DEL ESTUDIO 22
    3. 2.3 OBJETIVO DE LA INVESTIGACIÓN 22
    4. 2.4 ESTRUCTURA DEL MERCADO 23
  3. 3 METODOLOGÍA DE LA INVESTIGACIÓN 24
  4. 4 DINÁMICA DEL MERCADO 32
    1. 4.1 INTRODUCCIÓN 32
    2. 4.2 IMPULSOR 33
      1. 4.2.1 AUMENTO DEL ENFOQUE EN LA CONVERGENCIA DE LOS MUNDOS DIGITAL Y FÍSICO MEDIANTE INTERNET 33
      2. 4.2.2 AUMENTO DE LA TRACCIÓN Y POPULARIDAD DE LA REALIDAD MIXTA (RM) 34
    3. 4.3 RESTRICCIÓN 35
      1. 4.3.1 CIBERAMENAZAS 35
    4. 4.4 OPORTUNIDAD 35
      1. 4.4.1 AVANCE TECNOLÓGICO 35
    5. 4.5 IMPACTO DE LA COVID-19 36
      1. 4.5.1 IMPACTO EN LA INDUSTRIA DE TI 36
      2. 4.5.2 IMPACTO EN EL GASTO DE TI DE LAS ORGANIZACIONES 36
      3. 4.5.3 IMPACTO EN LOS DESARROLLOS DEL METAVERSO 36
  5. 5 ANÁLISIS DE FACTORES DE MERCADO 37
    1. 5.1 CADENA DE VALOR 37
      1. 5.1.1 INVESTIGACIÓN Y DESARROLLADOR 37
      2. 5.1.2 INTEGRADORES DE SISTEMAS 37
      3. 5.1.3 USUARIOS FINALES 38
    2. 5.2 MODELO DE LAS CINCO FUERZAS DE PORTER 38
      1. 5.2.1 AMENAZA DE NUEVOS ENTRANTES 39
      2. 5.2.2 PODER DE NEGOCIACIÓN DE LOS PROVEEDORES 39
      3. 5.2.3 AMENAZA DE SUSTITUTOS 39
      4. 5.2.4 PODER DE NEGOCIACIÓN DE LOS COMPRADORES 39
      5. 5.2.5 INTENSIDAD DE LA RIVALIDAD 39
    3. ?
  6. 6 ESTATUS DEL METAVERSO GLOBAL 40
    1. 6.1 DIVISIÓN DEL METAVERSO POR ETAPA DE DESARROLLO 40
    2. 6.2 INVERSIONES DEL METAVERSO GLOBAL POR REGIÓN 40
    3. 6.3 METAVERSO GLOBAL ANÁLISIS DE USUARIOS PROYECTADOS 41
  7. 7 MERCADO METAVERSO GLOBAL, POR COMPONENTE 42
    1. 7.1 RESUMEN 42
      1. 7.1.1 MERCADO METAVERSO GLOBAL, POR COMPONENTE, 2022-2030 (MILLONES DE USD) 43
    2. 7.2 HARDWARE 43
      1. 7.2.1 CI 44
      2. 7.2.2 CIS 44
      3. 7.2.3 AR/VR 44
      4. 7.2.4 OTROS 44
    3. 7.3 SOFTWARE 44
  8. 8 MERCADO METAVERSO GLOBAL, POR PLATAFORMA 45
    1. 8.1 RESUMEN 45
      1. 8.1.1 MERCADO METAVERSO GLOBAL, POR PLATAFORMA, 2022-2030 (MILLONES DE USD) 46
    2. 8.2 COMPUTADORAS DE ESCRITORIO/PORTÁTILES 46
    3. 8.3 MÓVILES 46
    4. 8.4 DISPOSITIVOS VESTIBLES 46
  9. 9 MERCADO METAVERSO GLOBAL, POR TECNOLOGÍA 47
    1. 9.1 DESCRIPCIÓN GENERAL 47
      1. 9.1.1 MERCADO METAVERSO GLOBAL, POR TECNOLOGÍA, 2022-2030 (MILLONES DE USD) 48
    2. 9.2 BLOCKCHAIN 48
    3. 9.3 VR & RA [REALIDAD AUMENTADA (RA), REALIDAD VIRTUAL (RV)] 48
    4. 9.4 REALIDAD MIXTA 48
    5. 9.5 OTROS 49
  10. 10 MERCADO METAVERSO GLOBAL, POR APLICACIÓN 50
    1. 10.1 RESUMEN 50
      1. 10.1.1 MERCADO METAVERSO GLOBAL, POR APLICACIÓN, 2022-2030 (MILLONES DE USD) 51
    2. 10.2 JUEGOS 51
    3. 10.3 COMPRAS EN LÍNEA 51
    4. 10.4 CREACIÓN DE CONTENIDO 51
    5. 10.5 REDES SOCIALES 52
    6. 10.6 OTROS 52
    7. ?
  11. 11 MERCADO METAVERSO GLOBAL, POR USUARIO FINAL 53
    1. 11.1 RESUMEN 53
      1. 11.1.1 MERCADO METAVERSO GLOBAL, POR USUARIO FINAL, 2022-2030 (MILLONES DE USD) 54
    2. 11.2 CONSUMIDOR 54
    3. 11.3 EMPRESAS 54
      1. 11.3.1 MERCADO METAVERSO GLOBAL, POR EMPRESA 54
      2. 11.3.2 BFSI 55
      3. 11.3.3 VENTA MINORISTA 56
      4. 11.3.4 MEDIOS Y ENTRETENIMIENTO 56
      5. 11.3.5 EDUCACIÓN 56
      6. 11.3.6 BIENES RAÍCES 56
      7. 11.3.7 AEROESPACIAL Y DEFENSA 56
      8. 11.3.8 SALUD 56
      9. 11.3.9 INGENIERÍA 57
      10. 11.3.10 OTROS 57
  12. 12 MERCADO METAVERSO GLOBAL, POR REGIÓN 58
    1. 12.1 RESUMEN 58
      1. 12.1.1 MERCADO METAVERSO GLOBAL, POR REGIÓN, 2022 VS 2030 (MILLONES DE USD) 59
      2. 12.1.2 MERCADO METAVERSO GLOBAL, POR REGIÓN, 2022-2030 (MILLONES DE USD) 59
    2. 12.2 AMÉRICA DEL NORTE 60
      1. 12.2.1 AMÉRICA DEL NORTE: MERCADO METAVERSO, POR PAÍS, 2022-2030 (MILLONES DE USD) 61
      2. 12.2.2 MERCADO DE METAVERSO EN AMÉRICA DEL NORTE, POR COMPONENTE, 2022-2030 (MILLONES DE USD) 61
        1. 12.2.2.1 MERCADO DE METAVERSO EN AMÉRICA DEL NORTE, POR HARDWARE, 2022-2030 (MILLONES DE USD) 62
      3. 12.2.3 MERCADO DE METAVERSO EN AMÉRICA DEL NORTE, POR PLATAFORMA, 2022-2030 (MILLONES DE USD) 62
      4. 12.2.4 MERCADO DE METAVERSO EN AMÉRICA DEL NORTE, POR TECNOLOGÍA, 2022-2030 (MILLONES DE USD) 63
      5. 12.2.5 MERCADO DE METAVERSO EN AMÉRICA DEL NORTE, POR APLICACIÓN, 2022-2030 (MILLONES DE USD) 64
      6. 12.2.6 MERCADO DE METAVERSE EN AMÉRICA DEL NORTE, POR USUARIO FINAL, 2022-2030 (MILLONES DE USD) 65
        1. 12.2.6.1 MERCADO DE METAVERSE EN AMÉRICA DEL NORTE, POR EMPRESAS, 2022-2030 (MILLONES DE USD) 66
      7. 12.2.7 EE. UU. 66
        1. 12.2.7.1 MERCADO DE METAVERSE EN EE. UU., POR COMPONENTE, 2022-2030 (MILLONES DE USD) 66
          1. 12.2.7.1.1 MERCADO DE METAVERSE EN EE. UU., POR HARDWARE, 2022-2030 (MILLONES DE USD) 67
        2. 12.2.7.2 MERCADO DE METAVERSE EN EE. UU., POR PLATAFORMA, 2022-2030 (MILLONES DE USD) 67
        3. 12.2.7.3 MERCADO DE METAVERSO DE EE. UU., POR TECNOLOGÍA, 2022-2030 (MILLONES DE USD) 67
        4. 12.2.7.4 MERCADO DE METAVERSO DE EE. UU., POR APLICACIÓN, 2022-2030 (MILLONES DE USD) 68
        5. 12.2.7.5 MERCADO DE METAVERSO DE EE. UU., POR USUARIO FINAL, 2022-2030 (MILLONES DE USD) 68
          1. 12.2.7.5.1 MERCADO DE METAVERSO DE EE. UU., POR EMPRESAS, 2022-2030 (MILLONES DE USD) 68
      8. 12.2.8 CANADÁ 69
        1. 12.2.8.1 MERCADO DE METAVERSO DE CANADÁ, POR COMPONENTE, 2022-2030 (MILLONES DE USD) 69
          1. 12.2.8.1.1 MERCADO DE METAVERSO DE CANADÁ, POR HARDWARE, 2022-2030 (MILLONES DE USD) 69
        2. 12.2.8.2 MERCADO DE METAVERSO DE CANADÁ, POR PLATAFORMA, 2022-2030 (MILLONES DE USD) 69
        3. 12.2.8.3 MERCADO DE METAVERSO DE CANADÁ, POR TECNOLOGÍA, 2022-2030 (MILLONES DE USD) 70
        4. 12.2.8.4 MERCADO DE METAVERSO DE CANADÁ, POR APLICACIÓN, 2022-2030 (MILLONES DE USD) 70
        5. 12.2.8.5 MERCADO DE METAVERSO DE CANADÁ, POR USUARIO FINAL, 2022-2030 (MILLONES DE USD) 70
          1. 12.2.8.5.1 CANADÁ MERCADO METAVERSO, POR EMPRESAS, 2022-2030 (MILLONES DE USD) 71
      9. 12.2.9 MÉXICO 71
        1. 12.2.9.1 MÉXICO MERCADO METAVERSO, POR COMPONENTE, 2022-2030 (MILLONES DE USD) 71
          1. 12.2.9.1.1 MÉXICO MERCADO METAVERSO, POR HARDWARE, 2022-2030 (MILLONES DE USD) 72
        2. 12.2.9.2 MÉXICO MERCADO METAVERSO, POR PLATAFORMA, 2022-2030 (MILLONES DE USD) 72
        3. 12.2.9.3 MÉXICO MERCADO METAVERSO, POR TECNOLOGÍA, 2022-2030 (MILLONES DE USD) 72
        4. 12.2.9.4 MÉXICO MERCADO METAVERSO, POR APLICACIÓN, 2022-2030 (MILLONES DE USD) 73
        5. 12.2.9.5 MÉXICO MERCADO METAVERSO, POR USUARIO FINAL, 2022-2030 (MILLONES DE USD) 73
          1. 12.2.9.5.1 MÉXICO MERCADO METAVERSO, POR EMPRESAS, 2022-2030 (MILLONES DE USD) 73
    3. 12.3 EUROPA 74
      1. 12.3.1 EUROPA: MERCADO METAVERSO, POR PAÍS, 2022-2030 (MILLONES DE USD) 75
      2. 12.3.2 EUROPA MERCADO METAVERSO, POR COMPONENTE, 2022-2030 (MILLONES DE USD) 75
        1. 12.3.2.1 EUROPA MERCADO METAVERSO, POR HARDWARE, 2022-2030 (MILLONES DE USD) 76
      3. 12.3.3 MERCADO METAVERSO EUROPEO, POR PLATAFORMA, 2022-2030 (MILLONES DE USD) 76
      4. 12.3.4 MERCADO METAVERSO EUROPEO, POR TECNOLOGÍA, 2022-2030 (MILLONES DE USD) 77
      5. 12.3.5 MERCADO METAVERSO EUROPEO, POR APLICACIÓN, 2022-2030 (MILLONES DE USD) 78
      6. 12.3.6 MERCADO METAVERSO EUROPEO, POR USUARIO FINAL, 2022-2030 (MILLONES DE USD) 79
        1. 12.3.6.1 MERCADO METAVERSO EUROPEO, POR EMPRESAS, 2022-2030 (MILLONES DE USD) 79
      7. 12.3.7 ALEMANIA 80
        1. 12.3.7.1 MERCADO DE METAVERSO EN ALEMANIA, POR COMPONENTE, 2022-2030 (MILLONES DE USD) 80
          1. 12.3.7.1.1 MERCADO DE METAVERSO EN ALEMANIA, POR HARDWARE, 2022-2030 (MILLONES DE USD) 80
        2. 12.3.7.2 MERCADO DE METAVERSO EN ALEMANIA, POR PLATAFORMA, 2022-2030 (MILLONES DE USD) 80
        3. 12.3.7.3 MERCADO DE METAVERSO EN ALEMANIA, POR TECNOLOGÍA, 2022-2030 (MILLONES DE USD) 81
        4. 12.3.7.4 MERCADO DE METAVERSO EN ALEMANIA, POR APLICACIÓN, 2022-2030 (MILLONES DE USD) 81
        5. 12.3.7.5 MERCADO DE METAVERSO DE ALEMANIA, POR USUARIO FINAL, 2022-2030 (MILLONES DE USD) 81
          1. 12.3.7.5.1 MERCADO DE METAVERSO DE ALEMANIA, POR EMPRESAS, 2022-2030 (MILLONES DE USD) 82
      8. 12.3.8 FRANCIA 82
        1. 12.3.8.1 MERCADO DE METAVERSO DE FRANCIA, POR COMPONENTE, 2022-2030 (MILLONES DE USD) 82
          1. 12.3.8.1.1 MERCADO DE METAVERSO DE FRANCIA, POR HARDWARE, 2022-2030 (MILLONES DE USD) 83
        2. 12.3.8.2 MERCADO DE METAVERSO DE FRANCIA, POR PLATAFORMA, 2022-2030 (MILLONES DE USD) 83
        3. 12.3.8.3 MERCADO DE METAVERSO EN FRANCIA, POR TECNOLOGÍA, 2022-2030 (MILLONES DE USD) 83
        4. 12.3.8.4 MERCADO DE METAVERSO EN FRANCIA, POR APLICACIÓN, 2022-2030 (MILLONES DE USD) 84
        5. 12.3.8.5 MERCADO DE METAVERSO EN FRANCIA, POR USUARIO FINAL, 2022-2030 (MILLONES DE USD) 84
          1. 12.3.8.5.1 MERCADO DE METAVERSO EN FRANCIA, POR EMPRESAS, 2022-2030 (MILLONES DE USD) 84
      9. 12.3.9 REINO UNIDO 85
        1. 12.3.9.1 MERCADO DE METAVERSO EN REINO UNIDO, POR COMPONENTE, 2022-2030 (MILLONES DE USD) 85
          1. 12.3.9.1.1 MERCADO METAVERSO DEL REINO UNIDO, POR HARDWARE, 2022-2030 (MILLONES DE USD) 85
        2. 12.3.9.2 MERCADO METAVERSO DEL REINO UNIDO, POR PLATAFORMA, 2022-2030 (MILLONES DE USD) 85
        3. 12.3.9.3 MERCADO METAVERSO DEL REINO UNIDO, POR TECNOLOGÍA, 2022-2030 (MILLONES DE USD) 86
        4. 12.3.9.4 MERCADO METAVERSO DEL REINO UNIDO, POR APLICACIÓN, 2022-2030 (MILLONES DE USD) 86
        5. 12.3.9.5 MERCADO METAVERSO DEL REINO UNIDO, POR USUARIO FINAL, 2022-2030 (MILLONES DE USD) 86
          1. 12.3.9.5.1 MERCADO METAVERSO DEL REINO UNIDO, POR EMPRESAS, 2022-2030 (MILLONES DE USD) 87
      10. 12.3.10 RESTO DE EUROPA 87
        1. 12.3.10.1 RESTO DE EUROPA MERCADO METAVERSO, POR COMPONENTE, 2022-2030 (MILLONES DE USD) 87
          1. 12.3.10.1.1 RESTO DE EUROPA MERCADO METAVERSO, POR HARDWARE, 2022-2030 (MILLONES DE USD) 88
        2. 12.3.10.2 RESTO DE EUROPA MERCADO METAVERSO, POR PLATAFORMA, 2022-2030 (MILLONES DE USD) 88
        3. 12.3.10.3 RESTO DE EUROPA MERCADO METAVERSO, POR TECNOLOGÍA, 2022-2030 (MILLONES DE USD) 88
        4. 12.3.10.4 RESTO DE EUROPA: MERCADO DE METAVERSO, POR APLICACIÓN, 2022-2030 (MILLONES DE USD) 89
        5. 12.3.10.5 RESTO DE EUROPA: MERCADO DE METAVERSO, POR USUARIO FINAL, 2022-2030 (MILLONES DE USD) 89
          1. 12.3.10.5.1 RESTO DE EUROPA: MERCADO DE METAVERSO, POR EMPRESAS, 2022-2030 (MILLONES DE USD) 89
    4. ?
    5. 12.4 ASIA-PACÍFICO 90
      1. 12.4.1 ASIA-PACÍFICO: MERCADO DE METAVERSO, POR PAÍS, 2022-2030 (MILLONES DE USD) 91
      2. 12.4.2 ASIA-PACÍFICO: MERCADO DE METAVERSO, POR COMPONENTE, 2022–2030 (USD MILLONES) 91
        1. 12.4.2.1 MERCADO DE METAVERSO DE ASIA-PACÍFICO, POR HARDWARE, 2022–2030 (USD MILLONES) 92
      3. 12.4.3 MERCADO DE METAVERSO DE ASIA-PACÍFICO, POR PLATAFORMA, 2022–2030 (USD MILLONES) 92
      4. 12.4.4 MERCADO DE METAVERSO DE ASIA-PACÍFICO, POR TECNOLOGÍA, 2022–2030 (USD MILLONES) 93
      5. 12.4.5 MERCADO DE METAVERSO DE ASIA-PACÍFICO, POR APLICACIÓN, 2022–2030 (USD MILLONES) 94
      6. 12.4.6 MERCADO DE METAVERSO DE ASIA-PACÍFICO, POR USUARIO FINAL, 2022–2030 (USD MILLONES) 95
        1. 12.4.6.1 MERCADO DE METAVERSO DE ASIA-PACÍFICO, POR EMPRESAS, 2022-2030 (MILLONES DE USD) 95
      7. 12.4.7 CHINA 96
        1. 12.4.7.1 MERCADO DE METAVERSO DE CHINA, POR COMPONENTE, 2022-2030 (MILLONES DE USD) 96
          1. 12.4.7.1.1 MERCADO DE METAVERSO DE CHINA, POR HARDWARE, 2022-2030 (MILLONES DE USD) 96
        2. 12.4.7.2 MERCADO DE METAVERSO DE CHINA, POR PLATAFORMA, 2022-2030 (MILLONES DE USD) 96
        3. 12.4.7.3 MERCADO DE METAVERSO DE CHINA, POR TECNOLOGÍA, 2022-2030 (USD MILLONES) 97
        4. 12.4.7.4 MERCADO DE METAVERSO DE CHINA, POR APLICACIÓN, 2022-2030 (USD MILLONES) 97
        5. 12.4.7.5 MERCADO DE METAVERSO DE CHINA, POR USUARIO FINAL, 2022-2030 (USD MILLONES) 97
          1. 12.4.7.5.1 MERCADO DE METAVERSO DE CHINA, POR EMPRESAS, 2022-2030 (USD MILLONES) 98
      8. 12.4.8 INDIA 98
        1. 12.4.8.1 MERCADO DE METAVERSO DE INDIA, POR COMPONENTE, 2022-2030 (USD MILLONES) 98
          1. 12.4.8.1.1 MERCADO DE METAVERSO DE INDIA, POR HARDWARE, 2022-2030 (USD MILLONES) 99
        2. 12.4.8.2 MERCADO DE METAVERSO DE INDIA, POR PLATAFORMA, 2022-2030 (MILLONES DE USD) 99
        3. 12.4.8.3 MERCADO DE METAVERSO DE INDIA, POR TECNOLOGÍA, 2022-2030 (MILLONES DE USD) 99
        4. 12.4.8.4 MERCADO DE METAVERSO DE INDIA, POR APLICACIÓN, 2022-2030 (MILLONES DE USD) 100
        5. 12.4.8.5 MERCADO DE METAVERSO DE INDIA, POR USUARIO FINAL, 2022-2030 (MILLONES DE USD) 100
          1. 12.4.8.5.1 MERCADO DE METAVERSO DE INDIA, POR EMPRESAS, 2022-2030 (MILLONES DE USD) 100
      9. 12.4.9 JAPÓN 101
        1. 12.4.9.1 MERCADO DE METAVERSO EN JAPÓN, POR COMPONENTE, 2022-2030 (MILLONES DE USD) 101
          1. 12.4.9.1.1 MERCADO DE METAVERSO EN JAPÓN, POR HARDWARE, 2022-2030 (MILLONES DE USD) 101
        2. 12.4.9.2 MERCADO DE METAVERSO EN JAPÓN, POR PLATAFORMA, 2022-2030 (MILLONES DE USD) 101
        3. 12.4.9.3 MERCADO DE METAVERSO EN JAPÓN, POR TECNOLOGÍA, 2022-2030 (MILLONES DE USD) 102
        4. 12.4.9.4 MERCADO DE METAVERSO EN JAPÓN, POR APLICACIÓN, 2022-2030 (MILLONES DE USD) 102
        5. 12.4.9.5 MERCADO METAVERSO DE JAPÓN, POR USUARIO FINAL, 2022-2030 (MILLONES DE USD) 102
          1. 12.4.9.5.1 MERCADO METAVERSO DE JAPÓN, POR EMPRESAS, 2022-2030 (MILLONES DE USD) 103
      10. 12.4.10 RESTO DE ASIA-PACÍFICO 103
        1. 12.4.10.1 RESTO DEL MERCADO METAVERSO DE ASIA-PACÍFICO, POR COMPONENTE, 2022-2030 (MILLONES DE USD) 103
          1. 12.4.10.1.1 RESTO DEL MERCADO METAVERSO DE ASIA-PACÍFICO, POR HARDWARE, 2022-2030 (MILLONES DE USD) 104
        2. 12.4.10.2 RESTO DE MERCADO DE METAVERSO DE ASIA-PACÍFICO, POR PLATAFORMA, 2022-2030 (MILLONES DE USD) 104
        3. 12.4.10.3 RESTO DEL MERCADO DE METAVERSO DE ASIA-PACÍFICO, POR TECNOLOGÍA, 2022-2030 (MILLONES DE USD) 104
        4. 12.4.10.4 RESTO DEL MERCADO DE METAVERSO DE ASIA-PACÍFICO, POR APLICACIÓN, 2022-2030 (MILLONES DE USD) 105
        5. 12.4.10.5 RESTO DEL MERCADO DE METAVERSO DE ASIA-PACÍFICO, POR USUARIO FINAL, 2022-2030 (MILLONES DE USD) 105
          1. 12.4.10.5.1 RESTO DEL MERCADO DE METAVERSO DE ASIA-PACÍFICO, POR EMPRESAS, 2022-2030 (MILLONES DE USD) MILLONES) 105
    6. ?
    7. ?
    8. 12.5 ORIENTE MEDIO Y ÁFRICA 106
      1. 12.5.1 MERCADO METAVERSO DE ORIENTE MEDIO Y ÁFRICA, POR COMPONENTE, 2022-2030 (MILLONES DE USD) 106
        1. 12.5.1.1 MERCADO METAVERSO DE ORIENTE MEDIO Y ÁFRICA, POR HARDWARE, 2022-2030 (MILLONES DE USD) 107
      2. 12.5.2 MERCADO METAVERSO DE ORIENTE MEDIO Y ÁFRICA, POR PLATAFORMA, 2022-2030 (MILLONES DE USD) 107
      3. 12.5.3 ORIENTE MEDIO Y MERCADO METAVERSO DE ÁFRICA, POR TECNOLOGÍA, 2022-2030 (MILLONES DE USD) 108
      4. 12.5.4 MERCADO METAVERSO DE ORIENTE MEDIO Y ÁFRICA, POR APLICACIÓN, 2022-2030 (MILLONES DE USD) 109
      5. 12.5.5 MERCADO METAVERSO DE ORIENTE MEDIO Y ÁFRICA, POR USUARIO FINAL, 2022-2030 (MILLONES DE USD) 110
        1. 12.5.5.1 ORIENTE MEDIO Y MERCADO DE METAVERSE EN ÁFRICA, POR EMPRESAS, 2022-2030 (MILLONES DE USD) 110
    9. 12.6 SUDAMÉRICA 111
      1. 12.6.1 MERCADO DE METAVERSE EN SUDAMÉRICA, POR COMPONENTE, 2022-2030 (MILLONES DE USD) 111
        1. 12.6.1.1 MERCADO DE METAVERSE EN SUDAMÉRICA, POR HARDWARE, 2022-2030 (MILLONES DE USD) 112
      2. 12.6.2 MERCADO DE METAVERSE EN SUDAMÉRICA, POR PLATAFORMA, 2022-2030 (MILLONES DE USD) 112
      3. 12.6.3 MERCADO DE METAVERSE EN SUDAMÉRICA, POR TECNOLOGÍA, 2022-2030 (MILLONES DE USD) 113
      4. 12.6.4 MERCADO METAVERSO DE SUDAMÉRICA, POR APLICACIÓN, 2022-2030 (MILLONES DE USD) 114
      5. 12.6.5 MERCADO METAVERSO DE SUDAMÉRICA, POR USUARIO FINAL, 2022-2030 (MILLONES DE USD) 115
        1. 12.6.5.1 MERCADO METAVERSO DE SUDAMÉRICA, POR EMPRESAS, 2022-2030 (MILLONES DE USD) 115
  13. 13 PANORAMA COMPETITIVO 116
    1. 13.1 REFERENCIA COMPETITIVA 116
    2. 13.2 LAS POLÍTICAS NACIONALES ESPECÍFICAS 117
    3. 13.3 LAS DIRECTRICES ESPECÍFICAS DE LAS ORGANIZACIONES INTERNACIONALES 118
    4. 13.4 RECIENTES DESARROLLOS 120
      1. 13.4.1 ASOCIACIONES/ACUERDOS/CONTRATOS/COLABORACIONES 120
      2. 13.4.2 EXPANSIONES/ADQUISICIONES EMPRESARIALES 121
      3. 13.4.3 LANZAMIENTOS/DESARROLLOS DE PRODUCTOS 121
  14. 14 PERFILES DE EMPRESAS 123
    1. 14.1 META PLATFORMS, INC. 123
      1. 14.1.1 DESCRIPCIÓN GENERAL DE LA EMPRESA 123
      2. 14.1.2 DESCRIPCIÓN GENERAL FINANCIERA 124
      3. 14.1.3 PRODUCTOS/SOLUCIONES/SERVICIOS OFRECIDOS 124
      4. 14.1.4 DESARROLLOS CLAVE 125
      5. 14.1.5 ANÁLISIS FODA 125
      6. 14.1.6 CLAVE ESTRATEGIAS 125
    2. ?
    3. 14.2 NVIDIA 126
      1. 14.2.1 RESEÑA DE LA EMPRESA 126
      2. 14.2.2 RESEÑA FINANCIERA 127
      3. 14.2.3 ANÁLISIS FODA 127
      4. 14.2.4 DESARROLLOS CLAVE 128
      5. 14.2.5 ANÁLISIS FODA 128
      6. 14.2.6 ESTRATEGIAS CLAVE 128
    4. 14.3 MICROSOFT CORPORATION 129
      1. 14.3.1 RESEÑA DE LA EMPRESA 129
      2. 14.3.2 RESEÑA FINANCIERA 130
      3. 14.3.3 PRODUCTOS OFRECIDOS 130
      4. 14.3.4 DESARROLLOS CLAVE 131
      5. 14.3.5 MICROSOFT CORPORATION: ANÁLISIS FODA 131
      6. 14.3.6 ESTRATEGIAS CLAVE 131
    5. 14.4 TENCENT HOLDINGS LTD 132
      1. 14.4.1 DESCRIPCIÓN GENERAL DE LA EMPRESA 132
      2. 14.4.2 DESCRIPCIÓN FINANCIERA 133
      3. 14.4.3 PRODUCTOS OFRECIDOS 133
      4. 14.4.4 DESARROLLOS CLAVE 134
      5. 14.4.5 ANÁLISIS FODA 134
      6. 14.4.6 ESTRATEGIAS CLAVE 134
    6. 14.5 BYTEDANCE 135
      1. 14.5.1 DESCRIPCIÓN GENERAL DE LA EMPRESA 135
      2. 14.5.2 DESCRIPCIÓN FINANCIERA 135
      3. 14.5.3 PRODUCTOS OFRECIDOS 135
      4. 14.5.4 DESARROLLOS CLAVE 135
      5. 14.5.5 ANÁLISIS FODA 136
      6. 14.5.6 ESTRATEGIAS CLAVE 136
    7. 14.6 EPIC GAMES 137
      1. 14.6.1 DESCRIPCIÓN GENERAL DE LA EMPRESA 137
      2. 14.6.2 DESCRIPCIÓN GENERAL FINANCIERA 137
      3. 14.6.3 PRODUCTOS OFRECIDOS 137
      4. 14.6.4 DESARROLLOS CLAVE 137
      5. 14.6.5 ANÁLISIS FODA 138
      6. 14.6.6 ESTRATEGIAS CLAVE 138
    8. ?
    9. 14.7 NETEASE INC. 139
      1. 14.7.1 DESCRIPCIÓN GENERAL DE LA EMPRESA 139
      2. 14.7.2 DESCRIPCIÓN GENERAL FINANCIERA 140
      3. 14.7.3 PRODUCTOS OFRECIDOS 140
      4. 14.7.4 DESARROLLOS CLAVE 140
      5. 14.7.5 ANÁLISIS FODA 141
      6. 14.7.6 ESTRATEGIAS CLAVE 141
    10. 14.8 ROBLOX CORPORATION 142
      1. 14.8.1 DESCRIPCIÓN GENERAL DE LA EMPRESA 142
      2. 14.8.2 DESCRIPCIÓN GENERAL FINANCIERA 142
      3. 14.8.3 PRODUCTOS/SERVICIOS/SOLUCIONES OFRECIDOS 143
      4. 14.8.4 DESARROLLOS CLAVE 143
      5. 14.8.5 ANÁLISIS FODA 143
      6. 14.8.6 ESTRATEGIAS CLAVE ESTRATEGIAS 143
    11. 14.9 LILITH GAMES 144
      1. 14.9.1 RESEÑA DE LA EMPRESA 144
      2. 14.9.2 RESEÑA FINANCIERA 144
      3. 14.9.3 PRODUCTOS OFRECIDOS 144
      4. 14.9.4 DESARROLLOS CLAVE 144
    12. 14.10 NEXTECH AR SOLUTIONS INC. 145
      1. 14.10.1 RESEÑA DE LA EMPRESA 145
      2. 14.10.2 RESEÑA FINANCIERA 145
      3. 14.10.3 PRODUCTOS OFRECIDOS 146
      4. 14.10.4 DESARROLLOS CLAVE 146
      5. 14.10.5 ANÁLISIS FODA 147
      6. 14.10.6 ESTRATEGIAS CLAVE 147
    13. 14.11 UNITY SOFTWARE INC. 148
      1. 14.11.1 RESEÑA DE LA EMPRESA 148
      2. 14.11.2 RESEÑA FINANCIERA 148
      3. 14.11.3 PRODUCTOS OFRECIDOS 149
      4. 14.11.4 DESARROLLOS CLAVE 149
      5. 14.11.5 ANÁLISIS FODA 149
      6. 14.11.6 ESTRATEGIAS CLAVE 150
    14. ?
    15. LISTA DE TABLAS
    16. TABLA 1 SINOPSIS DEL MERCADO 20
    17. TABLA 2 LA DIVISIÓN DE LA ETAPA DE DESARROLLO DEL METAVERSO 40
    18. TABLA 3 INVERSIONES GLOBALES EN METAVERSO POR REGIÓN, 2021-2025 (MILLONES DE USD) 40
    19. TABLA 4 MERCADO METAVERSO GLOBAL, POR COMPONENTE, 2022-2030 (MILLONES DE USD) 43
    20. TABLA 5 MERCADO METAVERSO GLOBAL, POR HARDWARE, 2022-2030 (MILLONES DE USD) 43
    21. TABLA 6 MERCADO METAVERSO GLOBAL, POR PLATAFORMA, 2022-2030 (MILLONES DE USD) 46
    22. TABLA 7 MERCADO METAVERSO GLOBAL, POR TECNOLOGÍA, 2022-2030 (MILLONES DE USD) 48
    23. TABLA 8 MERCADO METAVERSO GLOBAL, POR APLICACIÓN, 2022-2030 (MILLONES DE USD) 51
    24. TABLA 9 MERCADO METAVERSO GLOBAL, POR USUARIO FINAL, 2022-2030 (MILLONES DE USD) 54
    25. TABLA 10 MERCADO METAVERSO GLOBAL, POR EMPRESAS, 2022-2030 (MILLONES DE USD) 55
    26. TABLA 11 MERCADO METAVERSO GLOBAL, POR REGIÓN, 2022-2030 (MILLONES DE USD) 59
    27. TABLA 12 MERCADO METAVERSO DE AMÉRICA DEL NORTE, POR PAÍS, 2022-2030 (MILLONES DE USD) 61
    28. TABLA 13 MERCADO METAVERSO DE AMÉRICA DEL NORTE, POR COMPONENTE, 2022-2030 (MILLONES DE USD) 61
    29. TABLA 14 MERCADO METAVERSO DE AMÉRICA DEL NORTE, POR HARDWARE, 2022-2030 (MILLONES DE USD) 62
    30. TABLA 15 MERCADO METAVERSO DE AMÉRICA DEL NORTE, POR PLATAFORMA, 2022–2030 (USD MILLONES) 62
    31. TABLA 16 MERCADO DE METAVERSO DE AMÉRICA DEL NORTE, POR TECNOLOGÍA, 2022–2030 (USD MILLONES) 63
    32. TABLA 17 MERCADO DE METAVERSO DE AMÉRICA DEL NORTE, POR APLICACIÓN, 2022–2030 (USD MILLONES) 64
    33. TABLA 18 MERCADO DE METAVERSO DE AMÉRICA DEL NORTE, POR USUARIO FINAL, 2022–2030 (USD MILLONES) 65
    34. TABLA 19 MERCADO DE METAVERSO DE AMÉRICA DEL NORTE, POR EMPRESAS, 2022–2030 (USD MILLONES) 66
    35. TABLA 20 MERCADO DE METAVERSO DE EE. UU., POR COMPONENTE, 2022–2030 (USD MILLONES) 66
    36. TABLA 21 EE. UU. MERCADO DE METAVERSE, POR HARDWARE, 2022-2030 (MILLONES DE USD) 67
    37. TABLA 22 MERCADO DE METAVERSE DE EE. UU., POR PLATAFORMA, 2022-2030 (MILLONES DE USD) 67
    38. TABLA 23 MERCADO DE METAVERSE DE EE. UU., POR TECNOLOGÍA, 2022-2030 (MILLONES DE USD) 67
    39. TABLA 24 MERCADO DE METAVERSE DE EE. UU., POR APLICACIÓN, 2022-2030 (MILLONES DE USD) 68
    40. TABLA 25 MERCADO DE METAVERSE DE EE. UU., POR USUARIO FINAL, 2022-2030 (MILLONES DE USD) 68
    41. TABLA 26 MERCADO DE METAVERSE DE EE. UU., POR EMPRESAS, 2022-2030 (MILLONES DE USD) 68
    42. TABLA 27 METAVERSE DE CANADÁ MERCADO, POR COMPONENTE, 2022-2030 (MILLONES DE USD) 69
    43. TABLA 28 MERCADO DE METAVERSE DE CANADÁ, POR HARDWARE, 2022-2030 (MILLONES DE USD) 69
    44. TABLA 29 MERCADO DE METAVERSE DE CANADÁ, POR PLATAFORMA, 2022-2030 (MILLONES DE USD) 69
    45. TABLA 30 MERCADO DE METAVERSE DE CANADÁ, POR TECNOLOGÍA, 2022-2030 (MILLONES DE USD) 70
    46. TABLA 31 MERCADO DE METAVERSE DE CANADÁ, POR APLICACIÓN, 2022-2030 (MILLONES DE USD) 70
    47. TABLA 32 MERCADO DE METAVERSE DE CANADÁ, POR USUARIO FINAL, 2022-2030 (MILLONES DE USD) 70
    48. TABLA 33 METAVERSE DE CANADÁ MERCADO, POR EMPRESAS, 2022-2030 (USD MILLONES) 71
    49. TABLA 34 MERCADO METAVERSO DE MÉXICO, POR COMPONENTE, 2022-2030 (USD MILLONES) 71
    50. TABLA 35 MERCADO METAVERSO DE MÉXICO, POR HARDWARE, 2022-2030 (USD MILLONES) 72
    51. TABLA 36 MERCADO METAVERSO DE MÉXICO, POR PLATAFORMA, 2022-2030 (USD MILLONES) 72
    52. TABLA 37 MERCADO METAVERSO DE MÉXICO, POR TECNOLOGÍA, 2022-2030 (USD MILLONES) 72
    53. TABLA 38 MERCADO METAVERSO DE MÉXICO, POR APLICACIÓN, 2022-2030 (USD MILLONES) 73
    54. TABLA 39 MÉXICO MERCADO DE METAVERSE, POR USUARIO FINAL, 2022-2030 (MILLONES DE USD) 73
    55. TABLA 40 MERCADO DE METAVERSE EN MÉXICO, POR EMPRESAS, 2022-2030 (MILLONES DE USD) 73
    56. TABLA 41 MERCADO DE METAVERSE EN EUROPA, POR PAÍS, 2022-2030 (MILLONES DE USD) 75
    57. TABLA 42 MERCADO DE METAVERSE EN EUROPA, POR COMPONENTE, 2022-2030 (MILLONES DE USD) 75
    58. TABLA 43 MERCADO DE METAVERSE EN EUROPA, POR HARDWARE, 2022-2030 (MILLONES DE USD) 76
    59. TABLA 44 MERCADO DE METAVERSE EN EUROPA, POR PLATAFORMA, 2022-2030 (MILLONES DE USD) 76
    60. TABLA 45 EUROPA MERCADO DE METAVERSE, POR TECNOLOGÍA, 2022-2030 (MILLONES DE USD) 77
    61. TABLA 46 MERCADO DE METAVERSE EN EUROPA, POR APLICACIÓN, 2022-2030 (MILLONES DE USD) 78
    62. TABLA 47 MERCADO DE METAVERSE EN EUROPA, POR USUARIO FINAL, 2022-2030 (MILLONES DE USD) 79
    63. TABLA 48 MERCADO DE METAVERSE EN EUROPA, POR EMPRESAS, 2022-2030 (MILLONES DE USD) 79
    64. TABLA 49 MERCADO DE METAVERSE EN ALEMANIA, POR COMPONENTE, 2022-2030 (MILLONES DE USD) 80
    65. TABLA 50 MERCADO DE METAVERSE EN ALEMANIA, POR HARDWARE, 2022-2030 (MILLONES DE USD) 80
    66. TABLA 51 MERCADO DE METAVERSE EN ALEMANIA, POR PLATAFORMA, 2022-2030 (MILLONES DE USD) 80
    67. TABLA 52 MERCADO DE METAVERSE EN ALEMANIA, POR TECNOLOGÍA, 2022-2030 (MILLONES DE USD) 81
    68. TABLA 53 MERCADO DE METAVERSE EN ALEMANIA, POR APLICACIÓN, 2022-2030 (MILLONES DE USD) 81
    69. TABLA 54 MERCADO DE METAVERSE EN ALEMANIA, POR USUARIO FINAL, 2022-2030 (MILLONES DE USD) 81
    70. TABLA 55 MERCADO DE METAVERSE EN ALEMANIA, POR EMPRESAS, 2022-2030 (MILLONES DE USD) 82
    71. TABLA 56 MERCADO DE METAVERSE EN FRANCIA, POR COMPONENTE, 2022-2030 (MILLONES DE USD) 82
    72. TABLA 57 MERCADO DE METAVERSE EN FRANCIA, POR HARDWARE, 2022-2030 (MILLONES DE USD) 83
    73. TABLA 58 MERCADO DE METAVERSE EN FRANCIA, POR PLATAFORMA, 2022-2030 (MILLONES DE USD) 83
    74. TABLA 59 MERCADO DE METAVERSE EN FRANCIA, POR TECNOLOGÍA, 2022-2030 (MILLONES DE USD) 83
    75. TABLA 60 MERCADO DE METAVERSE EN FRANCIA, POR APLICACIÓN, 2022-2030 (MILLONES DE USD) 84
    76. TABLA 61 MERCADO DE METAVERSE EN FRANCIA, POR USUARIO FINAL, 2022-2030 (MILLONES DE USD) 84
    77. TABLA 62 MERCADO DE METAVERSE EN FRANCIA, POR EMPRESAS, 2022-2030 (MILLONES DE USD) 84
    78. TABLA 63 MERCADO DE METAVERSE EN EL REINO UNIDO, POR COMPONENTE, 2022-2030 (MILLONES DE USD) 85
    79. TABLA 64 MERCADO DE METAVERSE EN EL REINO UNIDO, POR HARDWARE, 2022-2030 (MILLONES DE USD) 85
    80. TABLA 65 MERCADO DE METAVERSE EN EL REINO UNIDO, POR PLATAFORMA, 2022-2030 (MILLONES DE USD) 85
    81. TABLA 66 MERCADO DE METAVERSE EN EL REINO UNIDO, POR TECNOLOGÍA, 2022-2030 (MILLONES DE USD) 86
    82. TABLA 67 MERCADO DE METAVERSE EN EL REINO UNIDO, POR APLICACIÓN, 2022-2030 (MILLONES DE USD) 86
    83. TABLA 68 MERCADO DE METAVERSE EN EL REINO UNIDO, POR USUARIO FINAL, 2022-2030 (MILLONES DE USD) 86
    84. TABLA 69 METAVERSE EN EL REINO UNIDO MERCADO, POR EMPRESAS, 2022-2030 (MILLONES DE USD) 87
    85. TABLA 70 MERCADO DE METAVERSO DEL RESTO DE EUROPA, POR COMPONENTE, 2022-2030 (MILLONES DE USD) 87
    86. TABLA 71 MERCADO DE METAVERSO DEL RESTO DE EUROPA, POR HARDWARE, 2022-2030 (MILLONES DE USD) 88
    87. TABLA 72 MERCADO DE METAVERSO DEL RESTO DE EUROPA, POR PLATAFORMA, 2022-2030 (MILLONES DE USD) 88
    88. TABLA 73 MERCADO DE METAVERSO DEL RESTO DE EUROPA, POR TECNOLOGÍA, 2022-2030 (MILLONES DE USD) 88
    89. TABLA 74 MERCADO DE METAVERSO DEL RESTO DE EUROPA, POR APLICACIÓN, 2022-2030 (MILLONES DE USD) 89
    90. TABLA 75 MERCADO DE METAVERSO DEL RESTO DE EUROPA, POR USUARIO FINAL, 2022-2030 (MILLONES DE USD) 89
    91. TABLA 76 MERCADO DE METAVERSO DEL RESTO DE EUROPA, POR EMPRESAS, 2022-2030 (MILLONES DE USD) 89
    92. TABLA 77 MERCADO DE METAVERSO DE ASIA-PACÍFICO, POR PAÍS, 2022-2030 (MILLONES DE USD) 91
    93. TABLA 78 MERCADO DE METAVERSO DE ASIA-PACÍFICO, POR COMPONENTE, 2022-2030 (MILLONES DE USD) 91
    94. TABLA 79 MERCADO DE METAVERSO DE ASIA-PACÍFICO, POR HARDWARE, 2022-2030 (MILLONES DE USD) 92
    95. TABLA 80 MERCADO DE METAVERSO DE ASIA-PACÍFICO, POR PLATAFORMA, 2022–2030 (USD MILLONES) 92
    96. TABLA 81 MERCADO DE METAVERSO DE ASIA-PACÍFICO, POR TECNOLOGÍA, 2022–2030 (USD MILLONES) 93
    97. TABLA 82 MERCADO DE METAVERSO DE ASIA-PACÍFICO, POR APLICACIÓN, 2022–2030 (USD MILLONES) 94
    98. TABLA 83 MERCADO DE METAVERSO DE ASIA-PACÍFICO, POR USUARIO FINAL, 2022–2030 (USD MILLONES) 95
    99. TABLA 84 MERCADO DE METAVERSO DE ASIA-PACÍFICO, POR EMPRESAS, 2022–2030 (USD MILLONES) 95
    100. TABLA 85 MERCADO DE METAVERSO DE CHINA, POR COMPONENTE, 2022–2030 (USD MILLONES) 96
    101. TABLA 86 CHINA MERCADO DE METAVERSO, POR HARDWARE, 2022-2030 (MILLONES DE USD) 96
    102. TABLA 87 MERCADO DE METAVERSO EN CHINA, POR PLATAFORMA, 2022-2030 (MILLONES DE USD) 96
    103. TABLA 88 MERCADO DE METAVERSO EN CHINA, POR TECNOLOGÍA, 2022-2030 (MILLONES DE USD) 97
    104. TABLA 89 MERCADO DE METAVERSO EN CHINA, POR APLICACIÓN, 2022-2030 (MILLONES DE USD) 97
    105. TABLA 90 MERCADO DE METAVERSO EN CHINA, POR USUARIO FINAL, 2022-2030 (MILLONES DE USD) 97
    106. TABLA 91 MERCADO DE METAVERSO EN CHINA, POR EMPRESAS, 2022-2030 (MILLONES DE USD) 98
    107. TABLA 92 INDIA MERCADO DE METAVERSE, POR COMPONENTE, 2022-2030 (MILLONES DE USD) 98
    108. TABLA 93 MERCADO DE METAVERSE EN INDIA, POR HARDWARE, 2022-2030 (MILLONES DE USD) 99
    109. TABLA 94 MERCADO DE METAVERSE EN INDIA, POR PLATAFORMA, 2022-2030 (MILLONES DE USD) 99
    110. TABLA 95 MERCADO DE METAVERSE EN INDIA, POR TECNOLOGÍA, 2022-2030 (MILLONES DE USD) 99
    111. TABLA 96 MERCADO DE METAVERSE EN INDIA, POR APLICACIÓN, 2022-2030 (MILLONES DE USD) 100
    112. TABLA 97 MERCADO DE METAVERSE EN INDIA, POR USUARIO FINAL, 2022-2030 (MILLONES DE USD) 100
    113. TABLA 98 INDIA MERCADO DE METAVERSE, POR EMPRESAS, 2022-2030 (MILLONES DE USD) 100
    114. TABLA 99 MERCADO DE METAVERSE EN JAPÓN, POR COMPONENTE, 2022-2030 (MILLONES DE USD) 101
    115. TABLA 100 MERCADO DE METAVERSE EN JAPÓN, POR HARDWARE, 2022-2030 (MILLONES DE USD) 101
    116. TABLA 101 MERCADO DE METAVERSE EN JAPÓN, POR PLATAFORMA, 2022-2030 (MILLONES DE USD) 101
    117. TABLA 102 MERCADO DE METAVERSE EN JAPÓN, POR TECNOLOGÍA, 2022-2030 (MILLONES DE USD) 102
    118. TABLA 103 MERCADO DE METAVERSE EN JAPÓN, POR APLICACIÓN, 2022-2030 (MILLONES DE USD) 102
    119. TABLA 104 MERCADO METAVERSO DE JAPÓN, POR USUARIO FINAL, 2022-2030 (MILLONES DE USD) 102
    120. TABLA 105 MERCADO METAVERSO DE JAPÓN, POR EMPRESAS, 2022-2030 (MILLONES DE USD) 103
    121. TABLA 106 RESTO DEL MERCADO METAVERSO DE ASIA-PACÍFICO, POR COMPONENTE, 2022-2030 (MILLONES DE USD) 103
    122. TABLA 107 RESTO DEL MERCADO METAVERSO DE ASIA-PACÍFICO, POR HARDWARE, 2022-2030 (MILLONES DE USD) 104
    123. TABLA 108 RESTO DEL MERCADO METAVERSO DE ASIA-PACÍFICO, POR PLATAFORMA, 2022-2030 (MILLONES DE USD) 104
    124. TABLA 109 RESTO DE MERCADO DE METAVERSO DE ASIA-PACÍFICO, POR TECNOLOGÍA, 2022-2030 (MILLONES DE USD) 104
    125. TABLA 110 RESTO DEL MERCADO DE METAVERSO DE ASIA-PACÍFICO, POR APLICACIÓN, 2022-2030 (MILLONES DE USD) 105
    126. TABLA 111 RESTO DEL MERCADO DE METAVERSO DE ASIA-PACÍFICO, POR USUARIO FINAL, 2022-2030 (MILLONES DE USD) 105
    127. TABLA 112 RESTO DEL MERCADO DE METAVERSO DE ASIA-PACÍFICO, POR EMPRESAS, 2022-2030 (MILLONES DE USD) 105
    128. TABLA 113 ORIENTE MEDIO Y MERCADO METAVERSO DE ÁFRICA, POR COMPONENTE, 2022-2030 (MILLONES DE USD) 106
    129. TABLA 114 MERCADO METAVERSO DE ORIENTE MEDIO Y ÁFRICA, POR HARDWARE, 2022-2030 (MILLONES DE USD) 107
    130. TABLA 115 MERCADO METAVERSO DE ORIENTE MEDIO Y ÁFRICA, POR PLATAFORMA, 2022-2030 (MILLONES DE USD) 107
    131. TABLA 116 MERCADO METAVERSO DE ORIENTE MEDIO Y ÁFRICA, POR TECNOLOGÍA, 2022-2030 (MILLONES DE USD) 108
    132. TABLA 117 MERCADO METAVERSO DE ORIENTE MEDIO Y ÁFRICA, POR HARDWARE, 2022-2030 (MILLONES DE USD) 108
    133. TABLA 118 MERCADO METAVERSO DE ORIENTE MEDIO Y ÁFRICA, POR TECNOLOGÍA, 2022-2030 (MILLONES DE USD) 109
    134. TABLA 119 MERCADO METAVERSO DE ORIENTE MEDIO Y ÁFRICA, POR TECNOLOGÍA, 2022-2030 (MILLONES DE USD) 110
    135. TABLA 120 MERCADO METAVERSO DE ORIENTE MEDIO Y ÁFRICA, POR TECNOLOGÍA, 2022-2030 (MILLONES DE USD) 111 MERCADO DE METAVERSO DE ÁFRICA, POR APLICACIÓN, 2022-2030 (MILLONES DE USD) 109
    136. TABLA 118 MERCADO DE METAVERSO DE ORIENTE MEDIO Y ÁFRICA, POR USUARIO FINAL, 2022-2030 (MILLONES DE USD) 110
    137. TABLA 119 MERCADO DE METAVERSO DE ORIENTE MEDIO Y ÁFRICA, POR USUARIO FINAL, 2022-2030 (MILLONES DE USD) MERCADO DE METAVERSE EN ÁFRICA, POR EMPRESAS, 2022-2030 (MILLONES DE USD) 110
    138. TABLA 120 MERCADO DE METAVERSE EN SUDAMÉRICA, POR COMPONENTE, 2022-2030 (MILLONES DE USD) 111
    139. TABLA 121 MERCADO DE METAVERSE EN SUDAMÉRICA, POR HARDWARE, 2022-2030 (MILLONES DE USD) 112
    140. TABLA 122 MERCADO DE METAVERSE EN SUDAMÉRICA, POR PLATAFORMA, 2022-2030 (MILLONES DE USD) 112
    141. TABLA 123 MERCADO DE METAVERSE EN SUDAMÉRICA, POR TECNOLOGÍA, 2022-2030 (MILLONES DE USD) 113
    142. TABLA 124 MERCADO DE METAVERSE EN SUDAMÉRICA, POR APLICACIÓN, 2022-2030 (USD MILLONES) 114
    143. TABLA 125 MERCADO METAVERSO DE SUDAMÉRICA, POR USUARIO FINAL, 2022-2030 (USD MILLONES) 115
    144. TABLA 126 MERCADO METAVERSO DE SUDAMÉRICA, POR EMPRESAS, 2022-2030 (USD MILLONES) 115
    145. TABLA 127 POLÍTICAS NACIONALES ESPECÍFICAS 117
    146. TABLA 128 DIRECTRICES ESPECÍFICAS DE ORGANIZACIONES INTERNACIONALES 118
    147. TABLA 129 DESARROLLOS RECIENTES DE LAS EMPRESAS METAVERSO 119
    148. TABLA 130 ASOCIACIONES/ACUERDOS/CONTRATOS/COLABORACIONES 120
    149. TABLA 131 NEGOCIOS EXPANSIONES/ADQUISICIONES 121
    150. TABLA 132 LANZAMIENTOS/DESARROLLOS DE PRODUCTOS 121
    151. TABLA 133 META PLATFORMS INC.: PRODUCTOS/SOLUCIONES/SERVICIOS OFRECIDOS 124
    152. TABLA 134 META PLATFORMS INC.: DESARROLLOS CLAVE 125
    153. TABLA 135 NVIDIA: ANÁLISIS FODA 127
    154. TABLA 136 NVIDIA: DESARROLLOS CLAVE 128
    155. TABLA 137 MICROSOFT CORPORATION: PRODUCTOS OFRECIDOS 130
    156. TABLA 138 MICROSOFT CORPORATION: DESARROLLOS CLAVE 131
    157. TABLA 139 TENCENT HOLDINGS LTD.: PRODUCTOS OFRECIDOS 133
    158. TABLA 140 TENCENT HOLDINGS LTD: PRODUCTOS CLAVE DESARROLLOS 134
    159. TABLA 141 BYTEDANCE.: PRODUCTOS OFRECIDOS 135
    160. TABLA 142 BYTEDANCE.: DESARROLLOS CLAVE 135
    161. TABLA 143 EPIC GAMES: PRODUCTOS OFRECIDOS 137
    162. TABLA 144 EPIC GAMES.: DESARROLLOS CLAVE 137
    163. TABLA 145 NETEASE INC.: PRODUCTOS OFRECIDOS 140
    164. TABLA 146 ROBLOX CORPORATION.: PRODUCTOS/SERVICIOS OFRECIDOS 143
    165. TABLA 147 ROBLOX CORPORATION.: DESARROLLOS CLAVE 143
    166. TABLA 148 LILITH GAMES: PRODUCTOS OFRECIDOS 144
    167. TABLA 149 NEXTECH AR SOLUTIONS INC.: PRODUCTOS OFRECIDOS 146
    168. TABLA 150 NEXTECH AR SOLUTIONS INC.: DESARROLLOS CLAVE 146
    169. TABLA 151 UNITY SOFTWARE INC.: PRODUCTOS OFRECIDOS 149
    170. TABLA 152 UNITY SOFTWARE INC.: DESARROLLOS CLAVE 149
    171. ?
    172. LISTA DE FIGURAS
    173. FIGURA 1 ANÁLISIS DEL ATRACTIVO DEL MERCADO: MERCADO METAVERSO GLOBAL 21
    174. FIGURA 2 MERCADO METAVERSO GLOBAL: ESTRUCTURA DEL MERCADO 23
    175. FIGURA 3 ENFOQUES DE ABAJO ASCENDENTE Y DE ARRIBA HACIA ABAJO 29
    176. FIGURA 4 ANÁLISIS DE LAS CINCO FUERZAS DE PORTER DEL MERCADO METAVERSO GLOBAL 38
    177. FIGURA 5 USUARIOS METAVERSO GLOBALES, 2024-2030 (MILLONES) 41
    178. FIGURA 6 MERCADO METAVERSO GLOBAL, POR COMPONENTE, 2024 (% PARTICIPACIÓN) 42
    179. FIGURA 7 MERCADO METAVERSO GLOBAL, POR COMPONENTE, 2022 VS 2030 (USD MILLONES) 42
    180. FIGURA 8 MERCADO METAVERSO GLOBAL, POR PLATAFORMA, 2024 (% PARTICIPACIÓN) 45
    181. FIGURA 9 MERCADO METAVERSO GLOBAL, POR PLATAFORMA, 2022 VS 2030 (USD MILLONES) 45
    182. FIGURA 10 MERCADO METAVERSO GLOBAL, POR TECNOLOGÍA, 2024 (% PARTICIPACIÓN) 47
    183. FIGURA 11 MERCADO METAVERSO GLOBAL, POR TECNOLOGÍA, 2022 VS 2030 (USD MILLONES) 47
    184. FIGURA 12 MERCADO METAVERSO GLOBAL, POR APLICACIÓN, 2024 (% PARTICIPACIÓN) 50
    185. FIGURA 13 MERCADO METAVERSO GLOBAL, POR APLICACIÓN, 2022 VS 2030 (USD MILLONES) 50
    186. FIGURA 14 MERCADO METAVERSO GLOBAL, POR USUARIO FINAL, 2024 (% PARTICIPACIÓN) 53
    187. FIGURA 15 MERCADO METAVERSO GLOBAL, POR USUARIO FINAL, 2022 VS 2030 (USD MILLONES) 53
    188. FIGURA 16 MERCADO METAVERSO GLOBAL, POR EMPRESAS, 2024 (% PARTICIPACIÓN) 54
    189. FIGURA 17 MERCADO METAVERSO GLOBAL, POR EMPRESAS, 2022 VS 2030 (USD MILLONES) 55
    190. FIGURA 18 MERCADO METAVERSO GLOBAL, POR REGIÓN, 2024 (% PARTICIPACIÓN) 58
    191. FIGURA 19 MERCADO METAVERSO GLOBAL, POR REGIÓN, 2022 VS 2030 (MILLONES DE USD) 59
    192. FIGURA 20 MERCADO METAVERSO DE AMÉRICA DEL NORTE, POR

Segmentación del mercado del metaverso

Perspectiva de los componentes del metaverso (miles de millones de USD, 2018-2030)
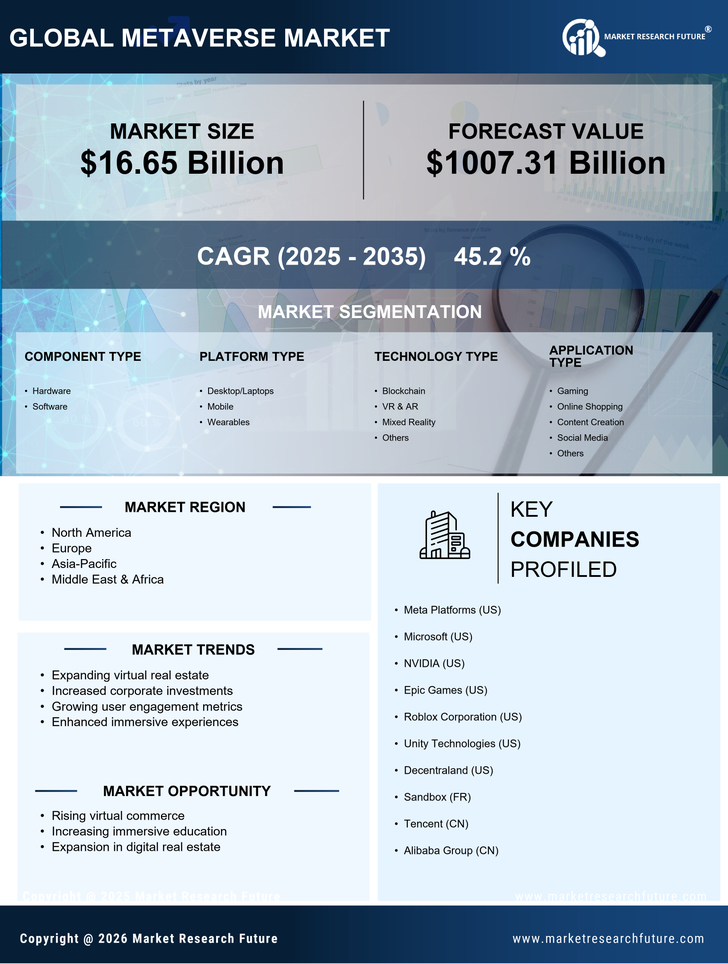
  • Hardware
  • Software

Perspectiva de la plataforma del metaverso (miles de millones de USD, 2018-2030)

  • Escritorios/portátiles
  • Móviles
  • Dispositivos portátiles

Perspectiva de la tecnología del metaverso (miles de millones de USD, 2018-2030)

  • Blockchain
  • RV y RA
  • Realidad Mixta
  • Otros

Perspectiva de Aplicaciones del Metaverso (Miles de millones de USD, 2018-2030)

  • Juegos
  • Compras en línea
  • Creación de contenido
  • Redes sociales
  • Otros

Perspectiva del usuario final del Metaverso (Miles de millones de USD, 2018-2030)

  • Consumidor
  • Empresas

Perspectiva Regional del Metaverso (Miles de millones de USD, 2018-2030)

  • Perspectiva de Norteamérica (Miles de millones de USD, 2018-2030)
    • Metaverso de Norteamérica por componente
      • Hardware
      • Software
    • Metaverso de Norteamérica por plataforma
      • Escritorios/portátiles
      • Móviles
      • Dispositivos portátiles
    • Metaverso de Norteamérica por usuario final
      • Consumidor
      • Empresas
    • Metaverso de Norteamérica por tecnología
      • Blockchain
      • RV y RA
      • Realidad Mixta
      • Otros
    • Metaverso de Norteamérica por Aplicación
      • Juegos
      • Compras en Línea
      • Creación de Contenido
      • Redes Sociales
      • Otros
    • Perspectiva de EE. UU. (Miles de millones de USD, 2018-2030)
    • Metaverso de EE. UU. por Componente
      • Hardware
      • Software
    • Metaverso de EE. UU. por Plataforma
      • Escritorios/Portátiles
      • Móviles
      • Dispositivos portátiles
    • Metaverso de EE. UU. por usuario final
      • Consumidor
      • Empresas
    • Metaverso de EE. UU. por tecnología
      • Blockchain
      • RV y RA
      • Realidad Mixta
      • Otros
    • Metaverso de EE. UU. por aplicación
      • Juegos
      • Compras en línea
      • Creación de contenido
      • Redes sociales
      • Otros
    • CANADÁPerspectiva (miles de millones de USD, 2018-2030)
    • CANADÁ Metaverso por componente
      • Hardware
      • Software
    • CANADÁ Metaverso por Plataforma
      • Escritorios/Portátiles
      • Móviles
      • Dispositivos portátiles
    • Canadá Metaverso por usuario final
      • Consumidor
      • Empresas
    • Canadá Metaverso por tecnología
      • Blockchain
      • RV y RA
      • Realidad Mixta
      • Otros
    • Canadá Metaverso por Aplicación
      • Juegos
      • Compras en Línea
      • Creación de Contenido
      • Redes Sociales
      • Otros
    • Perspectiva de Europa (Miles de Millones de USD, 2018-2030)
      • Europa Metaverso por Componente
        • Hardware
        • Software
      • Europa Metaverso por Plataforma
        • Escritorios/Portátiles
        • Móviles
        • Dispositivos portátiles
      • Metaverso europeo por usuario final
        • Consumidor
        • Empresas
      • Metaverso europeo por tecnología
        • Blockchain
        • RV y RA
        • Realidad Mixta
        • Otros
      • Metaverso Europeo por Aplicación
        • Juegos
        • Compras Online
        • Creación de Contenido
        • Redes Sociales
        • Otros
      • Alemania Perspectivas (Miles de Millones de USD, 2018-2030)
      • Metaverso Alemán por Componente
        • Hardware
        • Software
      • Metaverso Alemán por Plataforma
        • Escritorios/Portátiles
        • Móviles
        • Dispositivos portátiles
      • Metaverso de Alemania por usuario final
        • Consumidor
        • Empresas
      • Metaverso de Alemania por tecnología
        • Blockchain
        • RV y RA
        • Realidad Mixta
        • Otros
      • Metaverso de Alemania por Aplicación
        • Juegos
        • Compras en Línea
        • Creación de Contenido
        • Redes Sociales
        • Otros
      • Perspectivas de Francia (Miles de Millones de USD, 2018-2030)
      • Metaverso de Francia por Componente
        • Hardware
        • Software
      • Metaverso de Francia por Plataforma
        • Escritorios/Portátiles
        • Móviles
        • Dispositivos portátiles
      • Metaverso de Francia por usuario final
        • Consumidor
        • Empresas
      • Metaverso de Francia por tecnología
        • Blockchain
        • RV y RA
        • Realidad Mixta
        • Otros
      • Metaverso de Francia por Aplicación
        • Juegos
        • Compras en Línea
        • Creación de Contenido
        • Redes Sociales
        • Otros
      • Perspectivas del Reino Unido(Miles de millones de USD, 2018-2030)
      • Metaverso del Reino Unido por Componente
        • Hardware
        • Software
      • Metaverso del Reino Unido por Plataforma
        • Escritorios/Portátiles
        • Móviles
        • Dispositivos portátiles
      • Metaverso del Reino Unido por usuario final
        • Consumidor
        • Empresas
      • Metaverso del Reino Unido por tecnología
        • Blockchain
        • RV y RA
        • Realidad Mixta
        • Otros
      • Metaverso del Reino Unido por Aplicación
        • Juegos
        • Compras en Línea
        • Creación de Contenido
        • Redes Sociales
        • Otros
      • ITALIAPerspectivas (Miles de Millones de USD, 2018-2030)
      • ITALIA Metaverso por Componente
        • Hardware
        • Software
      • ITALIA Metaverso por Plataforma
        • Escritorios/Portátiles
        • Móviles
        • Dispositivos portátiles
      • Metaverso de ITALIA por usuario final
        • Consumidor
        • Empresas
      • Metaverso de ITALIA por tecnología
        • Blockchain
        • RV y RA
        • Realidad Mixta
        • Otros
      • Metaverso ITALIA por Aplicación
        • Juegos
        • Compras en Línea
        • Creación de Contenido
        • Redes Sociales
        • Otros


  • ESPAÑAPerspectivas (miles de millones de USD, 2018-2030)
  • Metaverso de España por componente
    • Hardware
    • Software
  • Metaverso de España por plataforma
    • Escritorios/portátiles
    • Móviles
    • Wearables
  • Metaverso de España por usuario final
    • Consumidor
    • Empresas
  • Metaverso de España por tecnología
    • Blockchain
    • RV y RA
    • Realidad Mixta
    • Otros
  • Metaverso de España por Aplicación
    • Juegos
    • Compras Online
    • Creación de Contenido
    • Redes Sociales
    • Otros
  • Resto de EuropaPerspectivas (Miles de Millones de USD, 2018-2030)
  • Resto de Europa Metaverso por Componente
    • Hardware
    • Software
  • Resto de Europa Metaverso por Plataforma
    • Escritorios/Portátiles
    • Móviles
    • Dispositivos portátiles
  • RESTO DE EUROPA Metaverso por usuario final
    • Consumidor
    • Empresas
  • RESTO DE EUROPA Metaverso por tecnología
    • Blockchain
    • RV y RA
    • Realidad Mixta
    • Otros
  • RESTO DE EUROPA Metaverso por Aplicación
    • Juegos
    • Compras en Línea
    • Creación de Contenido
    • Redes Sociales
    • Otros
  • Perspectiva de Asia-Pacífico (Miles de Millones de USD, 2018-2030)
    • Metaverso de Asia-Pacífico por Componente
      • Hardware
      • Software
    • Metaverso de Asia-Pacífico por Plataforma
      • Escritorios/Portátiles
      • Móviles
      • Dispositivos portátiles
    • Metaverso de Asia-Pacífico por usuario final
      • Consumidor
      • Empresas
    • Metaverso de Asia-Pacífico por tecnología
      • Blockchain
      • RV y RA
      • Realidad Mixta
      • Otros
    • Metaverso de Asia-Pacífico por Aplicación
      • Juegos
      • Compras en Línea
      • Creación de Contenido
      • Redes Sociales
      • Otros
    • Perspectiva de China (Miles de Millones de USD, 2018-2030)
    • Metaverso de China por Componente
      • Hardware
      • Software
    • Metaverso de China por Plataforma
      • Escritorios/Portátiles
      • Móviles
      • Dispositivos portátiles
    • Metaverso de China por usuario final
      • Consumidor
      • Empresas
    • Metaverso de China por tecnología
      • Blockchain
      • RV y RA
      • Realidad Mixta
      • Otros
    • Metaverso de China por Aplicación
      • Juegos
      • Compras en Línea
      • Creación de Contenido
      • Redes Sociales
      • Otros
    • Perspectiva de Japón(Miles de millones de USD, 2018-2030)
    • Metaverso de Japón por Componente
      • Hardware
      • Software
    • Metaverso de Japón por Plataforma
      • Escritorios/Portátiles
      • Móviles
      • Dispositivos portátiles
    • Metaverso de Japón por usuario final
      • Consumidor
      • Empresas
    • Metaverso de Japón por tecnología
      • Blockchain
      • RV y RA
      • Realidad Mixta
      • Otros
    • Metaverso de Japón por Aplicación
      • Juegos
      • Compras en Línea
      • Creación de Contenido
      • Redes Sociales
      • Otros
    • Perspectiva de India(Miles de millones de USD, 2018-2030)
    • Metaverso de India por Componente
      • Hardware
      • Software
    • Metaverso de India por Plataforma
      • Escritorios/Portátiles
      • Móviles
      • Dispositivos portátiles
    • Metaverso de India por usuario final
      • Consumidor
      • Empresas
    • Metaverso de India por tecnología
      • Blockchain
      • RV y RA
      • Realidad Mixta
      • Otros
    • Metaverso de India por Aplicación
      • Juegos
      • Compras en Línea
      • Creación de Contenido
      • Redes Sociales
      • Otros
    • Perspectiva de Australia (Miles de Millones de USD, 2018-2030)
    • Metaverso de Australia por Componente
      • Hardware
      • Software
    • Metaverso de Australia por Plataforma
      • Escritorios/Portátiles
      • Móviles
      • Dispositivos portátiles
    • Metaverso australiano por usuario final
      • Consumidor
      • Empresas
    • Metaverso australiano por tecnología
      • Blockchain
      • RV y RA
      • Realidad Mixta
      • Otros
    • Metaverso de Australia por Aplicación
      • Juegos
      • Compras en Línea
      • Creación de Contenido
      • Redes Sociales
      • Otros
    • Perspectiva del Resto de Asia-Pacífico (Miles de Millones de USD, 2018-2030)
    • Metaverso del Resto de Asia-Pacífico por Componente
      • Hardware
      • Software
    • Metaverso del Resto de Asia-Pacífico por Plataforma
      • Escritorios/Portátiles
      • Móviles
      • Dispositivos portátiles
    • Resto del metaverso de Asia-Pacífico por usuario final
      • Consumidor
      • Empresas
    • Resto del metaverso de Asia-Pacífico por tecnología
      • Blockchain
      • RV y RA
      • Realidad Mixta
      • Otros
    • Metaverso del Resto de Asia Pacífico por Aplicación
      • Juegos
      • Compras en Línea
      • Creación de Contenido
      • Redes Sociales
      • Otros
    • Perspectiva del Resto del Mundo (Miles de Millones de USD, 2018-2030)
      • Metaverso del Resto del Mundo por Componente
        • Hardware
        • Software
      • Metaverso del Resto del Mundo por Plataforma
        • Escritorios/Portátiles
        • Móviles
        • Dispositivos portátiles
      • Metaverso del resto del mundo por usuario final
        • Consumidor
        • Empresas
      • Metaverso del resto del mundo por tecnología
        • Blockchain
        • RV y RA
        • Realidad Mixta
        • Otros
      • Metaverso del Resto del Mundo por Aplicación
        • Juegos
        • Compras en Línea
        • Creación de Contenido
        • Redes Sociales
        • Otros


    • Perspectivas para Oriente Medio (Miles de Millones de USD, 2018-2030)
    • Metaverso de Oriente Medio por Componente
      • Hardware
      • Software
    • Metaverso de Oriente Medio por Plataforma
      • Escritorios/Portátiles
      • Móviles
      • Dispositivos Vestibles
    • Metaverso de Oriente Medio por Usuario Final
      • Consumidor
      • Empresas
    • Metaverso de Oriente Medio por Tecnología
      • Blockchain
      • VR y RA
      • Realidad Mixta
      • Otros
    • Metaverso de Oriente Medio por Aplicación
      • Juegos
      • Compras en Línea
      • Creación de Contenido
      • Redes Sociales
      • Otros
    • Perspectiva de África(Miles de millones de USD, 2018-2030)
    • Metaverso de África por Componente
      • Hardware
      • Software
    • Metaverso de África por Plataforma
      • Escritorios/Portátiles
      • Móviles
      • Dispositivos portátiles
    • Metaverso de África por usuario final
      • Consumidor
      • Empresas
    • Metaverso de África por tecnología
      • Blockchain
      • RV y RA
      • Realidad Mixta
      • Otros
    • Metaverso de África por Aplicación
      • Juegos
      • Compras en Línea
      • Creación de Contenido
      • Redes Sociales
      • Otros
    • Perspectiva de América Latina(Miles de millones de USD, 2018-2030)
    • Metaverso de América Latina por Componente
      • Hardware
      • Software
    • Metaverso de América Latina por Plataforma
      • Escritorios/Laptops
      • Móviles
      • Wearables
    • Metaverso de Latinoamérica por Usuario Final
      • Consumidor
      • Empresas
    • Metaverso de Latinoamérica por Tecnología
      • Blockchain
      • VR y RA
      • Realidad Mixta
      • Otros
    • Metaverso en Latinoamérica por Aplicación
      • Juegos
      • Compras en Línea
      • Creación de Contenido
      • Redes Sociales
      • Otros


Compare Licence

×
Features License Type
Single User Multiuser License Enterprise User
Price $4,950 $5,950 $7,250
Maximum User Access Limit 1 User Upto 10 Users Unrestricted Access Throughout the Organization
Free Customization
Direct Access to Analyst
Deliverable Format
Platform Access
Discount on Next Purchase 10% 15% 15%
Printable Versions