

- 1 RESUMEN EJECUTIVO
-
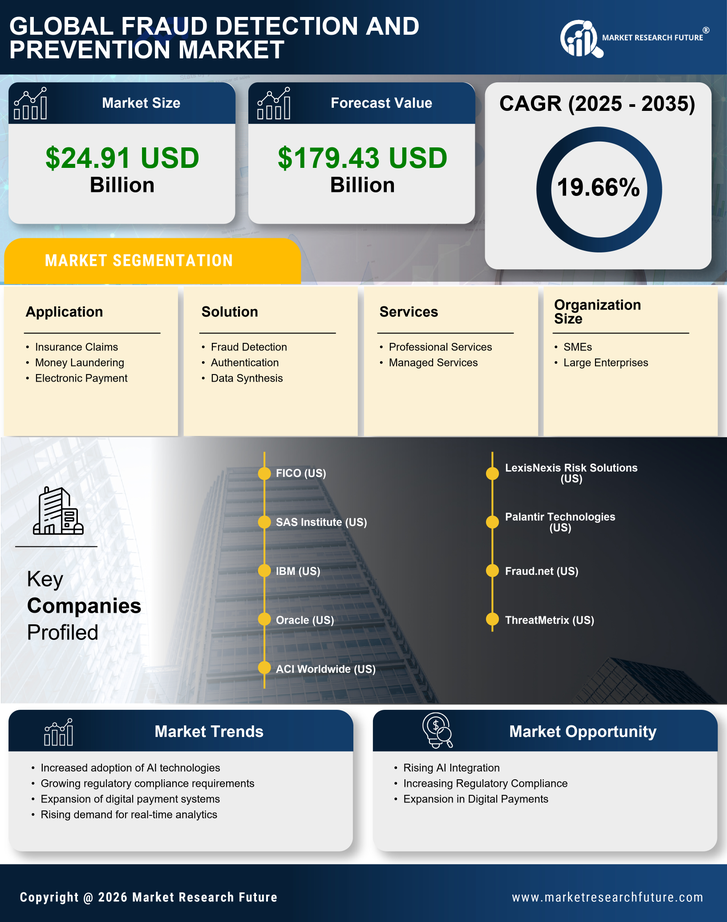
2 INTRODUCCIÓN AL MERCADO
- 2.1 Definición 21
- 2.2 Alcance del estudio 21
- 2.3 Estructura del mercado 21
- 3 Perspectivas del mercado
-
4 Metodología de la investigación
- 4.1 Proceso de investigación 26
- 4.2 Modelo de pronóstico 29
- 4.3 Lista de supuestos 30
-
5 Dinámica del mercado
- 5.1 Introducción 32
-
5.2 Impulsores 32
- 5.2.1 Crecimiento de los negocios de comercio electrónico 32
- 5.2.2 El surgimiento del análisis de big data 33
-
5.3 Restricciones 34
- 5.3.1 Alto costo de integración e implementación 34
-
5.4 Oportunidades 34
- 5.4.1 Desarrollo en aprendizaje automático 34
-
5.5 Análisis de la cadena de valor 35
- 5.5.1 Desarrolladores de software 36
- 5.5.2 Integradores 36
- 5.5.3 Proveedores de servicios/soluciones 36
- 5.5.4 Usuarios finales 36
-
5.6 Modelo de las cinco fuerzas de Porter 37
- 5.6.1 Amenaza de nuevos participantes 37
- 5.6.2 Poder de negociación de los proveedores 38
- 5.6.3 Poder de negociación de los compradores 38
- 5.6.4 Amenaza de sustitutos 38
- 5.6.5 Intensidad de la rivalidad 38
-
6 Detección global de fraude Y mercado de prevención, por solución
- 6.1 Descripción general 40
- 6.2 Detección de fraude 41
- 6.3 Autenticación 41
- 6.4 Síntesis de datos 41
-
7 Mercado global de detección y prevención de fraude, por servicio
- 7.1 Descripción general 43
- 7.2 Servicio profesional 44
- 7.3 Servicio administrado 44
-
8 Mercado global de detección y prevención de fraude, por aplicación
- 8.1 Descripción general 46
- 8.2 Reclamaciones de seguros 47
- 8.3 Lavado de dinero 47
- 8.4 Pago electrónico 47
-
9 Mercado global de detección y prevención de fraude, por tamaño de organización
- 9.1 Descripción general 49
- 9.2 Pequeñas y medianas empresas Empresas medianas (PYME) 50
- 9.3 Grandes empresas 50
-
10 Mercado global de detección y prevención de fraudes, por vertical
- 10.1 Descripción general 52
- 10.2 BFSI 54
- 10.3 Comercio minorista 54
- 10.4 Telecomunicaciones 54
- 10.5 Gobierno 54
- 10.6 Salud 54
- 10.7 Bienes raíces 55
- 10.8 Energía y electricidad 55
- 10.9 Manufactura 55
- 10.10 Viajes y transporte 55
- 10.11 Medios y Entretenimiento 55
-
11 Mercado global de detección y prevención de fraudes, por región
- 11.1 Resumen 57
-
11.2 Norteamérica 59
- 11.2.1 EE. UU. 66
- 11.2.2 Canadá 70
-
11.3 Europa 74
- 11.3.1 Alemania 82
- 11.3.2 Reino Unido 86
- 11.3.3 Francia 90
- 11.3.4 España 94
- 11.3.5 Resto de Europa 98
-
11.4 Asia-Pacífico 102
- 11.4.1 China 110
- 11.4.2 Japón 114
- 11.4.3 India 118
- 11.4.4 Australia 122
- 11.4.5 Resto de APAC 126
-
11.5 Oriente Medio y África (MEA) 130
- 11.5.1 Emiratos Árabes Unidos 137
- 11.5.2 Arabia Saudita 141
- 11.5.3 Israel 144
- 11.5.4 Resto de MEA 148
-
11.6 Latinoamérica 152
- 11.6.1 Brasil 159
- 11.6.2 Perú 163
- 11.6.3 Chile 167
- 11.6.4 Resto de Latinoamérica 171
-
12 Panorama competitivo
- 12.1 Descripción general 176
- 12.2 Benchmarking competitivo 177
-
13 Perfiles de empresas
-
13.1 Iovation Inc. 179
- 13.1.1 Descripción general de la empresa 179
- 13.1.2 Panorama financiero (TransUnion) 179
- 13.1.3 Productos/servicios/soluciones ofrecidos 180
- 13.1.4 Desarrollos clave 180
- 13.1.5 Análisis FODA 180
-
13.2 IBM Corporation 181
- 13.2.1 Panorama de la empresa 181
- 13.2.2 Panorama financiero 181
- 13.2.3 Productos/servicios/soluciones ofrecidos 182
- 13.2.4 Desarrollos clave 182
- 13.2.5 Análisis FODA 182
- 13.2.6 Estrategias clave 183
-
13.3 Oracle Corporation 184
- 13.3.1 Panorama de la empresa 184
- 13.3.2 Panorama financiero 184
- 13.3.3 Productos/servicios/soluciones ofrecidos 185
- 13.3.4 Desarrollos clave 185
- 13.3.5 Análisis FODA 185
- 13.3.6 Estrategias clave 185
-
13.4 PayPal Holdings Inc. 186
- 13.4.1 Panorama de la empresa 186
- 13.4.2 Panorama financiero 186
- 13.4.3 Productos/servicios/soluciones ofrecidos 187
- 13.4.4 Desarrollos clave 187
- 13.4.5 Análisis FODA 188
- 13.4.6 Estrategias clave 188
-
13.5 CardinalCommerce Corporation (Visa Inc. Clase A) 189
- 13.5.1 Descripción general de la empresa 189
- 13.5.2 Descripción financiera 190
- 13.5.3 Productos/servicios/soluciones ofrecidos 190
- 13.5.4 Desarrollos clave 191
- 13.5.5 Análisis FODA 192
- 13.5.6 Estrategias clave 192
-
13.6 Distil Networks, Inc. 193
- 13.6.1 Descripción general de la empresa 193
- 13.6.2 Descripción financiera 193
- 13.6.3 Productos/servicios/soluciones ofrecidos 193
- 13.6.4 Desarrollos clave 193
-
13.7 LexisNexis Risk Solutions Company 194
- 13.7.1 Descripción general de la empresa 194
- 13.7.2 Descripción general financiera 194
- 13.7.3 Productos/servicios/soluciones ofrecidos 195
- 13.7.4 Desarrollos clave 195
- 13.7.5 Análisis FODA 195
- 13.7.6 Estrategias clave 195
-
13.8 Experian PLC 196
- 13.8.1 Descripción general de la empresa 196
- 13.8.2 Descripción general financiera 196
- 13.8.3 Productos/servicios/soluciones ofrecidos 197
- 13.8.4 Desarrollos clave 197
- 13.8.5 Análisis FODA 197
- 13.8.6 Estrategias clave Estrategias 198
-
13.9 Accertify Inc. (American Express Company) 199
- 13.9.1 Descripción general de la empresa 199
- 13.9.2 Descripción financiera 199
- 13.9.3 Productos/servicios/soluciones ofrecidos 200
- 13.9.4 Desarrollos clave 200
- 13.9.5 Análisis FODA 200
-
13.10 F5 Networks Inc 201
- 13.10.1 Descripción general de la empresa 201
- 13.10.2 Descripción financiera 201
- 13.10.3 Productos/servicios/soluciones ofrecidos 202
- 13.10.4 Desarrollos clave 202
- 13.10.5 Análisis FODA 202
- 13.10.6 Estrategias clave 202
-
13.11 Kaalbi Technologies Pvt. Ltd 203
- 13.11.1 Descripción general de la empresa 203
- 13.11.2 Descripción general financiera 203
- 13.11.3 Productos/servicios/soluciones ofrecidos 203
- 13.11.4 Desarrollos clave 204
- 13.11.5 Análisis FODA 204
-
13.12 Signifyd Inc. 205
- 13.12.1 Descripción general de la empresa 205
- 13.12.2 Descripción general financiera 205
- 13.12.3 Productos/servicios/soluciones ofrecidos 205
- 13.12.4 Desarrollos clave 205
- 13.12.5 Análisis FODA 205
-
13.13 Guardian Analytics Inc. 206
- 13.13.1 Descripción general de la empresa 206
- 13.13.2 Descripción financiera 206
- 13.13.3 Productos/servicios/soluciones ofrecidos 206
- 13.13.4 Desarrollos clave 206
-
13.14 Kount Inc. 207
- 13.14.1 Descripción general de la empresa 207
- 13.14.2 Descripción financiera 207
- 13.14.3 Productos/servicios/soluciones ofrecidos 207
- 13.14.4 Desarrollos clave 207
- 13.14.5 Análisis FODA 207
-
13.15 ClearSale SA 208
- 13.15.1 Descripción general de la empresa 208
- 13.15.2 Panorama financiero 208
- 13.15.3 Productos/servicios/soluciones ofrecidos 208
- 13.15.4 Desarrollos clave 208
- 13.15.5 Análisis FODA 208
-
13.16 Pindrop Security Inc. 209
- 13.16.1 Panorama de la empresa 209
- 13.16.2 Panorama financiero 209
- 13.16.3 Productos/servicios/soluciones ofrecidos 209
- 13.16.4 Desarrollos clave 209
- 13.16.5 Análisis FODA 209
-
13.17 ACI Worldwide Inc. 210
- 13.17.1 Panorama de la empresa 210
- 13.17.2 Panorama financiero 210
- 13.17.3 Productos/servicios/soluciones ofrecidos 211
- 13.17.4 Desarrollos clave 211
- 13.17.5 Estrategias clave 211
-
13.18 BioCatch Ltd 212
- 13.18.1 Panorama de la empresa 212
- 13.18.2 Panorama financiero 212
- 13.18.3 Productos/servicios/soluciones ofrecidos 212
- 13.18.4 Desarrollos clave 212
-
13.19 ThreatMetrix, Inc. 213
- 13.19.1 Panorama de la empresa 213
- 13.19.2 Panorama financiero 213
- 13.19.3 Productos/Servicios/Soluciones Ofrecidas 213
- 13.19.4 Desarrollos Clave 213
- 13.19.5 Estrategias Clave 213
-
13.20 Sift Science Inc. 214
- 13.20.1 Descripción General de la Empresa 214
- 13.20.2 Descripción General Financiera 214
- 13.20.3 Productos/Servicios/Soluciones Ofrecidas 214
- 13.20.4 Desarrollos Clave 214
- 13.20.5 Estrategias Clave 215
-
13.21 Riskified 216
- 13.21.1 Descripción General de la Empresa 216
- 13.21.2 Descripción General Financiera 216
- 13.21.3 Productos/Servicios/Soluciones Ofrecidas 216
- 13.21.4 Desarrollos Clave 216
- 13.21.5 Estrategias Clave 216
-
13.22 41stParameter (Experian PLC) 217
- 13.22.1 Descripción General de la Empresa 217
- 13.22.2 Descripción Financiera 217
- 13.22.3 Productos/Servicios/Soluciones Ofrecidas 218
- 13.22.4 Análisis FODA 218
- 13.22.5 Desarrollos Clave 218
- 13.22.6 Estrategias Clave 218
-
13.1 Iovation Inc. 179
-
14 Lista de Tablas
- TABLA 1 SINOPSIS DEL MERCADO 19
- TABLA 2 LISTA DE SUPUESTOS 30
- TABLA 3 MERCADO GLOBAL DE DETECCIÓN Y PREVENCIÓN DE FRAUDE, POR SOLUCIÓN, 2023-2032 (MILLONES DE USD) 40
- TABLA 4 MERCADO GLOBAL DE DETECCIÓN Y PREVENCIÓN DE FRAUDE, POR SERVICIO, 2023-2032 (MILLONES DE USD) 43
- TABLA 5 MERCADO GLOBAL DE DETECCIÓN Y PREVENCIÓN DE FRAUDE, POR APLICACIÓN, 2023-2032 (MILLONES DE USD) 46
- TABLA 6 MERCADO GLOBAL DE DETECCIÓN Y PREVENCIÓN DE FRAUDE, POR TAMAÑO DE ORGANIZACIÓN, 2023-2032 (MILLONES DE USD) 49
- TABLA 7 MERCADO GLOBAL DE DETECCIÓN Y PREVENCIÓN DE FRAUDE, POR VERTICAL, 2023–2032 (USD MILLONES) 53
- TABLA 8 MERCADO GLOBAL DE DETECCIÓN Y PREVENCIÓN DE FRAUDE, POR REGIÓN, 2023–2032 (USD MILLONES) 58
- TABLA 9 AMÉRICA DEL NORTE: MERCADO DE DETECCIÓN Y PREVENCIÓN DE FRAUDE, POR PAÍS, 2023–2032 (USD MILLONES) 60
- TABLA 10 AMÉRICA DEL NORTE: MERCADO DE DETECCIÓN Y PREVENCIÓN DE FRAUDE, POR SOLUCIÓN, 2023–2032 (USD MILLONES) 61
- TABLA 11 AMÉRICA DEL NORTE: MERCADO DE DETECCIÓN Y PREVENCIÓN DE FRAUDE, POR SERVICIO, 2023–2032 (USD MILLONES) 62
- TABLA 12 AMÉRICA DEL NORTE: DETECCIÓN Y PREVENCIÓN DE FRAUDE MERCADO DE PREVENCIÓN, POR APLICACIÓN, 2023-2032 (MILLONES DE USD) 63
- TABLA 13 AMÉRICA DEL NORTE: MERCADO DE DETECCIÓN Y PREVENCIÓN DE FRAUDE, POR TAMAÑO DE ORGANIZACIÓN, 2023-2032 (MILLONES DE USD) 64
- TABLA 14 AMÉRICA DEL NORTE: MERCADO DE DETECCIÓN Y PREVENCIÓN DE FRAUDE, POR VERTICAL, 2023-2032 (MILLONES DE USD) 65
- TABLA 15 EE. UU.: MERCADO DE DETECCIÓN Y PREVENCIÓN DE FRAUDE, POR SOLUCIÓN, 2023-2032 (MILLONES DE USD) 66
- TABLA 16 EE. UU.: MERCADO DE DETECCIÓN Y PREVENCIÓN DE FRAUDE, POR SERVICIO, 2023-2032 (MILLONES DE USD) 67
- TABLA 17 EE. UU.: MERCADO DE DETECCIÓN Y PREVENCIÓN DE FRAUDES, POR APLICACIÓN, 2023-2032 (MILLONES DE USD) 67
- TABLA 18 EE. UU.: MERCADO DE DETECCIÓN Y PREVENCIÓN DE FRAUDES, POR TAMAÑO DE ORGANIZACIÓN, 2023-2032 (MILLONES DE USD) 68
- TABLA 19 EE. UU.: MERCADO DE DETECCIÓN Y PREVENCIÓN DE FRAUDES, POR VERTICAL, 2023-2032 (MILLONES DE USD) 68
- TABLA 20 CANADÁ: MERCADO DE DETECCIÓN Y PREVENCIÓN DE FRAUDES, POR SOLUCIÓN, 2023-2032 (MILLONES DE USD) 70
- TABLA 21 CANADÁ: MERCADO DE DETECCIÓN Y PREVENCIÓN DE FRAUDES, POR SERVICIO, 2023-2032 (MILLONES DE USD) 71
- TABLA 22 CANADÁ: MERCADO DE DETECCIÓN Y PREVENCIÓN DE FRAUDES, POR APLICACIÓN, 2023-2032 (MILLONES DE USD) 71
- TABLA 23 CANADÁ: MERCADO DE DETECCIÓN Y PREVENCIÓN DE FRAUDES, POR TAMAÑO DE ORGANIZACIÓN, 2023-2032 (MILLONES DE USD) 72
- TABLA 24 CANADÁ: MERCADO DE DETECCIÓN Y PREVENCIÓN DE FRAUDES, POR VERTICAL, 2023-2032 (MILLONES DE USD) 72
- TABLA 25 EUROPA: MERCADO DE DETECCIÓN Y PREVENCIÓN DE FRAUDES, POR PAÍS, 2023-2032 (MILLONES DE USD) 75
- TABLA 26 EUROPA: MERCADO DE DETECCIÓN Y PREVENCIÓN DE FRAUDES, POR SOLUCIÓN, 2023-2032 (MILLONES DE USD) 76
- TABLA 27 EUROPA: MERCADO DE DETECCIÓN Y PREVENCIÓN DE FRAUDE, POR SERVICIO, 2023-2032 (MILLONES DE USD) 77
- TABLA 28 EUROPA: MERCADO DE DETECCIÓN Y PREVENCIÓN DE FRAUDE, POR APLICACIÓN, 2023-2032 (MILLONES DE USD) 78
- TABLA 29 EUROPA: MERCADO DE DETECCIÓN Y PREVENCIÓN DE FRAUDE, POR TAMAÑO DE ORGANIZACIÓN, 2023-2032 (MILLONES DE USD) 79
- TABLA 30 EUROPA: MERCADO DE DETECCIÓN Y PREVENCIÓN DE FRAUDE, POR VERTICAL, 2023-2032 (MILLONES DE USD) 80
- TABLA 31 ALEMANIA: MERCADO DE DETECCIÓN Y PREVENCIÓN DE FRAUDE, POR SOLUCIÓN, 2023-2032 (MILLONES DE USD) 82
- TABLA 32 ALEMANIA: MERCADO DE DETECCIÓN Y PREVENCIÓN DE FRAUDES, POR SERVICIO, 2023-2032 (MILLONES DE USD) 83
- TABLA 33 ALEMANIA: MERCADO DE DETECCIÓN Y PREVENCIÓN DE FRAUDES, POR APLICACIÓN, 2023-2032 (MILLONES DE USD) 83
- TABLA 34 ALEMANIA: MERCADO DE DETECCIÓN Y PREVENCIÓN DE FRAUDES, POR TAMAÑO DE ORGANIZACIÓN, 2023-2032 (MILLONES DE USD) 84
- TABLA 35 ALEMANIA: MERCADO DE DETECCIÓN Y PREVENCIÓN DE FRAUDES, POR VERTICAL, 2023-2032 (MILLONES DE USD) 84
- TABLA 36 REINO UNIDO: MERCADO DE DETECCIÓN Y PREVENCIÓN DE FRAUDES, POR SOLUCIÓN, 2023-2032 (MILLONES DE USD) 86
- TABLA 37 REINO UNIDO: MERCADO DE DETECCIÓN Y PREVENCIÓN DE FRAUDES, POR SERVICIO, 2023-2032 (MILLONES DE USD) 87
- TABLA 38 REINO UNIDO: MERCADO DE DETECCIÓN Y PREVENCIÓN DE FRAUDES, POR APLICACIÓN, 2023-2032 (MILLONES DE USD) 87
- TABLA 39 REINO UNIDO: MERCADO DE DETECCIÓN Y PREVENCIÓN DE FRAUDES, POR TAMAÑO DE LA ORGANIZACIÓN, 2023-2032 (MILLONES DE USD) 88
- TABLA 40 REINO UNIDO: MERCADO DE DETECCIÓN Y PREVENCIÓN DE FRAUDES, POR VERTICAL, 2023-2032 (MILLONES DE USD) 88
- TABLA 41 FRANCIA: MERCADO DE DETECCIÓN Y PREVENCIÓN DE FRAUDES, POR SOLUCIÓN, 2023-2032 (MILLONES DE USD) 90
- TABLA 42 FRANCIA: MERCADO DE DETECCIÓN Y PREVENCIÓN DE FRAUDES, POR SERVICIO, 2023-2032 (MILLONES DE USD) 91
- TABLA 43 FRANCIA: MERCADO DE DETECCIÓN Y PREVENCIÓN DE FRAUDES, POR APLICACIÓN, 2023-2032 (MILLONES DE USD) 91
- TABLA 44 FRANCIA: MERCADO DE DETECCIÓN Y PREVENCIÓN DE FRAUDES, POR TAMAÑO DE LA ORGANIZACIÓN, 2023-2032 (MILLONES DE USD) 92
- TABLA 45 FRANCIA: MERCADO DE DETECCIÓN Y PREVENCIÓN DE FRAUDES, POR VERTICAL, 2023-2032 (MILLONES DE USD) 92
- TABLA 46 ESPAÑA: MERCADO DE DETECCIÓN Y PREVENCIÓN DE FRAUDE, POR SOLUCIÓN, 2023-2032 (MILLONES DE USD) 94
- TABLA 47 ESPAÑA: MERCADO DE DETECCIÓN Y PREVENCIÓN DE FRAUDE, POR SERVICIO, 2023-2032 (MILLONES DE USD) 94
- TABLA 48 ESPAÑA: MERCADO DE DETECCIÓN Y PREVENCIÓN DE FRAUDE, POR APLICACIÓN, 2023-2032 (MILLONES DE USD) 95
- TABLA 49 ESPAÑA: MERCADO DE DETECCIÓN Y PREVENCIÓN DE FRAUDE, POR TAMAÑO DE ORGANIZACIÓN, 2023-2032 (MILLONES DE USD) 96
- TABLA 50 ESPAÑA: MERCADO DE DETECCIÓN Y PREVENCIÓN DE FRAUDE, POR VERTICAL, 2023-2032 (MILLONES DE USD) 96
- TABLA 51 RESTO DE EUROPA: MERCADO DE DETECCIÓN Y PREVENCIÓN DE FRAUDE, POR SOLUCIÓN, 2023-2032 (MILLONES DE USD) 98
- TABLA 52 RESTO DE EUROPA: MERCADO DE DETECCIÓN Y PREVENCIÓN DE FRAUDE, POR SERVICIO, 2023-2032 (MILLONES DE USD) 99
- TABLA 53 RESTO DE EUROPA: MERCADO DE DETECCIÓN Y PREVENCIÓN DE FRAUDE, POR APLICACIÓN, 2023-2032 (MILLONES DE USD) 99
- TABLA 54 RESTO DE EUROPA: MERCADO DE DETECCIÓN Y PREVENCIÓN DE FRAUDE, POR TAMAÑO DE ORGANIZACIÓN, 2023-2032 (MILLONES DE USD) 100
- TABLA 55 RESTO DE EUROPA: MERCADO DE DETECCIÓN Y PREVENCIÓN DE FRAUDE, POR VERTICAL, 2023–2032 (USD MILLONES) 100
- TABLA 56 ASIA-PACÍFICO: MERCADO DE DETECCIÓN Y PREVENCIÓN DE FRAUDES, POR PAÍS, 2023–2032 (USD MILLONES) 103
- TABLA 57 ASIA-PACÍFICO: MERCADO DE DETECCIÓN Y PREVENCIÓN DE FRAUDES, POR SOLUCIÓN, 2023–2032 (USD MILLONES) 104
- TABLA 58 ASIA-PACÍFICO: MERCADO DE DETECCIÓN Y PREVENCIÓN DE FRAUDES, POR SERVICIO, 2023–2032 (USD MILLONES) 105
- TABLA 59 ASIA-PACÍFICO: MERCADO DE DETECCIÓN Y PREVENCIÓN DE FRAUDES, POR APLICACIÓN, 2023–2032 (USD MILLONES) 106
- TABLA 60 ASIA-PACÍFICO: MERCADO DE DETECCIÓN Y PREVENCIÓN DE FRAUDES, POR TAMAÑO DE ORGANIZACIÓN, 2023-2032 (MILLONES DE USD) 107
- TABLA 61 ASIA-PACÍFICO: MERCADO DE DETECCIÓN Y PREVENCIÓN DE FRAUDES, POR VERTICAL, 2023-2032 (MILLONES DE USD) 108
- TABLA 62 CHINA: MERCADO DE DETECCIÓN Y PREVENCIÓN DE FRAUDES, POR SOLUCIÓN, 2023-2032 (MILLONES DE USD) 110
- TABLA 63 CHINA: MERCADO DE DETECCIÓN Y PREVENCIÓN DE FRAUDES, POR SERVICIO, 2023-2032 (MILLONES DE USD) 111
- TABLA 64 CHINA: MERCADO DE DETECCIÓN Y PREVENCIÓN DE FRAUDES, POR APLICACIÓN, 2023-2032 (MILLONES DE USD) 111
- TABLA 65 CHINA: MERCADO DE DETECCIÓN Y PREVENCIÓN DE FRAUDES, POR TAMAÑO DE ORGANIZACIÓN, 2023-2032 (MILLONES DE USD) 112
- TABLA 66 CHINA: MERCADO DE DETECCIÓN Y PREVENCIÓN DE FRAUDES, POR VERTICAL, 2023-2032 (MILLONES DE USD) 112
- TABLA 67 JAPÓN: MERCADO DE DETECCIÓN Y PREVENCIÓN DE FRAUDES, POR SOLUCIÓN, 2023-2032 (MILLONES DE USD) 114
- TABLA 68 JAPÓN: MERCADO DE DETECCIÓN Y PREVENCIÓN DE FRAUDES, POR SERVICIO, 2023-2032 (MILLONES DE USD) 115
- TABLA 69 JAPÓN: MERCADO DE DETECCIÓN Y PREVENCIÓN DE FRAUDES, POR APLICACIÓN, 2023-2032 (USD MILLONES) 115
- TABLA 70 JAPÓN: MERCADO DE DETECCIÓN Y PREVENCIÓN DE FRAUDE, POR TAMAÑO DE ORGANIZACIÓN, 2023-2032 (USD MILLONES) 116
- TABLA 71 JAPÓN: MERCADO DE DETECCIÓN Y PREVENCIÓN DE FRAUDE, POR VERTICAL, 2023-2032 (USD MILLONES) 116
- TABLA 72 INDIA: MERCADO DE DETECCIÓN Y PREVENCIÓN DE FRAUDE, POR SOLUCIÓN, 2023-2032 (USD MILLONES) 118
- TABLA 73 INDIA: MERCADO DE DETECCIÓN Y PREVENCIÓN DE FRAUDE, POR SERVICIO, 2023-2032 (USD MILLONES) 118
- TABLA 74 INDIA: MERCADO DE DETECCIÓN Y PREVENCIÓN DE FRAUDE, POR APLICACIÓN, 2023–2032 (USD MILLONES) 119
- TABLA 75 INDIA: MERCADO DE DETECCIÓN Y PREVENCIÓN DE FRAUDE, POR TAMAÑO DE ORGANIZACIÓN, 2023–2032 (USD MILLONES) 119
- TABLA 76 INDIA: MERCADO DE DETECCIÓN Y PREVENCIÓN DE FRAUDE, POR VERTICAL, 2023–2032 (USD MILLONES) 120
- TABLA 77 AUSTRALIA: MERCADO DE DETECCIÓN Y PREVENCIÓN DE FRAUDE, POR SOLUCIÓN, 2023–2032 (USD MILLONES) 122
- TABLA 78 AUSTRALIA: MERCADO DE DETECCIÓN Y PREVENCIÓN DE FRAUDE, POR SERVICIO, 2023–2032 (USD MILLONES) 122
- TABLA 79 AUSTRALIA: DETECCIÓN DE FRAUDE Y MERCADO DE PREVENCIÓN, POR APLICACIÓN, 2023-2032 (MILLONES DE USD) 123
- TABLA 80 AUSTRALIA: MERCADO DE DETECCIÓN Y PREVENCIÓN DE FRAUDES, POR TAMAÑO DE ORGANIZACIÓN, 2023-2032 (MILLONES DE USD) 123
- TABLA 81 AUSTRALIA: MERCADO DE DETECCIÓN Y PREVENCIÓN DE FRAUDES, POR VERTICAL, 2023-2032 (MILLONES DE USD) 124
- TABLA 82 RESTO DE APAC: MERCADO DE DETECCIÓN Y PREVENCIÓN DE FRAUDES, POR SOLUCIÓN, 2023-2032 (MILLONES DE USD) 126
- TABLA 83 RESTO DE APAC: MERCADO DE DETECCIÓN Y PREVENCIÓN DE FRAUDES, POR SERVICIO, 2023-2032 (MILLONES DE USD) 126
- TABLA 84 RESTO DE APAC: MERCADO DE DETECCIÓN Y PREVENCIÓN DE FRAUDE, POR APLICACIÓN, 2023-2032 (MILLONES DE USD) 127
- TABLA 85 RESTO DE APAC: MERCADO DE DETECCIÓN Y PREVENCIÓN DE FRAUDE, POR TAMAÑO DE ORGANIZACIÓN, 2023-2032 (MILLONES DE USD) 127
- TABLA 86 RESTO DE APAC: MERCADO DE DETECCIÓN Y PREVENCIÓN DE FRAUDE, POR VERTICAL, 2023-2032 (MILLONES DE USD) 128
- TABLA 87 MEA: MERCADO DE DETECCIÓN Y PREVENCIÓN DE FRAUDE, POR PAÍS, 2023-2032 (MILLONES DE USD) 131
- TABLA 88 MEA: MERCADO DE DETECCIÓN Y PREVENCIÓN DE FRAUDE, POR SOLUCIÓN, 2023–2032 (USD MILLONES) 132
- TABLA 89 MEA: MERCADO DE DETECCIÓN Y PREVENCIÓN DE FRAUDE, POR SERVICIO, 2023–2032 (USD MILLONES) 133
- TABLA 90 MEA: MERCADO DE DETECCIÓN Y PREVENCIÓN DE FRAUDE, POR APLICACIÓN, 2023–2032 (USD MILLONES) 134
- TABLA 91 MEA: MERCADO DE DETECCIÓN Y PREVENCIÓN DE FRAUDE, POR TAMAÑO DE ORGANIZACIÓN, 2023–2032 (USD MILLONES) 135
- TABLA 92 MEA: MERCADO DE DETECCIÓN Y PREVENCIÓN DE FRAUDE, POR VERTICAL, 2023–2032 (USD MILLONES) 136
- TABLA 93 EAU: MERCADO DE DETECCIÓN Y PREVENCIÓN DE FRAUDE, POR SOLUCIÓN, 2023-2032 (MILLONES DE USD) 137
- TABLA 94 EAU: MERCADO DE DETECCIÓN Y PREVENCIÓN DE FRAUDES, POR SERVICIO, 2023-2032 (MILLONES DE USD) 138
- TABLA 95 EAU: MERCADO DE DETECCIÓN Y PREVENCIÓN DE FRAUDES, POR APLICACIÓN, 2023-2032 (MILLONES DE USD) 138
- TABLA 96 EAU: MERCADO DE DETECCIÓN Y PREVENCIÓN DE FRAUDES, POR TAMAÑO DE ORGANIZACIÓN, 2023-2032 (MILLONES DE USD) 139
- TABLA 97 EAU: MERCADO DE DETECCIÓN Y PREVENCIÓN DE FRAUDES, POR VERTICAL, 2023-2032 (MILLONES DE USD) 139
- TABLA 98 ARABIA SAUDÍ: FRAUDES MERCADO DE DETECCIÓN Y PREVENCIÓN, POR SOLUCIÓN, 2023-2032 (MILLONES DE USD) 141
- TABLA 99 ARABIA SAUDÍ: MERCADO DE DETECCIÓN Y PREVENCIÓN DE FRAUDES, POR SERVICIO, 2023-2032 (MILLONES DE USD) 141
- TABLA 100 ARABIA SAUDÍ: MERCADO DE DETECCIÓN Y PREVENCIÓN DE FRAUDES, POR APLICACIÓN, 2023-2032 (MILLONES DE USD) 142
- TABLA 101 ARABIA SAUDÍ: MERCADO DE DETECCIÓN Y PREVENCIÓN DE FRAUDES, POR TAMAÑO DE LA ORGANIZACIÓN, 2023-2032 (MILLONES DE USD) 142
- TABLA 102 ARABIA SAUDÍ: MERCADO DE DETECCIÓN Y PREVENCIÓN DE FRAUDES, POR VERTICAL, 2023-2032 (USD MILLONES) 143
- TABLA 103 ISRAEL: MERCADO DE DETECCIÓN Y PREVENCIÓN DE FRAUDES, POR SOLUCIÓN, 2023-2032 (USD MILLONES) 144
- TABLA 104 ISRAEL: MERCADO DE DETECCIÓN Y PREVENCIÓN DE FRAUDES, POR SERVICIO, 2023-2032 (USD MILLONES) 144
- TABLA 105 ISRAEL: MERCADO DE DETECCIÓN Y PREVENCIÓN DE FRAUDES, POR APLICACIÓN, 2023-2032 (USD MILLONES) 145
- TABLA 106 ISRAEL: MERCADO DE DETECCIÓN Y PREVENCIÓN DE FRAUDES, POR TAMAÑO DE LA ORGANIZACIÓN, 2023-2032 (USD MILLONES) 145
- TABLA 107 ISRAEL: MERCADO DE DETECCIÓN Y PREVENCIÓN DE FRAUDES, POR VERTICAL, 2023-2032 (USD MILLONES) 146
- TABLA 108 RESTO DE MEA: MERCADO DE DETECCIÓN Y PREVENCIÓN DE FRAUDE, POR SOLUCIÓN, 2023-2032 (USD MILLONES) 148
- TABLA 109 RESTO DE MEA: MERCADO DE DETECCIÓN Y PREVENCIÓN DE FRAUDE, POR SERVICIO, 2023-2032 (USD MILLONES) 148
- TABLA 110 RESTO DE MEA: MERCADO DE DETECCIÓN Y PREVENCIÓN DE FRAUDE, POR APLICACIÓN, 2023-2032 (USD MILLONES) 149
- TABLA 111 RESTO DE MEA: MERCADO DE DETECCIÓN Y PREVENCIÓN DE FRAUDE, POR TAMAÑO DE LA ORGANIZACIÓN, 2023-2032 (USD MILLONES) 150
- TABLA 112 RESTO DE MEDIA AMERICA: MERCADO DE DETECCIÓN Y PREVENCIÓN DE FRAUDE, POR VERTICAL, 2023-2032 (MILLONES DE USD) 150
- TABLA 113 AMÉRICA LATINA: MERCADO DE DETECCIÓN Y PREVENCIÓN DE FRAUDE, POR PAÍS, 2023-2032 (MILLONES DE USD) 153
- TABLA 114 AMÉRICA LATINA: MERCADO DE DETECCIÓN Y PREVENCIÓN DE FRAUDE, POR SOLUCIÓN, 2023-2032 (MILLONES DE USD) 154
- TABLA 115 AMÉRICA LATINA: MERCADO DE DETECCIÓN Y PREVENCIÓN DE FRAUDE, POR SERVICIO, 2023-2032 (MILLONES DE USD) 155
- TABLA 116 AMÉRICA LATINA: DETECCIÓN Y PREVENCIÓN DE FRAUDE MERCADO, POR APLICACIÓN, 2023-2032 (USD MILLONES) 156
- TABLA 117 AMÉRICA LATINA: MERCADO DE DETECCIÓN Y PREVENCIÓN DE FRAUDES, POR TAMAÑO DE ORGANIZACIÓN, 2023-2032 (USD MILLONES) 157
- TABLA 118 AMÉRICA LATINA: MERCADO DE DETECCIÓN Y PREVENCIÓN DE FRAUDES, POR VERTICAL, 2023-2032 (USD MILLONES) 158
- TABLA 119 BRASIL: MERCADO DE DETECCIÓN Y PREVENCIÓN DE FRAUDES, POR SOLUCIÓN, 2023-2032 (USD MILLONES) 159
- TABLA 120 BRASIL: MERCADO DE DETECCIÓN Y PREVENCIÓN DE FRAUDES, POR SERVICIO, 2023-2032 (USD MILLONES) 160
- TABLA 121 BRASIL: MERCADO DE DETECCIÓN Y PREVENCIÓN DE FRAUDE, POR APLICACIÓN, 2023-2032 (USD MILLONES) 160
- TABLA 122 BRASIL: MERCADO DE DETECCIÓN Y PREVENCIÓN DE FRAUDE, POR TAMAÑO DE ORGANIZACIÓN, 2023-2032 (USD MILLONES) 161
- TABLA 123 BRASIL: MERCADO DE DETECCIÓN Y PREVENCIÓN DE FRAUDE, POR VERTICAL, 2023-2032 (USD MILLONES) 161
- TABLA 124 PERÚ: MERCADO DE DETECCIÓN Y PREVENCIÓN DE FRAUDE, POR SOLUCIÓN, 2023-2032 (USD MILLONES) 164
- TABLA 125 PERÚ: MERCADO DE DETECCIÓN Y PREVENCIÓN DE FRAUDE, POR SERVICIO, 2023–2032 (USD MILLONES) 164
- TABLA 126 PERÚ: MERCADO DE DETECCIÓN Y PREVENCIÓN DE FRAUDE, POR APLICACIÓN, 2023–2032 (USD MILLONES) 165
- TABLA 127 PERÚ: MERCADO DE DETECCIÓN Y PREVENCIÓN DE FRAUDE, POR TAMAÑO DE ORGANIZACIÓN, 2023–2032 (USD MILLONES) 165
- TABLA 128 PERÚ: MERCADO DE DETECCIÓN Y PREVENCIÓN DE FRAUDE, POR VERTICAL, 2023–2032 (USD MILLONES) 166
- TABLA 129 CHILE: MERCADO DE DETECCIÓN Y PREVENCIÓN DE FRAUDE, POR SOLUCIÓN, 2023–2032 (USD MILLONES) 167
- TABLA 130 CHILE: DETECCIÓN DE FRAUDE Y PREVENCIÓN DE FRAUDES, POR SERVICIO, 2023-2032 (USD MILLONES) 167
- TABLA 131 CHILE: MERCADO DE DETECCIÓN Y PREVENCIÓN DE FRAUDES, POR APLICACIÓN, 2023-2032 (USD MILLONES) 168
- TABLA 132 CHILE: MERCADO DE DETECCIÓN Y PREVENCIÓN DE FRAUDES, POR TAMAÑO DE ORGANIZACIÓN, 2023-2032 (USD MILLONES) 168
- TABLA 133 CHILE: MERCADO DE DETECCIÓN Y PREVENCIÓN DE FRAUDES, POR VERTICAL, 2023-2032 (USD MILLONES) 169
- TABLA 134 RESTO DE AMÉRICA LATINA: MERCADO DE DETECCIÓN Y PREVENCIÓN DE FRAUDES, POR SOLUCIÓN, 2023-2032 (USD MILLONES) 171
- TABLA 135 RESTO DE AMÉRICA LATINA: MERCADO DE DETECCIÓN Y PREVENCIÓN DE FRAUDE, POR SERVICIO, 2023-2032 (MILLONES DE USD) 171
- TABLA 136 RESTO DE AMÉRICA LATINA: MERCADO DE DETECCIÓN Y PREVENCIÓN DE FRAUDE, POR APLICACIÓN, 2023-2032 (MILLONES DE USD) 172
- TABLA 137 RESTO DE AMÉRICA LATINA: MERCADO DE DETECCIÓN Y PREVENCIÓN DE FRAUDE, POR TAMAÑO DE ORGANIZACIÓN, 2023-2032 (MILLONES DE USD) 172
- TABLA 138 RESTO DE AMÉRICA LATINA: MERCADO DE DETECCIÓN Y PREVENCIÓN DE FRAUDE, POR VERTICAL, 2023-2032 (MILLONES DE USD) 173
-
15 Lista de Figuras
- FIGURA 1 MERCADO GLOBAL DE DETECCIÓN Y DETECCIÓN DE FRAUDE: ESTRUCTURA DEL MERCADO 21
- FIGURA 2 TAMAÑO DEL MERCADO DE AMÉRICA DEL NORTE Y TASA DE CRECIMIENTO, POR PAÍS (2023-2032) 23
- FIGURA 3 TAMAÑO DEL MERCADO DE EUROPA Y TASA DE CRECIMIENTO, POR PAÍS (2023-2032) 23
- FIGURA 4 TAMAÑO DEL MERCADO DE ASIA-PACÍFICO Y TASA DE CRECIMIENTO, POR PAÍS (2023-2032) 23
- FIGURA 5 ORIENTE MEDIO Y TAMAÑO DEL MERCADO DE ÁFRICA Y TASA DE CRECIMIENTO, POR PAÍS (2023-2032) 23
- FIGURA 6 TAMAÑO DEL MERCADO DE AMÉRICA LATINA Y TASA DE CRECIMIENTO, POR PAÍS (2023-2032) 24
- FIGURA 7 ENFOQUE DE ARRIBA HACIA ABAJO Y DE ABAJO HACIA ARRIBA 29
- FIGURA 8 ANÁLISIS DE IMPULSORES, OPORTUNIDADES Y RESTRICCIONES DEL MERCADO GLOBAL DE DETECCIÓN Y PREVENCIÓN DE FRAUDE 32
- FIGURA 9 PÉRDIDAS POR FRAUDE EN INTERNET/COMERCIO ELECTRÓNICO EN LAS TARJETAS EMITIDAS EN EL REINO UNIDO 2008-2023 (EN MILLONES DE USD) 33
- FIGURA 10 CADENA DE VALOR: MERCADO DE DETECCIÓN Y PREVENCIÓN DE FRAUDE 35
- FIGURA 11 ANÁLISIS DE LAS CINCO FUERZAS DE PORTER DEL MERCADO GLOBAL DE DETECCIÓN Y PREVENCIÓN DE FRAUDE 37
- FIGURA 12 MERCADO GLOBAL DE DETECCIÓN Y PREVENCIÓN DE FRAUDE, POR SOLUCIÓN, 2023-2032 (MILLONES DE USD) 40
- FIGURA 13 DETECCIÓN Y PREVENCIÓN DE FRAUDE GLOBAL MERCADO, POR SERVICIO, 2023-2032 (MILLONES DE USD) 43
- FIGURA 14 MERCADO GLOBAL DE DETECCIÓN Y PREVENCIÓN DE FRAUDE, POR APLICACIÓN, 2023-2032 (MILLONES DE USD) 46
- FIGURA 15 MERCADO GLOBAL DE DETECCIÓN Y PREVENCIÓN DE FRAUDE, POR TAMAÑO DE ORGANIZACIÓN, 2023-2032 (MILLONES DE USD) 49
- FIGURA 16 MERCADO GLOBAL DE DETECCIÓN Y PREVENCIÓN DE FRAUDE, POR VERTICAL, 2023-2032 (MILLONES DE USD) 52
- FIGURA 17 MERCADO GLOBAL DE DETECCIÓN Y PREVENCIÓN DE FRAUDE, POR REGIÓN, TASA DE CRECIMIENTO, 2023-2032 (%) 57
- FIGURA 18 MERCADO GLOBAL DE DETECCIÓN Y PREVENCIÓN DE FRAUDE, POR REGIÓN, 2023-2032 (MILLONES DE USD) 57
- FIGURA 19 AMÉRICA DEL NORTE: MERCADO DE DETECCIÓN Y PREVENCIÓN DE FRAUDE, POR PAÍS, TASA DE CRECIMIENTO, 2023-2032 (%) 59
- FIGURA 20 AMÉRICA DEL NORTE: MERCADO DE DETECCIÓN Y PREVENCIÓN DE FRAUDE, POR PAÍS, 2023-2032 (MILLONES DE USD) 59
- FIGURA 21 AMÉRICA DEL NORTE: MERCADO DE DETECCIÓN Y PREVENCIÓN DE FRAUDE, POR SOLUCIÓN, 2023-2032 (MILLONES DE USD) 60
- FIGURA 22 AMÉRICA DEL NORTE: MERCADO DE DETECCIÓN Y PREVENCIÓN DE FRAUDE, POR SERVICIO, 2023–2032 (USD MILLONES) 61
- FIGURA 23 AMÉRICA DEL NORTE: MERCADO DE DETECCIÓN Y PREVENCIÓN DE FRAUDE, POR APLICACIÓN, 2023–2032 (USD MILLONES) 62
- FIGURA 24 AMÉRICA DEL NORTE: MERCADO DE DETECCIÓN Y PREVENCIÓN DE FRAUDE, POR TAMAÑO DE ORGANIZACIÓN, 2023–2032 (USD MILLONES) 63
- FIGURA 25 AMÉRICA DEL NORTE: MERCADO DE DETECCIÓN Y PREVENCIÓN DE FRAUDE, POR VERTICAL, 2023–2032 (USD MILLONES) 64
- FIGURA 26 EUROPA: MERCADO DE DETECCIÓN Y PREVENCIÓN DE FRAUDE, POR PAÍS, TASA DE CRECIMIENTO, 2023–2032 (%) 74
- FIGURA 27 EUROPA: MERCADO DE DETECCIÓN Y PREVENCIÓN DE FRAUDE, POR PAÍS, 2023-2032 (MILLONES DE USD) 74
- FIGURA 28 EUROPA: MERCADO DE DETECCIÓN Y PREVENCIÓN DE FRAUDE, POR SOLUCIÓN, 2023-2032 (MILLONES DE USD) 76
- FIGURA 29 EUROPA: MERCADO DE DETECCIÓN Y PREVENCIÓN DE FRAUDE, POR SERVICIO, 2023-2032 (MILLONES DE USD) 77
- FIGURA 30 EUROPA: MERCADO DE DETECCIÓN Y PREVENCIÓN DE FRAUDE, POR APLICACIÓN, 2023-2032 (MILLONES DE USD) 78
- FIGURA 31 EUROPA: MERCADO DE DETECCIÓN Y PREVENCIÓN DE FRAUDE, POR TAMAÑO DE LA ORGANIZACIÓN, 2023–2032 (USD MILLONES) 79
- FIGURA 32 EUROPA: MERCADO DE DETECCIÓN Y PREVENCIÓN DE FRAUDE, POR VERTICAL, 2023–2032 (USD MILLONES) 80
- FIGURA 33 ASIA-PACÍFICO: MERCADO DE DETECCIÓN Y PREVENCIÓN DE FRAUDE, POR PAÍS, TASA DE CRECIMIENTO, 2023–2032 (%) 102
- FIGURA 34 ASIA-PACÍFICO: MERCADO DE DETECCIÓN Y PREVENCIÓN DE FRAUDE, POR PAÍS, 2023–2032 (USD MILLONES) 103
- FIGURA 35 ASIA-PACÍFICO: MERCADO DE DETECCIÓN Y PREVENCIÓN DE FRAUDE, POR SOLUCIÓN, 2023–2032 (USD MILLONES) 104
- FIGURA 36 ASIA-PACÍFICO: MERCADO DE DETECCIÓN Y PREVENCIÓN DE FRAUDES, POR SERVICIO, 2023-2032 (MILLONES DE USD) 105
- FIGURA 37 ASIA-PACÍFICO: MERCADO DE DETECCIÓN Y PREVENCIÓN DE FRAUDES, POR APLICACIÓN, 2023-2032 (MILLONES DE USD) 106
- FIGURA 38 ASIA-PACÍFICO: MERCADO DE DETECCIÓN Y PREVENCIÓN DE FRAUDES, POR TAMAÑO DE ORGANIZACIÓN, 2023-2032 (MILLONES DE USD) 107
- FIGURA 39 ASIA-PACÍFICO: MERCADO DE DETECCIÓN Y PREVENCIÓN DE FRAUDES, POR VERTICAL, 2023-2032 (MILLONES DE USD) 108
- FIGURA 40 MEA: MERCADO DE DETECCIÓN Y PREVENCIÓN DE FRAUDES, POR PAÍS, TASA DE CRECIMIENTO, 2023-2032 (%) 130
- FIGURA 41 MEA: MERCADO DE DETECCIÓN Y PREVENCIÓN DE FRAUDE, POR PAÍS, 2023-2032 (MILLONES DE USD) 130
- FIGURA 42 MEA: MERCADO DE DETECCIÓN Y PREVENCIÓN DE FRAUDE, POR SOLUCIÓN, 2023-2032 (MILLONES DE USD) 131
- FIGURA 43 MEA: MERCADO DE DETECCIÓN Y PREVENCIÓN DE FRAUDE, POR SERVICIO, 2023-2032 (MILLONES DE USD) 132
- FIGURA 44 MEA: MERCADO DE DETECCIÓN Y PREVENCIÓN DE FRAUDE, POR APLICACIÓN, 2023-2032 (MILLONES DE USD) 133
- FIGURA 45 MEA: FRAUDE MERCADO DE DETECCIÓN Y PREVENCIÓN, POR TAMAÑO DE ORGANIZACIÓN, 2023-2032 (MILLONES DE USD) 134
- FIGURA 46 MEA: MERCADO DE DETECCIÓN Y PREVENCIÓN DE FRAUDE, POR VERTICAL, 2023-2032 (MILLONES DE USD) 135
- FIGURA 47 AMÉRICA LATINA: MERCADO DE DETECCIÓN Y PREVENCIÓN DE FRAUDE, POR PAÍS, TASA DE CRECIMIENTO, 2023-2032 (%) 152
- FIGURA 48 AMÉRICA LATINA: MERCADO DE DETECCIÓN Y PREVENCIÓN DE FRAUDE, POR PAÍS, 2023-2032 (MILLONES DE USD) 152
- FIGURA 49 AMÉRICA LATINA: MERCADO DE DETECCIÓN Y PREVENCIÓN DE FRAUDE, POR SOLUCIÓN, 2023–2032 (USD MILLONES) 153
- FIGURA 50 AMÉRICA LATINA: MERCADO DE DETECCIÓN Y PREVENCIÓN DE FRAUDE, POR SERVICIO, 2023–2032 (USD MILLONES) 154
- FIGURA 51 AMÉRICA LATINA: MERCADO DE DETECCIÓN Y PREVENCIÓN DE FRAUDE, POR APLICACIÓN, 2023–2032 (USD MILLONES) 155
- FIGURA 52 AMÉRICA LATINA: MERCADO DE DETECCIÓN Y PREVENCIÓN DE FRAUDE, POR TAMAÑO DE ORGANIZACIÓN, 2023–2032 (USD MILLONES) 156
- FIGURA 53 AMÉRICA LATINA: MERCADO DE DETECCIÓN Y PREVENCIÓN DE FRAUDE, POR VERTICAL, 2023–2032 (USD MILLONES) 157
- FIGURA 54 REFERENCIA DE LOS PRINCIPALES COMPETIDORES 177
Customer Stories

“This is really good guys. Excellent work on a tight deadline. I will continue to use you going forward and recommend you to others. Nice job”

“Thanks. It’s been a pleasure working with you, please use me as reference with any other Intel employees.”

“Thanks for sending the report it gives us a good global view of the Betaïne market.”

“Thank you, this will be very helpful for OQS.”

“We found the report very insightful! we found your research firm very helpful. I'm sending this email to secure our future business.”

“I am very pleased with how market segments have been defined in a relevant way for my purposes (such as "Portable Freezers & refrigerators" and "last-mile"). In general the report is well structured. Thanks very much for your efforts.”

“I have been reading the first document or the study, ,the Global HVAC and FP market report 2021 till 2026. Must say, good info! I have not gone in depth at all parts, but got a good indication of the data inside!”

“We got the report in time, we really thank you for your support in this process. I also thank to all of your team as they did a great job.”
