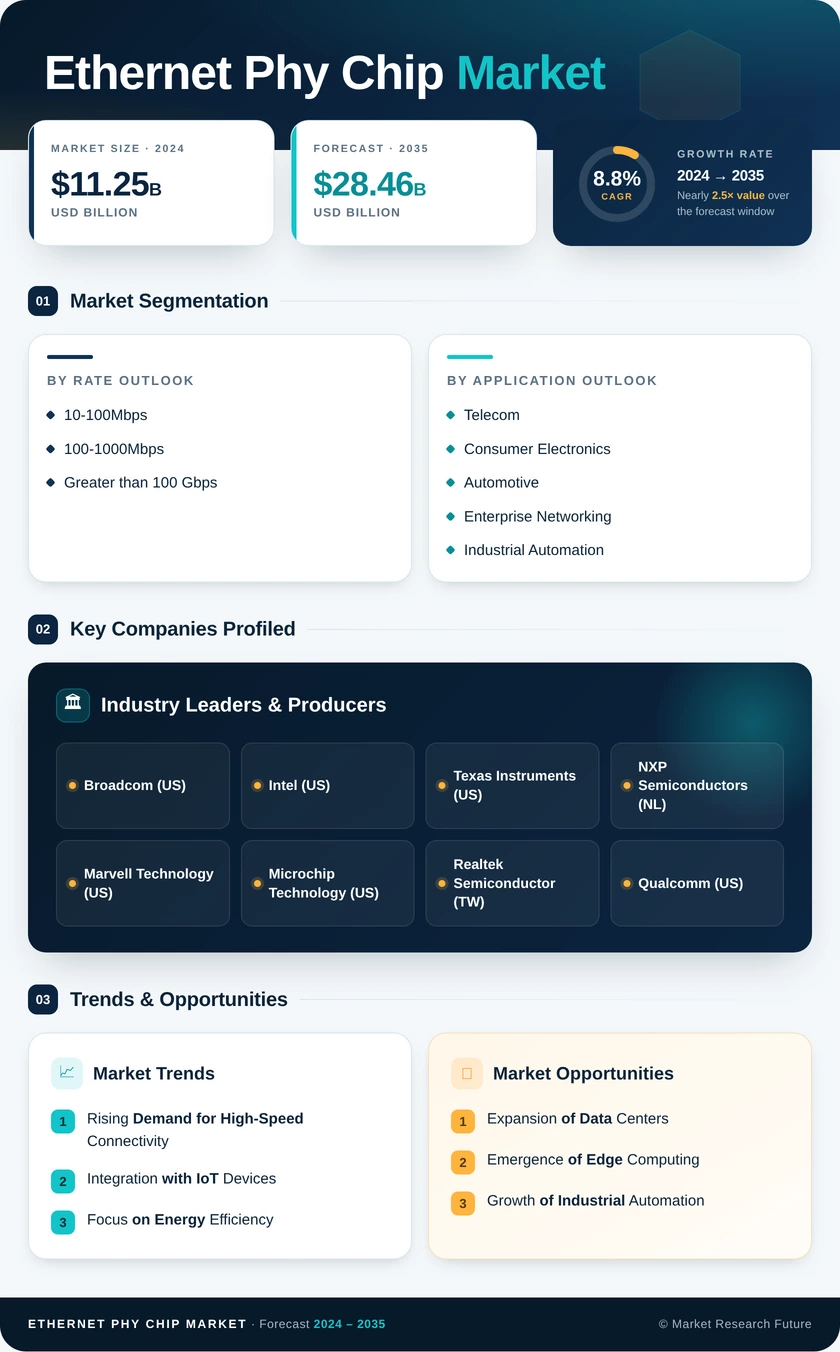
Ethernet PHY Chip Market

ID: MRFR/SEM/5960-CR 142 Pages Nirmit Biswas Last Updated: September 19, 2026
Tamaño del mercado de chips PHY Ethernet, participación e informe de investigación por tasa de datos (10-100Mbps, 100-1000Mbps y más de 100 Gaps), por aplicación (Telecomunicaciones, Electrónica de consumo, Automotriz, Redes empresariales y Automatización industrial) y por región (América del Norte, Europa, Asia-Pacífico y Resto del mundo) – Pronóstico de la industria hasta 2035
Ethernet PHY Chip Market
Market Size
Forecast Period2025 - 2035
CAGR (2025 - 2035)8.8%
2024 Market Size$ 11.25 Billion
2025 Market Size$ 12.24 Billion
2035 Market Size$ 28.46 Billion
Key Players
Broadcom
Intel
Texas Instruments
NXP Semiconductors
Marvell Technology
Microchip Technology
Opportunities
  • Expansion of Data Centers
  • Emergence of Edge Computing
  • Growth of Industrial Automation
  1. 1 Resumen ejecutivo
  2. 2 Introducción al mercado
    1. 2.1 Definición 17
    2. 2.1 Alcance del estudio 17
    3. 2.2 Lista de supuestos 18
    4. 2.3 Estructura del mercado 18
  3. 3 Perspectivas del mercado
  4. 4 Metodología de investigación
    1. 4.1 Proceso de investigación 22
    2. 4.2 Modelo de pronóstico 26
  5. 5 Dinámica del mercado
    1. 5.1 Descripción general 28
    2. 5.2 Impulsores 28
      1. 5.2.1 Mayor adopción de servidores Ethernet de 25 GB en centros de datos 28
      2. 5.2.2 Creciente demanda de conmutadores de alta densidad para conectividad de red 29
    3. 5.3 Oportunidad 30
      1. 5.3.1 Mayor adopción de chips Ethernet PHY en aplicaciones industriales y automotrices 30
    4. 5.4 Restricción 30
      1. 5.4.1 Falta de infraestructura en las economías emergentes 30
  6. 6 Análisis de factores de mercado
    1. 6.1 Análisis de la cadena de valor 34
    2. 6.2 Modelo de las cinco fuerzas de Porter 34
      1. 6.2.1 Amenaza de nuevos participantes 35
      2. 6.2.2 Poder de negociación de los proveedores 35
      3. 6.2.3 Poder de negociación de los compradores 35
      4. 6.2.4 Amenaza de sustitutos 36
      5. 6.2.5 Intensidad de la rivalidad 36
  7. 7 Mercado global de chips Ethernet PHY, por velocidad de datos
    1. 7.1 Descripción general 38
      1. 7.1.1 10/100 Mbps 38
      2. 7.1.2 10/100/1000 Mbps 38
      3. 7.1.3 Mayor o igual a 10 Gbps 38
  8. 8 Mercado global de chips Ethernet PHY, por número de puertos
    1. 8.1 Resumen 42
      1. 8.1.1 Puerto único 42
      2. 8.1.2 Puerto doble 42
      3. 8.1.3 Otros 42
  9. 9 Mercado global de chips Ethernet PHY, por aplicación industrial
    1. 9.1 Resumen 46
      1. 9.1.1 Electrónica de consumo 46
      2. 9.1.2 Automatización industrial 46
      3. 9.1.3 Automotriz 46
      4. 9.1.4 Telecomunicaciones 47
      5. 9.1.5 Centros de datos y redes empresariales 47
  10. 10 Mercado global de chips Ethernet PHY, por región
    1. 10.1 Resumen 51
    2. 10.2 Norteamérica 53
      1. 10.2.1 EE. UU. 59
      2. 10.2.2 Canadá 61
      3. 10.2.3 México 64
    3. 10.3 Europa 67
      1. 10.3.1 Alemania 73
      2. 10.3.2 Reino Unido 76
      3. 10.3.3 Francia 78
      4. 10.3.4 Resto de Europa 81
    4. 10.4 Asia-Pacífico 84
      1. 10.4.1 China 91
      2. 10.4.2 Japón 93
      3. 10.4.3 India 96
      4. 10.4.4 Resto de Asia-Pacífico 99
    5. 10.5 Resto del mundo 102
      1. 10.5.1 Latinoamérica 109
      2. 10.5.2 Oriente Medio y África 112
  11. 11 Panorama competitivo
    1. 11.1 Escenario competitivo 116
  12. 12 Perfiles de empresas
    1. 12.1 Broadcom 119
      1. 12.1.1 Descripción general de la empresa 119
      2. 12.1.2 Descripción financiera 120
      3. 12.1.3 Productos/servicios/soluciones ofrecidos 120
      4. 12.1.4 Desarrollos clave 121
      5. 12.1.5 Análisis FODA 121
      6. 12.1.6 Estrategias clave 121
    2. 12.2 Intel Corporation 122
      1. 12.2.1 Descripción general de la empresa 122
      2. 12.2.2 Descripción financiera 122
      3. 12.2.3 Productos/servicios/soluciones ofrecidos 123
      4. 12.2.4 Desarrollos clave 123
      5. 12.2.5 Análisis FODA 124
      6. 12.2.6 Estrategias clave 124
    3. 12.3 Texas Instruments Incorporated 125
      1. 12.3.1 Descripción general de la empresa 125
      2. 12.3.2 Descripción general financiera 125
      3. 12.3.3 Productos/servicios/soluciones ofrecidos 126
      4. 12.3.4 Desarrollos clave 126
      5. 12.3.5 Análisis FODA 127
      6. 12.3.6 Estrategias clave 127
    4. 12.4 Marvell 128
      1. 12.4.1 Descripción general de la empresa 128
      2. 12.4.2 Descripción general financiera 128
      3. 12.4.3 Productos/servicios/soluciones ofrecidos 129
      4. 12.4.4 Desarrollos clave 129
      5. 12.4.5 Análisis FODA 129
      6. 12.4.6 Estrategias clave 130
    5. 12.5 Microchip Technology Inc. 131
      1. 12.5.1 Descripción general de la empresa 131
      2. 12.5.2 Descripción financiera 131
      3. 12.5.3 Productos/servicios/soluciones ofrecidos 132
      4. 12.5.4 Desarrollos clave 132
      5. 12.5.5 Análisis FODA 132
      6. 12.5.6 Estrategia clave 132
    6. 12.6 Cirrus Logic, Inc. 133
      1. 12.6.1 Descripción general de la empresa 133
      2. 12.6.2 Descripción financiera 133
      3. 12.6.3 Productos/servicios/soluciones ofrecidos 134
      4. 12.6.4 Desarrollos clave 134
      5. 12.6.5 Análisis FODA 134
      6. 12.6.6 Estrategias clave 134
    7. 12.7 NXP Semiconductors 135
      1. 12.7.1 Descripción general de la empresa 135
      2. 12.7.2 Descripción financiera 135
      3. 12.7.3 Productos/servicios/soluciones ofrecidos 136
      4. 12.7.4 Desarrollos clave 136
      5. 12.7.5 Análisis FODA 136
      6. 12.7.6 Estrategias clave 136
    8. 12.8 Silicon Laboratories 137
      1. 12.8.1 Descripción general de la empresa 137
      2. 12.8.2 Descripción financiera 137
      3. 12.8.3 Productos/servicios/soluciones ofrecidos 138
      4. 12.8.4 Desarrollos clave 138
      5. 12.8.5 Análisis FODA 138
      6. 12.8.6 Estrategia clave 138
    9. 12.9 Barefoot Networks 139
      1. 12.9.1 Descripción general de la empresa 139
      2. 12.9.2 Productos/servicios/soluciones ofrecidos 139
      3. 12.9.3 Desarrollos clave 139
    10. 12.10 Davicom Semiconductor Inc. 140
      1. 12.10.1 Descripción general de la empresa 140
      2. 12.10.2 Descripción financiera 140
      3. 12.10.3 Productos/servicios/soluciones ofrecidos 141
      4. 12.10.4 Desarrollos clave 141
      5. 12.10.5 Estrategia clave 141
    11. ?
  13. 13 Lista de tablas
    1. TABLA 1 SINOPSIS DEL MERCADO 15
    2. TABLA 2 LISTA DE SUPUESTOS 18
    3. TABLA 3 TABLA: COMPARACIÓN DE ANCHO DE BANDA PARA 25 GBE Y OTRAS VELOCIDADES DE ETHERNET 28
    4. TABLA 4 MERCADO GLOBAL DE CHIP PHY DE ETHERNET, POR VELOCIDAD DE DATOS, 2023-2032 (MILLONES DE USD) 39
    5. TABLA 5 MERCADO GLOBAL DE CHIP PHY DE ETHERNET, POR VELOCIDAD DE DATOS, 2024-2032 (MILLONES DE USD) 40
    6. TABLA 6 MERCADO GLOBAL DE CHIP PHY DE ETHERNET, POR NÚMERO DE PUERTOS, 2024-2032 (MILLONES DE USD) 43
    7. TABLA 7 MERCADO GLOBAL DE CHIP PHY DE ETHERNET, POR NÚMERO DE PUERTOS, 2024-2032 (MILLONES DE USD) 44
    8. TABLA 8 GLOBAL MERCADO DE CHIP ETHERNET PHY, POR APLICACIÓN INDUSTRIAL, 2024-2032 (MILLONES DE USD) 48
    9. TABLA 9 MERCADO GLOBAL DE CHIP ETHERNET PHY, POR APLICACIÓN INDUSTRIAL, 2024-2032 (MILLONES DE USD) 49
    10. TABLA 10 MERCADO GLOBAL DE CHIP ETHERNET PHY, POR REGIÓN, 2024-2032 (MILLONES DE USD) 51
    11. TABLA 11 MERCADO GLOBAL DE CHIP ETHERNET PHY, POR REGIÓN, 2024-2032 (MILLONES DE USD) 52
    12. TABLA 12 MERCADO DE CHIP ETHERNET PHY EN AMÉRICA DEL NORTE, POR REGIÓN, 2024-2032 (MILLONES DE USD) 54
    13. TABLA 13 MERCADO DE CHIP ETHERNET PHY EN AMÉRICA DEL NORTE, POR REGIÓN, 2024-2032 (USD MILLONES) 54
    14. TABLA 14 MERCADO DE CHIP ETHERNET PHY DE AMÉRICA DEL NORTE, POR VELOCIDAD DE DATOS, 2024-2032 (USD MILLONES) 55
    15. TABLA 15 MERCADO DE CHIP ETHERNET PHY DE AMÉRICA DEL NORTE, POR VELOCIDAD DE DATOS, 2024-2032 (USD MILLONES) 56
    16. TABLA 16 MERCADO DE CHIP ETHERNET PHY DE AMÉRICA DEL NORTE, POR NÚMERO DE PUERTOS, 2024-2032 (USD MILLONES) 56
    17. TABLA 17 MERCADO DE CHIP ETHERNET PHY DE AMÉRICA DEL NORTE, POR NÚMERO DE PUERTOS, 2024-2032 (USD MILLONES) 57
    18. TABLA 18 MERCADO DE CHIP ETHERNET PHY DE AMÉRICA DEL NORTE, POR APLICACIÓN INDUSTRIAL, 2024-2032 (MILLONES DE USD) 58
    19. TABLA 19 MERCADO DE CHIP DE TELÉFONO INALÁMBRICO DE AMÉRICA DEL NORTE, POR APLICACIÓN INDUSTRIAL, 2024-2032 (MILLONES DE USD) 58
    20. TABLA 20 MERCADO DE CHIP DE TELÉFONO INALÁMBRICO DE EE. UU., POR VELOCIDAD DE DATOS, 2024-2032 (MILLONES DE USD) 59
    21. TABLA 21 MERCADO DE CHIP DE TELÉFONO INALÁMBRICO DE EE. UU., POR VELOCIDAD DE DATOS, 2024-2032 (MILLONES DE USD) 59
    22. TABLA 22 MERCADO DE CHIP DE TELÉFONO INALÁMBRICO DE EE. UU., POR NÚMERO DE PUERTOS, 2024-2032 (MILLONES DE USD) 60
    23. TABLA 23 MERCADO DE CHIP DE TELÉFONO INALÁMBRICO DE EE. UU., POR NÚMERO DE PUERTOS, 2024-2032 (USD MILLONES) 60
    24. TABLA 24 MERCADO DE CHIP ETHERNET PHY DE EE. UU., POR APLICACIÓN INDUSTRIAL, 2024-2032 (USD MILLONES) 60
    25. TABLA 25 MERCADO DE CHIP ETHERNET PHY DE EE. UU., POR APLICACIÓN INDUSTRIAL, 2024-2032 (USD MILLONES) 61
    26. TABLA 26 MERCADO DE CHIP ETHERNET PHY DE CANADÁ, POR VELOCIDAD DE DATOS, 2024-2032 (USD MILLONES) 61
    27. TABLA 27 MERCADO DE CHIP ETHERNET PHY DE CANADÁ, POR VELOCIDAD DE DATOS, 2024-2032 (USD MILLONES) 62
    28. TABLA 28 MERCADO DE CHIP ETHERNET PHY DE CANADÁ, POR NÚMERO DE PUERTOS, 2024-2032 (USD MILLONES) 62
    29. TABLA 29 CANADÁ MERCADO DE CHIP ETHERNET PHY, POR NÚMERO DE PUERTOS, 2024-2032 (MILLONES DE USD) 62
    30. TABLA 30 MERCADO DE CHIP ETHERNET PHY DE CANADÁ, POR APLICACIÓN INDUSTRIAL, 2024-2032 (MILLONES DE USD) 63
    31. TABLA 31 MERCADO DE CHIP ETHERNET PHY DE CANADÁ, POR APLICACIÓN INDUSTRIAL, 2024-2032 (MILLONES DE USD) 63
    32. TABLA 32 MERCADO DE CHIP ETHERNET PHY DE MÉXICO, POR VELOCIDAD DE DATOS, 2024-2032 (MILLONES DE USD) 64
    33. TABLA 33 MERCADO DE CHIP ETHERNET PHY DE MÉXICO, POR VELOCIDAD DE DATOS, 2024-2032 (MILLONES DE USD) 64
    34. TABLA 34 MERCADO DE CHIP ETHERNET PHY DE MÉXICO, POR NÚMERO DE PUERTOS, 2024-2032 (USD MILLONES) 64
    35. TABLA 35 MERCADO DE CHIP ETHERNET PHY DE MÉXICO, POR NÚMERO DE PUERTOS, 2024-2032 (USD MILLONES) 65
    36. TABLA 36 MERCADO DE CHIP ETHERNET PHY DE MÉXICO, POR APLICACIÓN INDUSTRIA, 2024-2032 (USD MILLONES) 65
    37. TABLA 37 MERCADO DE CHIP ETHERNET PHY DE MÉXICO, POR APLICACIÓN INDUSTRIA, 2024-2032 (USD MILLONES) 66
    38. TABLA 38 MERCADO DE CHIP ETHERNET PHY DE EUROPA, POR REGIÓN, 2024-2032 (USD MILLONES) 68
    39. TABLA 39 MERCADO DE CHIP ETHERNET PHY DE EUROPA, POR REGIÓN, 2024-2032 (USD MILLONES) 68
    40. TABLA 40 MERCADO EUROPEO DE CHIP ETHERNET PHY, POR VELOCIDAD DE DATOS, 2024-2032 (MILLONES DE USD) 69
    41. TABLA 41 MERCADO EUROPEO DE CHIP ETHERNET PHY, POR VELOCIDAD DE DATOS, 2024-2032 (MILLONES DE USD) 70
    42. TABLA 42 MERCADO EUROPEO DE CHIP ETHERNET PHY, POR NÚMERO DE PUERTOS, 2024-2032 (MILLONES DE USD) 70
    43. TABLA 43 MERCADO EUROPEO DE CHIP ETHERNET PHY, POR NÚMERO DE PUERTOS, 2024-2032 (MILLONES DE USD) 71
    44. TABLA 44 MERCADO EUROPEO DE CHIP ETHERNET PHY, POR APLICACIÓN INDUSTRIAL, 2024-2032 (MILLONES DE USD) 72
    45. TABLA 45 EUROPA MERCADO DE CHIP DE TELÉFONO INALÁMBRICO DE ETHERNET, POR APLICACIÓN INDUSTRIAL, 2024-2032 (MILLONES DE USD) 73
    46. TABLA 46 MERCADO DE CHIP DE TELÉFONO INALÁMBRICO DE ETHERNET, POR VELOCIDAD DE DATOS, 2024-2032 (MILLONES DE USD) 73
    47. TABLA 47 MERCADO DE CHIP DE TELÉFONO INALÁMBRICO DE ETHERNET, POR VELOCIDAD DE DATOS, 2024-2032 (MILLONES DE USD) 74
    48. TABLA 48 MERCADO DE CHIP DE TELÉFONO INALÁMBRICO DE ETHERNET, POR NÚMERO DE PUERTOS, 2024-2032 (MILLONES DE USD) 74
    49. TABLA 49 MERCADO DE CHIP DE TELÉFONO INALÁMBRICO DE ETHERNET, POR NÚMERO DE PUERTOS, 2024-2032 (MILLONES DE USD) 74
    50. TABLA 50 MERCADO DE CHIP DE TELÉFONO INALÁMBRICO DE ETHERNET, POR APLICACIÓN INDUSTRIAL, 2024-2032 (MILLONES DE USD) 75
    51. TABLA 51 MERCADO DE CHIP ETHERNET PHY DE ALEMANIA, POR APLICACIÓN INDUSTRIAL, 2024-2032 (MILLONES DE USD) 75
    52. TABLA 52 MERCADO DE CHIP ETHERNET PHY DEL REINO UNIDO, POR VELOCIDAD DE DATOS, 2024-2032 (MILLONES DE USD) 76
    53. TABLA 53 MERCADO DE CHIP ETHERNET PHY DEL REINO UNIDO, POR VELOCIDAD DE DATOS, 2024-2032 (MILLONES DE USD) 76
    54. TABLA 54 MERCADO DE CHIP ETHERNET PHY DEL REINO UNIDO, POR NÚMERO DE PUERTOS, 2024-2032 (MILLONES DE USD) 77
    55. TABLA 55 MERCADO DE CHIP ETHERNET PHY DEL REINO UNIDO, POR NÚMERO DE PUERTOS, 2024-2032 (MILLONES DE USD) MILLONES) 77
    56. TABLA 56 MERCADO DE CHIP PHY ETHERNET DEL REINO UNIDO, POR APLICACIÓN INDUSTRIAL, 2024-2032 (MILLONES DE USD) 77
    57. TABLA 57 MERCADO DE CHIP PHY ETHERNET DEL REINO UNIDO, POR APLICACIÓN INDUSTRIAL, 2024-2032 (MILLONES DE USD) 78
    58. TABLA 58 MERCADO DE CHIP PHY ETHERNET DE FRANCIA, POR VELOCIDAD DE DATOS, 2024-2032 (MILLONES DE USD) 78
    59. TABLA 59 MERCADO DE CHIP PHY ETHERNET DE FRANCIA, POR VELOCIDAD DE DATOS, 2024-2032 (MILLONES DE USD) 79
    60. TABLA 60 MERCADO DE CHIP PHY ETHERNET DE FRANCIA, POR NÚMERO DE PUERTOS, 2024-2032 (MILLONES DE USD) 79
    61. TABLA 61 ETHERNET DE FRANCIA MERCADO DE CHIP PHY, POR NÚMERO DE PUERTOS, 2024-2032 (MILLONES DE USD) 79
    62. TABLA 62 MERCADO DE CHIP PHY ETHERNET EN FRANCIA, POR APLICACIÓN INDUSTRIAL, 2024-2032 (MILLONES DE USD) 80
    63. TABLA 63 MERCADO DE CHIP PHY ETHERNET EN FRANCIA, POR APLICACIÓN INDUSTRIAL, 2024-2032 (MILLONES DE USD) 80
    64. TABLA 64 MERCADO DE CHIP PHY ETHERNET EN EL RESTO DE EUROPA, POR VELOCIDAD DE DATOS, 2024-2032 (MILLONES DE USD) 81
    65. TABLA 65 MERCADO DE CHIP PHY ETHERNET EN EL RESTO DE EUROPA, POR VELOCIDAD DE DATOS, 2024-2032 (MILLONES DE USD) 81
    66. TABLA 66 MERCADO DE CHIP PHY ETHERNET EN EL RESTO DE EUROPA, POR NÚMERO DE PUERTOS, 2024-2032 (MILLONES DE USD) 82
    67. TABLA 67 RESTO DE EUROPA MERCADO DE CHIP ETHERNET PHY, POR NÚMERO DE PUERTOS, 2024-2032 (MILLONES DE USD) 82
    68. TABLA 68 RESTO DE EUROPA MERCADO DE CHIP ETHERNET PHY, POR APLICACIÓN INDUSTRIAL, 2024-2032 (MILLONES DE USD) 82
    69. TABLA 69 RESTO DE EUROPA MERCADO DE CHIP ETHERNET PHY, POR APLICACIÓN INDUSTRIAL, 2024-2032 (MILLONES DE USD) 83
    70. TABLA 70 MERCADO DE CHIP ETHERNET PHY DE ASIA-PACÍFICO, POR REGIÓN, 2024-2032 (MILLONES DE USD) 85
    71. TABLA 71 MERCADO DE CHIP ETHERNET PHY DE ASIA-PACÍFICO, POR REGIÓN, 2024-2032 (USD MILLONES) 86
    72. TABLA 72 MERCADO DE CHIP ETHERNET PHY DE ASIA-PACÍFICO, POR VELOCIDAD DE DATOS, 2024-2032 (USD MILLONES) 86
    73. TABLA 73 MERCADO DE CHIP ETHERNET PHY DE ASIA-PACÍFICO, POR VELOCIDAD DE DATOS, 2024-2032 (USD MILLONES) 87
    74. TABLA 74 MERCADO DE CHIP ETHERNET PHY DE ASIA-PACÍFICO, POR NÚMERO DE PUERTOS, 2024-2032 (USD MILLONES) 88
    75. TABLA 75 MERCADO DE CHIP ETHERNET PHY DE ASIA-PACÍFICO, POR NÚMERO DE PUERTOS, 2024-2032 (USD MILLONES) 89
    76. TABLA 76 MERCADO DE CHIP ETHERNET PHY DE ASIA-PACÍFICO, POR INDUSTRIA APLICACIÓN, 2024-2032 (MILLONES DE USD) 89
    77. TABLA 77 MERCADO DE CHIP DE TELÉFONO INALÁMBRICO DE ASIA-PACÍFICO, POR APLICACIÓN DE LA INDUSTRIA, 2024-2032 (MILLONES DE USD) 90
    78. TABLA 78 MERCADO DE CHIP DE TELÉFONO INALÁMBRICO DE CHINA, POR VELOCIDAD DE DATOS, 2024-2032 (MILLONES DE USD) 91
    79. TABLA 79 MERCADO DE CHIP DE TELÉFONO INALÁMBRICO DE CHINA, POR VELOCIDAD DE DATOS, 2024-2032 (MILLONES DE USD) 91
    80. TABLA 80 MERCADO DE CHIP DE TELÉFONO INALÁMBRICO DE CHINA, POR NÚMERO DE PUERTOS, 2024-2032 (MILLONES DE USD) 91
    81. TABLA 81 MERCADO DE CHIP DE TELÉFONO INALÁMBRICO DE CHINA, POR NÚMERO DE PUERTOS, 2024-2032 (MILLONES DE USD) MILLONES) 92
    82. TABLA 82 MERCADO DE CHIP ETHERNET PHY DE CHINA, POR APLICACIÓN INDUSTRIAL, 2024-2032 (MILLONES DE USD) 92
    83. TABLA 83 MERCADO DE CHIP ETHERNET PHY DE CHINA, POR APLICACIÓN INDUSTRIAL, 2024-2032 (MILLONES DE USD) 92
    84. TABLA 84 MERCADO DE CHIP ETHERNET PHY DE JAPÓN, POR VELOCIDAD DE DATOS, 2024-2032 (MILLONES DE USD) 93
    85. TABLA 85 MERCADO DE CHIP ETHERNET PHY DE JAPÓN, POR VELOCIDAD DE DATOS, 2024-2032 (MILLONES DE USD) 93
    86. TABLA 86 MERCADO DE CHIP ETHERNET PHY DE JAPÓN, POR NÚMERO DE PUERTOS, 2024-2032 (MILLONES DE USD) 94
    87. TABLA 87 JAPÓN MERCADO DE CHIP ETHERNET PHY, POR NÚMERO DE PUERTOS, 2024-2032 (MILLONES DE USD) 94
    88. TABLA 88 MERCADO DE CHIP ETHERNET PHY DE JAPÓN, POR APLICACIÓN INDUSTRIAL, 2024-2032 (MILLONES DE USD) 95
    89. TABLA 89 MERCADO DE CHIP ETHERNET PHY DE JAPÓN, POR APLICACIÓN INDUSTRIAL, 2024-2032 (MILLONES DE USD) 95
    90. TABLA 90 MERCADO DE CHIP ETHERNET PHY DE INDIA, POR VELOCIDAD DE DATOS, 2024-2032 (MILLONES DE USD) 96
    91. TABLA 91 MERCADO DE CHIP ETHERNET PHY DE INDIA, POR VELOCIDAD DE DATOS, 2024-2032 (MILLONES DE USD) 96
    92. TABLA 92 MERCADO DE CHIP ETHERNET PHY DE INDIA, POR NÚMERO DE PUERTOS, 2024-2032 (USD MILLONES) 96
    93. TABLA 93 MERCADO DE CHIP ETHERNET PHY DE INDIA, POR NÚMERO DE PUERTOS, 2024-2032 (USD MILLONES) 97
    94. TABLA 94 MERCADO DE CHIP ETHERNET PHY DE INDIA, POR APLICACIÓN INDUSTRIA, 2024-2032 (USD MILLONES) 97
    95. TABLA 95 MERCADO DE CHIP ETHERNET PHY DE INDIA, POR APLICACIÓN INDUSTRIA, 2024-2032 (USD MILLONES) 98
    96. TABLA 96 RESTO DEL MERCADO DE CHIP ETHERNET PHY DE ASIA-PACÍFICO, POR VELOCIDAD DE DATOS, 2024-2032 (USD MILLONES) 99
    97. TABLA 97 RESTO DEL MERCADO DE CHIP ETHERNET PHY DE ASIA-PACÍFICO, POR VELOCIDAD DE DATOS, 2024-2032 (USD MILLONES) 99
    98. TABLA 98 RESTO DEL MERCADO DE CHIP ETHERNET PHY DE ASIA-PACÍFICO, POR NÚMERO DE PUERTOS, 2024-2032 (USD MILLONES) 100
    99. TABLA 99 RESTO DEL MERCADO DE CHIP ETHERNET PHY DE ASIA-PACÍFICO, POR NÚMERO DE PUERTOS, 2024-2032 (USD MILLONES) 100
    100. TABLA 100 RESTO DEL MERCADO DE CHIP ETHERNET PHY DE ASIA-PACÍFICO, POR APLICACIÓN INDUSTRIAL, 2024-2032 (USD MILLONES) 100
    101. TABLA 101 RESTO DEL MERCADO DE CHIP ETHERNET PHY DE ASIA-PACÍFICO, POR APLICACIÓN INDUSTRIAL, 2024-2032 (USD MILLONES) 101
    102. TABLA 102 RESTO DE MERCADO MUNDIAL DE CHIPS ETHERNET PHY, POR REGIÓN, 2024-2032 (MILLONES DE USD) 103
    103. TABLA 103 RESTO DEL MERCADO MUNDIAL DE CHIPS ETHERNET PHY, POR REGIÓN, 2024-2032 (MILLONES DE USD) 104
    104. TABLA 104 RESTO DEL MERCADO MUNDIAL DE CHIPS ETHERNET PHY, POR VELOCIDAD DE DATOS, 2024-2032 (MILLONES DE USD) 104
    105. TABLA 105 RESTO DEL MERCADO MUNDIAL DE CHIPS ETHERNET PHY, POR VELOCIDAD DE DATOS, 2024-2032 (MILLONES DE USD) 105
    106. TABLA 106 RESTO DEL MERCADO MUNDIAL DE CHIPS ETHERNET PHY, POR NÚMERO DE PUERTOS, 2024-2032 (MILLONES DE USD) 106
    107. TABLA 107 RESTO DEL MERCADO MUNDIAL DE CHIP ETHERNET PHY, POR NÚMERO DE PUERTOS, 2024-2032 (MILLONES DE USD) 107
    108. TABLA 108 RESTO DEL MERCADO MUNDIAL DE CHIP ETHERNET PHY, POR APLICACIÓN INDUSTRIAL, 2024-2032 (MILLONES DE USD) 108
    109. TABLA 109 RESTO DEL MERCADO MUNDIAL DE CHIP ETHERNET PHY, POR APLICACIÓN INDUSTRIAL, 2024-2032 (MILLONES DE USD) 109
    110. TABLA 110 MERCADO DE CHIP ETHERNET PHY DE AMÉRICA LATINA, POR VELOCIDAD DE DATOS, 2024-2032 (MILLONES DE USD) 109
    111. TABLA 111 MERCADO DE CHIP ETHERNET PHY DE AMÉRICA LATINA, POR VELOCIDAD DE DATOS, 2024-2032 (USD MILLONES) 110
    112. TABLA 112 MERCADO DE CHIP ETHERNET PHY DE AMÉRICA LATINA, POR NÚMERO DE PUERTOS, 2024-2032 (USD MILLONES) 110
    113. TABLA 113 MERCADO DE CHIP ETHERNET PHY DE AMÉRICA LATINA, POR NÚMERO DE PUERTOS, 2024-2032 (USD MILLONES) 110
    114. TABLA 114 MERCADO DE CHIP ETHERNET PHY DE AMÉRICA LATINA, POR APLICACIÓN INDUSTRIAL, 2024-2032 (USD MILLONES) 111
    115. TABLA 115 MERCADO DE CHIP ETHERNET PHY DE AMÉRICA LATINA, POR APLICACIÓN INDUSTRIAL, 2024-2032 (USD MILLONES) 111
    116. TABLA 116 ORIENTE MEDIO Y MERCADO DE CHIP ETHERNET PHY DE ÁFRICA, POR VELOCIDAD DE DATOS, 2024-2032 (MILLONES DE USD) 112
    117. TABLA 117 MERCADO DE CHIP ETHERNET PHY DE ORIENTE MEDIO Y ÁFRICA, POR VELOCIDAD DE DATOS, 2024-2032 (MILLONES DE USD) 112
    118. TABLA 118 MERCADO DE CHIP ETHERNET PHY DE ORIENTE MEDIO Y ÁFRICA, POR NÚMERO DE PUERTOS, 2024-2032 (MILLONES DE USD) 113
    119. TABLA 119 MERCADO DE CHIP ETHERNET PHY DE ORIENTE MEDIO Y ÁFRICA, POR NÚMERO DE PUERTOS, 2024-2032 (MILLONES DE USD) 113
    120. TABLA 120 MERCADO DE CHIP ETHERNET PHY DE ORIENTE MEDIO Y ÁFRICA, POR NÚMERO DE PUERTOS, 2024-2032 (MILLONES DE USD) 113
    121. TABLA 120 MERCADO DE CHIP ETHERNET PHY EN ÁFRICA, POR APLICACIÓN INDUSTRIAL, 2024-2032 (MILLONES DE USD) 113
    122. TABLA 121 MERCADO DE CHIP ETHERNET PHY EN ORIENTE MEDIO Y ÁFRICA, POR APLICACIÓN INDUSTRIAL, 2024-2032 (MILLONES DE USD) 114
    123. ?
  14. 14 Lista de figuras
    1. FIGURA 1 MERCADO MUNDIAL DE CHIP ETHERNET PHY: ESTRUCTURA DEL MERCADO 18
    2. FIGURA 2 TAMAÑO DEL MERCADO MUNDIAL Y CUOTA DE MERCADO POR REGIÓN/PAÍS (2020 VS 2027) 20
    3. FIGURA 3 DE ARRIBA HACIA ABAJO Y ENFOQUE DE ABAJO HACIA ARRIBA 25
    4. FIGURA 4 ADOPCIÓN DE ENVÍOS DE SERVIDORES 29
    5. FIGURA 5 CADENA DE VALOR: MERCADO GLOBAL DE CHIP ETHERNET PHY 34
    6. FIGURA 6 ANÁLISIS DE LAS CINCO FUERZAS DE PORTER DEL MERCADO GLOBAL DE CHIP ETHERNET PHY 35
    7. FIGURA 7 MERCADO GLOBAL DE CHIP ETHERNET PHY, POR VELOCIDAD DE DATOS, 2013 A 2032 (MILLONES DE USD) 39
    8. FIGURA 8 MERCADO GLOBAL DE CHIP ETHERNET PHY, POR VELOCIDAD DE DATOS, 2024-2032 (MILLONES DE USD) 39
    9. FIGURA 9 MERCADO GLOBAL DE CHIP ETHERNET PHY, POR NÚMERO DE PUERTOS, 2024-2032 (MILLONES DE USD) 43
    10. FIGURA 10 MERCADO GLOBAL DE CHIPS DE NETWORK PHY, POR NÚMERO DE PUERTOS, 2024-2032 (MILLONES DE USD) 43
    11. FIGURA 11 MERCADO GLOBAL DE CHIPS DE NETWORK PHY, POR APLICACIÓN INDUSTRIAL, 2024-2032 (MILLONES DE USD) 48
    12. FIGURA 12 MERCADO GLOBAL DE CHIPS DE NETWORK PHY, POR APLICACIÓN INDUSTRIAL, 2024-2032 (MILLONES DE USD) 48
    13. FIGURA 13 MERCADO GLOBAL DE CHIPS DE NETWORK PHY, POR REGIÓN, 2024-2032 (MILLONES DE USD) 51
    14. FIGURA 14 MERCADO GLOBAL DE CHIPS DE NETWORK PHY, POR REGIÓN, 2024-2032 (MILLONES DE USD) 52
    15. FIGURA 15 MERCADO DE CHIP ETHERNET PHY DE AMÉRICA DEL NORTE, POR REGIÓN, 2024-2032 (MILLONES DE USD) 53
    16. FIGURA 16 MERCADO DE CHIP ETHERNET PHY DE AMÉRICA DEL NORTE, POR REGIÓN, 2024-2032 (MILLONES DE USD) 54
    17. FIGURA 17 MERCADO DE CHIP ETHERNET PHY DE AMÉRICA DEL NORTE, POR VELOCIDAD DE DATOS, 2024-2032 (MILLONES DE USD) 55
    18. FIGURA 18 MERCADO DE CHIP ETHERNET PHY DE AMÉRICA DEL NORTE, POR VELOCIDAD DE DATOS, 2024-2032 (MILLONES DE USD) 55
    19. FIGURA 19 MERCADO DE CHIP ETHERNET PHY DE AMÉRICA DEL NORTE, POR NÚMERO DE PUERTOS, 2024-2032 (MILLONES DE USD) MILLONES) 56
    20. FIGURA 20 MERCADO DE CHIP ETHERNET PHY DE AMÉRICA DEL NORTE, POR NÚMERO DE PUERTOS, 2024-2032 (MILLONES DE USD) 57
    21. FIGURA 21 MERCADO DE CHIP ETHERNET PHY DE AMÉRICA DEL NORTE, POR APLICACIÓN INDUSTRIAL, 2024-2032 (MILLONES DE USD) 57
    22. FIGURA 22 MERCADO DE CHIP ETHERNET PHY DE AMÉRICA DEL NORTE, POR APLICACIÓN INDUSTRIAL, 2024-2032 (MILLONES DE USD) 58
    23. FIGURA 23 MERCADO DE CHIP ETHERNET PHY DE EUROPA, POR REGIÓN, 2024-2032 (MILLONES DE USD) 67
    24. FIGURA 24 MERCADO DE CHIP ETHERNET PHY DE EUROPA, POR REGIÓN, 2024-2032 (USD MILLONES) 68
    25. FIGURA 25 MERCADO EUROPEO DE CHIP ETHERNET PHY, POR VELOCIDAD DE DATOS, 2024-2032 (USD MILLONES) 69
    26. FIGURA 26 MERCADO EUROPEO DE CHIP ETHERNET PHY, POR VELOCIDAD DE DATOS, 2024-2032 (USD MILLONES) 69
    27. FIGURA 27 MERCADO EUROPEO DE CHIP ETHERNET PHY, POR NÚMERO DE PUERTOS, 2024-2032 (USD MILLONES) 70
    28. FIGURA 28 MERCADO EUROPEO DE CHIP ETHERNET PHY, POR NÚMERO DE PUERTOS, 2024-2032 (USD MILLONES) 71
    29. FIGURA 29 MERCADO EUROPEO DE CHIP ETHERNET PHY, POR APLICACIÓN INDUSTRIAL, 2024-2032 (USD MILLONES) 72
    30. FIGURA 30 MERCADO EUROPEO DE CHIPS ETHERNET PHY, POR APLICACIÓN INDUSTRIAL, 2024-2032 (MILLONES DE USD) 72
    31. FIGURA 31 MERCADO DE CHIPS ETHERNET PHY DE ASIA-PACÍFICO, POR REGIÓN, 2024-2032 (MILLONES DE USD) 85
    32. FIGURA 32 MERCADO DE CHIPS ETHERNET PHY DE ASIA-PACÍFICO, POR REGIÓN, 2024-2032 (MILLONES DE USD) 85
    33. FIGURA 33 MERCADO DE CHIPS ETHERNET PHY DE ASIA-PACÍFICO, POR VELOCIDAD DE DATOS, 2024-2032 (MILLONES DE USD) 86
    34. FIGURA 34 MERCADO DE CHIPS ETHERNET PHY DE ASIA-PACÍFICO, POR VELOCIDAD DE DATOS, 2024-2032 (MILLONES DE USD) 87
    35. FIGURA 35 MERCADO DE CHIP ETHERNET PHY DE ASIA-PACÍFICO, POR NÚMERO DE PUERTOS, 2024-2032 (MILLONES DE USD) 88
    36. FIGURA 36 MERCADO DE CHIP ETHERNET PHY DE ASIA-PACÍFICO, POR NÚMERO DE PUERTOS, 2024-2032 (MILLONES DE USD) 88
    37. FIGURA 37 MERCADO DE CHIP ETHERNET PHY DE ASIA-PACÍFICO, POR APLICACIÓN INDUSTRIAL, 2024-2032 (MILLONES DE USD) 89
    38. FIGURA 38 MERCADO DE CHIP ETHERNET PHY DE ASIA-PACÍFICO, POR APLICACIÓN INDUSTRIAL, 2024-2032 (MILLONES DE USD) 90
    39. FIGURA 39 MERCADO DE CHIP ETHERNET PHY DEL RESTO DEL MUNDO, POR REGIÓN, 2024-2032 (USD MILLONES) 103
    40. FIGURA 40 RESTO DEL MUNDO MERCADO DE CHIP ETHERNET PHY, POR REGIÓN, 2024-2032 (USD MILLONES) 103
    41. FIGURA 41 RESTO DEL MUNDO MERCADO DE CHIP ETHERNET PHY, POR VELOCIDAD DE DATOS, 2024-2032 (USD MILLONES) 104
    42. FIGURA 42 RESTO DEL MUNDO MERCADO DE CHIP ETHERNET PHY, POR VELOCIDAD DE DATOS, 2024-2032 (USD MILLONES) 105
    43. FIGURA 43 RESTO DEL MUNDO MERCADO DE CHIP ETHERNET PHY, POR NÚMERO DE PUERTOS, 2024-2032 (USD MILLONES) 106
    44. FIGURA 44 RESTO DEL MUNDO MERCADO DE CHIP ETHERNET PHY, POR NÚMERO DE PUERTOS, 2024-2032 (MILLONES DE USD) 107
    45. FIGURA 45 MERCADO DE CHIP ETHERNET PHY EN EL RESTO DEL MUNDO, POR APLICACIÓN INDUSTRIAL, 2024-2032 (MILLONES DE USD) 108
    46. FIGURA 46 MERCADO DE CHIP ETHERNET PHY EN EL RESTO DEL MUNDO, POR APLICACIÓN INDUSTRIAL, 2024-2032 (MILLONES DE USD) 108
    47. FIGURA 47 ANÁLISIS COMPETITIVO DE LOS ACTORES CLAVE 117

Segmentación del mercado de chips Ethernet PHY

Perspectiva de la velocidad de datos de los chips Ethernet PHY (miles de millones de USD, 2018-2032)

  • 10-100 Mbps

  • 100-1000 Mbps

  • Más de 100 brechas

Perspectiva de la aplicación de los chips Ethernet PHY(miles de millones de USD, 2018-2032)

  • Telecomunicaciones

  • Electrónica de consumo

  • Automoción

  • Empresas Redes

  • Automatización industrial

Perspectiva regional del chip PHY de Ethernet (miles de millones de USD, 2018-2032)

  • Perspectiva de Norteamérica (miles de millones de USD, 2018-2032)

    • NorteaméricaChip PHY de Ethernet por velocidad de datos

      • 10-100 Mbps

      • 100-1000 Mbps

      • Más de 100 brechas

    • NorteaméricaChip PHY de Ethernet por Aplicación

      • Telecomunicaciones

      • Electrónica de consumo

      • Automoción

      • Redes empresariales

      • Automatización industrial

    • Perspectivas para EE. UU. (miles de millones de USD, 2018-2032)

    • Chip físico Ethernet de EE. UU. por velocidad de datos

      • 10-100 Mbps

      • 100-1000 Mbps

      • Más de 100 Brechas

    • EE. UU.Chip PHY Ethernet por aplicación

      • Telecomunicaciones

      • Electrónica de consumo

      • Automoción

      • Redes empresariales

      • Automatización industrial

    • Perspectivas para Canadá (miles de millones de USD, 2018-2032)

    • CANADÁChip PHY Ethernet por datos Velocidad

      • 10-100 Mbps

      • 100-1000 Mbps

      • Más de 100 brechas

    • CANADÁChip PHY Ethernet por aplicación

      • Telecomunicaciones

      • Electrónica de consumo

      • Automoción

      • Redes empresariales

      • Automatización industrial

  • Perspectivas para Europa (miles de millones de USD, 2018-2032)

    • EuropaChip PHY Ethernet por velocidad de datos

      • 10-100 Mbps

      • 100-1000 Mbps

      • Más de 100 brechas

    • EuropaChip PHY Ethernet por aplicación

      • Telecomunicaciones

      • Electrónica de consumo

      • Automoción

      • Redes empresariales

      • Industrial Automatización

    • Alemania Perspectivas (miles de millones de USD, 2018-2032)

    • AlemaniaChip PHY Ethernet por velocidad de datos

      • 10-100 Mbps

      • 100-1000 Mbps

      • Más de 100 brechas

    • AlemaniaChip PHY Ethernet por aplicación

      • Telecomunicaciones

      • Consumidor Electrónica

      • Automoción

      • Redes empresariales

      • Automatización industrial

    • Perspectivas para Francia (miles de millones de USD, 2018-2032)

    • FranciaChip PHY Ethernet por velocidad de datos

      • 10-100 Mbps

      • 100-1000 Mbps

      • Más de 100 brechas

    • FranciaChip PHY Ethernet por Aplicación

      • Telecomunicaciones

      • Electrónica de consumo

      • Automoción

      • Redes empresariales

      • Automatización industrial

    • Perspectivas para el Reino Unido (miles de millones de USD, 2018-2032)

    • Chip Ethernet PHY del Reino Unido por velocidad de datos

      • 10-100 Mbps

      • 100-1000 Mbps

      • Más de 100 Brechas

    • Reino UnidoChip PHY Ethernet por aplicación

      • Telecomunicaciones

      • Electrónica de consumo

      • Automoción

      • Redes empresariales

      • Automatización industrial

    • Perspectivas para Italia (miles de millones de USD, 2018-2032)

    • ITALIAChip PHY Ethernet por datos Velocidad

      • 10-100 Mbps

      • 100-1000 Mbps

      • Más de 100 Gaps

    • ITALIAChip PHY Ethernet por aplicación

      • Telecomunicaciones

      • Electrónica de consumo

      • Automoción

      • Redes empresariales

      • Automatización industrial

    • ESPAÑA Perspectivas (miles de millones de USD, 2018-2032)

    • EspañaChip PHY Ethernet por velocidad de datos

      • 10-100 Mbps

      • 100-1000 Mbps

      • Más de 100 huecos

    • EspañaChip PHY Ethernet por aplicación

      • Telecomunicaciones

      • Electrónica de consumo

      • Automoción

      • Redes empresariales

      • Industrial Automatización

    • Perspectivas para el resto de Europa (miles de millones de USD, 2018-2032)

    • Resto de EuropaChip PHY Ethernet por velocidad de datos

      • 10-100 Mbps

      • 100-1000 Mbps

      • Más de 100 brechas

    • RESTO DE EUROPAChip PHY Ethernet por aplicación

      • Telecomunicaciones

      • Consumidor Electrónica

      • Automotriz

      • Redes empresariales

      • Automatización industrial

  • Perspectivas para Asia-Pacífico (miles de millones de USD, 2018-2032)

    • Asia-PacíficoChip físico Ethernet por velocidad de datos

      • 10-100 Mbps

      • 100-1000 Mbps

      • Más de 100 brechas

    • Asia-Pacífico Chip Ethernet PHY por aplicación

      • Telecomunicaciones

      • Electrónica de consumo

      • Automoción

      • Redes empresariales

      • Automatización industrial

    • Perspectivas de China (miles de millones de USD, 2018-2032)

    • ChinaChip Ethernet PHY por velocidad de datos

      • 10-100 Mbps

      • 100-1000 Mbps

      • Más de 100 Brechas

    • ChinaChip PHY Ethernet por aplicación

      • Telecomunicaciones

      • Electrónica de consumo

      • Automoción

      • Redes empresariales

      • Automatización industrial

    • Perspectivas para Japón (miles de millones de USD, 2018-2032)

    • JapónChip PHY Ethernet por datos Velocidad

      • 10-100 Mbps

      • 100-1000 Mbps

      • Más de 100 brechas

    • JapónChip PHY Ethernet por aplicación

      • Telecomunicaciones

      • Electrónica de consumo

      • Automoción

      • Redes empresariales

      • Automatización industrial

    • Perspectivas para India (miles de millones de USD, 2018-2032)

    • IndiaChip PHY Ethernet por velocidad de datos

      • 10-100 Mbps

      • 100-1000 Mbps

      • Más de 100 brechas

    • IndiaChip PHY Ethernet por aplicación

      • Telecomunicaciones

      • Electrónica de consumo

      • Automoción

      • Redes empresariales

      • Industrial Automatización

    • Perspectivas de Australia (miles de millones de USD, 2018-2032)

    • AustraliaChip PHY Ethernet por velocidad de datos

      • 10-100 Mbps

      • 100-1000 Mbps

      • Más de 100 brechas

    • AustraliaChip PHY Ethernet por aplicación

      • Telecomunicaciones

      • Consumidor Electrónica

      • Automoción

      • Redes empresariales

      • Automatización industrial

    • Perspectivas para el resto de Asia-Pacífico (miles de millones de USD, 2018-2032)

    • Resto de Asia-PacíficoChip PHY Ethernet por velocidad de datos

      • 10-100 Mbps

      • 100-1000 Mbps

      • Más de 100 brechas

    • Resto de Asia-PacíficoChip PHY Ethernet Por aplicación

      • Telecomunicaciones

      • Electrónica de consumo

      • Automoción

      • Redes empresariales

      • Automatización industrial

  • Perspectiva para el resto del mundo (miles de millones de USD, 2018-2032)

    • Resto del mundoChip Ethernet PHY por velocidad de datos

      • 10-100 Mbps

      • 100-1000 Mbps

      • Más de 100 Brechas

    • Resto del mundoChip Ethernet PHY por aplicación

      • Telecomunicaciones

      • Electrónica de consumo

      • Automoción

      • Redes empresariales

      • Automatización industrial

    • Perspectivas para Oriente Medio (miles de millones de USD, 2018-2032)

    • Oriente MedioChip Ethernet PHY por datos Velocidad

      • 10-100 Mbps

      • 100-1000 Mbps

      • Más de 100 brechas

    • Oriente MedioChip PHY Ethernet por aplicación

      • Telecomunicaciones

      • Electrónica de consumo

      • Automoción

      • Redes empresariales

      • Automatización industrial

    • Perspectivas para África (miles de millones de USD, 2018-2032)

    • ÁfricaChip PHY Ethernet por velocidad de datos

      • 10-100 Mbps

      • 100-1000 Mbps

      • Más de 100 brechas

    • ÁfricaChip PHY Ethernet por aplicación

      • Telecomunicaciones

      • Electrónica de consumo

      • Automoción

      • Redes empresariales

      • Industrial Automatización

    • Perspectivas para América Latina (miles de millones de USD, 2018-2032)

    • Chip PHY Ethernet en América Latina por velocidad de datos

      • 10-100 Mbps

      • 100-1000 Mbps

      • Más de 100 brechas

    • Chip PHY Ethernet en América Latina por aplicación

      • Telecomunicaciones

      • Consumidor Electrónica

      • Automoción

      • Redes empresariales

      • Automatización industrial

Download PDF ×

We do not share your information with anyone. However, we may send you emails based on your report interest from time to time. You may contact us at any time to opt-out.