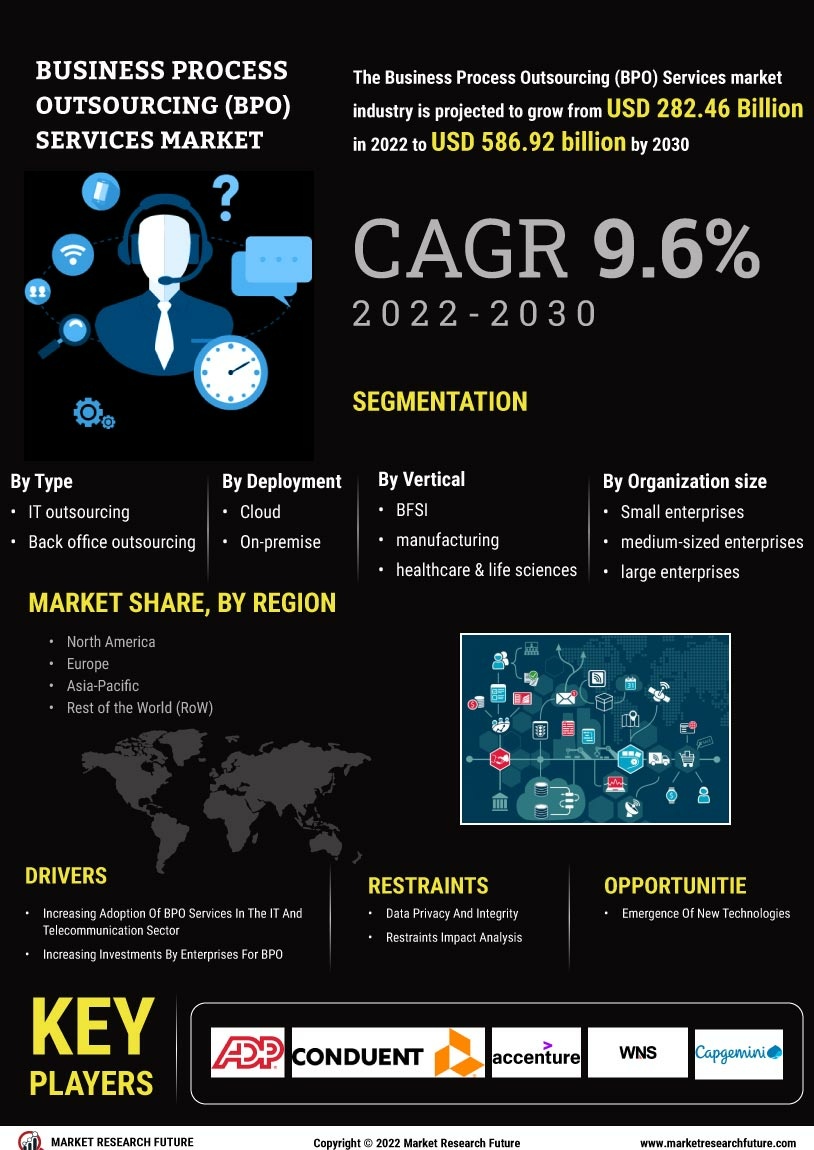
Business Process Outsourcing Services Market
Market Size
Key Players
- Technological Integration
- Focus on Core Competencies
- Emphasis on Data Security
- Cost Efficiency
- Regulatory Compliance
- Technological Advancements
-
1 Resumen ejecutivo
- 1.1 Análisis del atractivo del mercado
-
2 Introducción al mercado
- 2.1 Definición
- 2.2 Alcance del estudio
- 2.3 Estructura del mercado
-
3 Metodología de investigación
- 3.1 Proceso de investigación
- 3.2 Investigación primaria
- 3.3 Investigación secundaria
- 3.4 Estimación del tamaño del mercado
- 3.5 Modelo de pronóstico
- 3.6 Lista de supuestos
- 4 Perspectivas del mercado
-
5 Dinámica del mercado
- 5.1 Introducción
-
5.2 Impulsores
- 5.2.1 Creciente adopción de servicios de BPO en el sector de TI y telecomunicaciones
- 5.2.2 Aumento de las inversiones de las empresas en BPO
- 5.2.3 Análisis del impacto de los impulsores
-
5.3 Restricciones
- 5.3.1 Privacidad e integridad de los datos
- 5.3.2 Análisis del impacto de las restricciones
-
5.4 Oportunidades
- 5.4.1 Surgimiento de nuevas tecnologías
-
5.5 Tendencias tecnológicas
- 5.5.1 Tecnología de computación en la nube y oferta de BPaaS
- 5.5.2 Big data y análisis
-
6 Análisis de factores de mercado
-
6.1 Análisis de la cadena de valor
- 6.1.1 Tecnología y Proveedores de software
- 6.1.2 Proveedores de servicios BPO
- 6.1.3 Usuarios finales
-
6.2 Modelo de las cinco fuerzas de Porter
- 6.2.1 Amenaza de nuevos participantes
- 6.2.2 Poder de negociación de los proveedores
- 6.2.3 Amenaza de sustitutos
- 6.2.4 Poder de negociación de los compradores
- 6.2.5 Rivalidad competitiva
-
6.1 Análisis de la cadena de valor
-
7 Mercado global de servicios BPO, por tipo
- 7.1 Descripción general
- 7.2 Subcontratación de TI
- 7.3 Subcontratación de finanzas y contabilidad
- 7.4 Subcontratación de back office
- 7.5 Servicios de soporte de comercio electrónico
- 7.6 Subcontratación de capacitación y desarrollo
- 7.7 Subcontratación de capacitación y desarrollo Subcontratación de desarrollo
- 7.8 Otros
-
8 Mercado global de servicios de BPO por implementación
- 8.1 Descripción general
- 8.2 Nube
- 8.3 Local
-
9 Mercado global de servicios de BPO por tamaño de organización
- 9.1 Descripción general
- 9.2 Pequeñas y medianas empresas
- 9.3 Grandes empresas
-
10 Mercado global de servicios de BPO por sector vertical
- 10.1 Descripción general
- 10.2 Banca, servicios financieros y seguros (BFSI)
- 10.3 TI y telecomunicaciones
- 10.4 Comercio minorista y bienes de consumo
- 10.5 Manufactura
- 10.6 Salud y ciencias biológicas
- 10.7 Gobierno y defensa
- 10.8 Otros
-
11 Mercado global de servicios de BPO por región
- 11.1 Descripción general
-
11.2 Norteamérica
- 11.2.1 EE. UU.
- 11.2.2 Canadá
- 11.2.3 México
-
11.3 Asia-Pacífico
- 11.3.1 China
- 11.3.2 Japón
- 11.3.3 India
- 11.3.4 Resto de Asia-Pacífico
-
11.4 Europa
- 11.4.1 Alemania
- 11.4.2 Reino Unido
- 11.4.3 Francia
- 11.4.4 Resto de Europa
- 11.5 Medio Oriente y África
- 11.6 Sudamérica
-
12 Panorama competitivo
- 12.1 Descripción general competitiva
- 12.2 Estrategia de crecimiento principal en el mercado global de servicios de BPO
- 12.3 Benchmarking competitivo
- 12.4 Panel: Los actores líderes en el mercado global de servicios de subcontratación de procesos de negocios (BPO)
-
12.5 Desarrollos clave y Estrategias de crecimiento
- 12.5.1 Lanzamiento de nuevos productos/Implementación de servicios
- 12.5.2 Fusión y Adquisición
-
13 Perfil de la empresa
-
13.1 ADP, LLC
- 13.1.1 Descripción general de la empresa
- 13.1.2 Descripción financiera
- 13.1.3 Productos/servicios/soluciones ofrecidos
- 13.1.4 Desarrollos clave
- 13.1.5 Análisis FODA
- 13.1.6 Estrategias clave
-
13.2 Conduent Inc.
- 13.2.1 Descripción general de la empresa
- 13.2.2 Descripción financiera
- 13.2.3 Productos/servicios/soluciones ofrecidos
- 13.2.4 Desarrollos clave
- 13.2.5 Análisis FODA
- 13.2.6 Estrategias clave
-
13.3 Accenture PLC
- 13.3.1 Descripción general de la empresa
- 13.3.2 Descripción financiera
- 13.3.3 Productos/servicios/soluciones ofrecidos Ofertas
- 13.3.4 Desarrollos Clave
- 13.3.5 Análisis FODA
- 13.3.6 Estrategias Clave
-
13.4 WNS (Holdings) Ltd
- 13.4.1 Descripción General de la Empresa
- 13.4.2 Descripción Financiera
- 13.4.3 Productos/Servicios/Soluciones Ofertas
- 13.4.4 Desarrollos Clave
- 13.4.5 Análisis FODA
- 13.4.6 Estrategias Clave
-
13.5 Capgemini
- 13.5.1 Descripción General de la Empresa
- 13.5.2 Descripción Financiera
- 13.5.3 Productos/Servicios/Soluciones Ofertas
- 13.5.4 Desarrollos Clave
- 13.5.5 Análisis FODA
- 13.5.6 Estrategias Clave
-
13.6 Infosys BPM Limited
- 13.6.1 Descripción general de la empresa
- 13.6.2 Descripción financiera
- 13.6.3 Productos/servicios/soluciones ofrecidos
- 13.6.4 Desarrollos clave
- 13.6.5 Análisis FODA
- 13.6.6 Estrategias clave
-
13.7 IBM Corporation
- 13.7.1 Descripción general de la empresa
- 13.7.2 Descripción financiera
- 13.7.3 Productos/servicios/soluciones ofrecidos
- 13.7.4 Desarrollos clave
- 13.7.5 Análisis FODA
- 13.7.6 Estrategias clave
-
13.8 Tata Consultancy Services Limited
- 13.8.1 Descripción general de la empresa
- 13.8.2 Descripción financiera
- 13.8.3 Productos/servicios/soluciones ofrecidos
- 13.8.4 Desarrollos clave
- 13.8.5 Análisis FODA
- 13.8.6 Estrategias clave Estrategias
-
13.9 TTEC Holdings, Inc.
- 13.9.1 Descripción general de la empresa
- 13.9.2 Descripción financiera
- 13.9.3 Productos/servicios/soluciones ofrecidos
- 13.9.4 Desarrollos clave
- 13.9.5 Análisis FODA
- 13.9.6 Estrategias clave
-
13.10 Conneqt Business Solution Limited
- 13.10.1 Descripción general de la empresa
- 13.10.2 Descripción financiera
- 13.10.3 Productos/servicios/soluciones ofrecidos
- 13.10.4 Desarrollos clave
- 13.10.5 Análisis FODA
-
13.11 Aegis
- 13.11.1 Descripción general de la empresa
- 13.11.2 Descripción financiera
- 13.11.3 Productos/servicios/soluciones ofrecidos Oferta
- 13.11.4 Desarrollos Clave
- 13.11.5 Estrategias Clave
-
13.12 Tech Mahindra Limited
- 13.12.1 Descripción General de la Empresa
- 13.12.2 Descripción Financiera
- 13.12.3 Productos/Servicios/Soluciones Ofertadas
- 13.12.4 Desarrollos Clave
- 13.12.5 Análisis FODA
- 13.12.6 Estrategias Clave
-
13.13 HCL Technologies Limited
- 13.13.1 Descripción General de la Empresa
- 13.13.2 Descripción Financiera
- 13.13.3 Productos/Servicios/Soluciones Ofertadas
- 13.13.4 Desarrollos Clave
- 13.13.5 Análisis FODA
- 13.13.6 Estrategias Clave
-
13.14 eNoah
- 13.14.1 Descripción general de la empresa
- 13.14.2 Productos/servicios/soluciones ofrecidos
- 13.14.3 Desarrollos clave
- 13.14.4 Estrategias clave
-
13.15 Genpact
- 13.15.1 Descripción general de la empresa
- 13.15.2 Descripción financiera
- 13.15.3 Productos/servicios/soluciones ofrecidos
- 13.15.4 Desarrollos clave
- 13.15.5 Análisis FODA
- 13.15.6 Estrategias clave
-
13.1 ADP, LLC
-
14 Lista de tablas
- TABLA 1 LISTA DE SUPUESTOS
- TABLA 2 MERCADO GLOBAL DE SERVICIOS DE BPO, POR TIPO, 2020-2027 (USD MILLONES)
- TABLA 3 MERCADO GLOBAL DE SERVICIOS DE BPO, POR IMPLEMENTACIÓN, 2020-2027 (USD MILLONES)
- TABLA 4 MERCADO GLOBAL DE SERVICIOS DE BPO, POR TAMAÑO DE ORGANIZACIÓN, 2020-2027 (USD MIL MILLONES)
- TABLA 5 MERCADO GLOBAL DE SERVICIOS DE BPO, POR VERTICAL, 2020-2027 (USD MIL MILLONES)
- TABLA 6 MERCADO GLOBAL DE SERVICIOS DE BPO, POR REGIÓN, 2020-2027 (USD MIL MILLONES)
- TABLA 7 AMÉRICA DEL NORTE: MERCADO DE SERVICIOS DE BPO, POR PAÍS, 2020-2027 (USD MIL MILLONES)
- TABLA 8 AMÉRICA DEL NORTE: MERCADO DE SERVICIOS DE BPO, POR TIPO, 2020-2027 (USD MIL MILLONES)
- TABLA 9 AMÉRICA DEL NORTE: MERCADO DE SERVICIOS DE BPO, POR IMPLEMENTACIÓN, 2020-2027 (USD MIL MILLONES)
- TABLA 10 AMÉRICA DEL NORTE AMÉRICA: MERCADO DE SERVICIOS BPO, POR TAMAÑO DE ORGANIZACIÓN, 2020-2027 (USD MIL MILLONES)
- TABLA 11 AMÉRICA DEL NORTE: MERCADO DE SERVICIOS BPO, POR VERTICAL, 2020-2027 (USD MIL MILLONES)
- TABLA 12 EE. UU.: MERCADO DE SERVICIOS BPO, POR TIPO, 2020-2027 (USD MIL MILLONES)
- TABLA 13 EE. UU.: MERCADO DE SERVICIOS BPO, POR IMPLEMENTACIÓN, 2020-2027 (USD MIL MILLONES)
- TABLA 14 EE. UU.: MERCADO DE SERVICIOS BPO, POR TAMAÑO DE ORGANIZACIÓN, 2020-2027 (USD MIL MILLONES)
- TABLA 15 EE. UU.: MERCADO DE SERVICIOS BPO, POR VERTICAL, 2020-2027 (USD MIL MILLONES)
- TABLA 16 CANADÁ: MERCADO DE SERVICIOS BPO, POR TIPO, 2020-2027 (USD MIL MILLONES)
- TABLA 17 CANADÁ: MERCADO DE SERVICIOS BPO, POR IMPLEMENTACIÓN, 2020-2027 (USD MIL MILLONES)
- TABLA 18 CANADÁ: MERCADO DE SERVICIOS BPO, POR TAMAÑO DE ORGANIZACIÓN, 2020-2027 (USD MIL MILLONES)
- TABLA 19 CANADÁ: MERCADO DE SERVICIOS BPO, POR VERTICAL, 2020-2027 (USD MIL MILLONES)
- TABLA 20 MÉXICO: MERCADO DE SERVICIOS BPO, POR TIPO, 2020-2027 (USD MIL MILLONES)
- TABLA 21 MÉXICO: MERCADO DE SERVICIOS BPO, POR IMPLEMENTACIÓN, 2020-2027 (USD MIL MILLONES)
- TABLA 22 MÉXICO: MERCADO DE SERVICIOS BPO, POR TAMAÑO DE ORGANIZACIÓN, 2020–2027 (USD MIL MILLONES)
- TABLA 23 MÉXICO: MERCADO DE SERVICIOS BPO, POR VERTICAL, 2020–2027 (USD MIL MILLONES)
- TABLA 24 ASIA-PACÍFICO: MERCADO DE SERVICIOS BPO, POR PAÍS, 2020–2027 (USD MIL MILLONES)
- TABLA 25 ASIA-PACÍFICO: MERCADO DE SERVICIOS BPO, POR TIPO, 2020–2027 (USD MIL MILLONES)
- TABLA 26 ASIA-PACÍFICO: MERCADO DE SERVICIOS BPO, POR IMPLEMENTACIÓN, 2020–2027 (USD MIL MILLONES)
- TABLA 27 ASIA-PACÍFICO: MERCADO DE SERVICIOS BPO, POR TAMAÑO DE ORGANIZACIÓN, 2020–2027 (USD MIL MILLONES)
- TABLA 28 ASIA-PACÍFICO: MERCADO DE SERVICIOS BPO, POR VERTICAL, 2020-2027 (USD MIL MILLONES)
- TABLA 29 CHINA: MERCADO DE SERVICIOS BPO, POR TIPO, 2020-2027 (USD MIL MILLONES)
- TABLA 30 CHINA: MERCADO DE SERVICIOS BPO, POR IMPLEMENTACIÓN, 2020-2027 (USD MIL MILLONES)
- TABLA 31 CHINA: MERCADO DE SERVICIOS BPO, POR TAMAÑO DE ORGANIZACIÓN, 2020-2027 (USD MIL MILLONES)
- TABLA 32 CHINA: MERCADO DE SERVICIOS BPO, POR VERTICAL, 2020-2027 (USD MIL MILLONES)
- TABLA 33 JAPÓN: MERCADO DE SERVICIOS BPO, POR TIPO, 2020-2027 (USD MIL MILLONES)
- TABLA 34 JAPÓN: MERCADO DE SERVICIOS BPO, POR IMPLEMENTACIÓN, 2020-2027 (USD MIL MILLONES)
- TABLA 35 JAPÓN: MERCADO DE SERVICIOS BPO, POR TAMAÑO DE ORGANIZACIÓN, 2020-2027 (USD MIL MILLONES)
- TABLA 36 JAPÓN: MERCADO DE SERVICIOS BPO, POR VERTICAL, 2020-2027 (USD MIL MILLONES)
- TABLA 37 INDIA: MERCADO DE SERVICIOS BPO, POR TIPO, 2020-2027 (USD MIL MILLONES)
- TABLA 38 INDIA: MERCADO DE SERVICIOS BPO, POR IMPLEMENTACIÓN, 2020-2027 (USD MIL MILLONES)
- TABLA 39 INDIA: MERCADO DE SERVICIOS BPO, POR TAMAÑO DE ORGANIZACIÓN, 2020-2027 (USD MIL MILLONES)
- TABLA 40 INDIA: MERCADO DE SERVICIOS BPO, POR VERTICAL, 2020-2027 (USD MIL MILLONES)
- TABLA 41 RESTO DE ASIA-PACÍFICO: MERCADO DE SERVICIOS BPO, POR TIPO, 2020-2027 (MILES DE MILLONES DE USD)
- TABLA 42 RESTO DE ASIA-PACÍFICO: MERCADO DE SERVICIOS BPO, POR IMPLEMENTACIÓN, 2020-2027 (MILES DE MILLONES DE USD)
- TABLA 43 RESTO DE ASIA-PACÍFICO: MERCADO DE SERVICIOS BPO, POR TAMAÑO DE ORGANIZACIÓN, 2020-2027 (MILES DE MILLONES DE USD)
- TABLA 44 RESTO DE ASIA-PACÍFICO: MERCADO DE SERVICIOS BPO, POR VERTICAL, 2020-2027 (MILES DE MILLONES DE USD)
- TABLA 45 EUROPA: MERCADO DE SERVICIOS BPO, POR PAÍS, 2020-2027 (MILES DE MILLONES DE USD)
- TABLA 46 EUROPA: MERCADO DE SERVICIOS BPO, POR TIPO, 2020-2027 (MILES DE MILLONES DE USD) MIL MILLONES)
- TABLA 47 EUROPA: MERCADO DE SERVICIOS BPO, POR IMPLEMENTACIÓN, 2020-2027 (MILES DE MILLONES DE USD)
- TABLA 48 EUROPA: MERCADO DE SERVICIOS BPO, POR TAMAÑO DE ORGANIZACIÓN, 2020-2027 (MILES DE MILLONES DE USD)
- TABLA 49 EUROPA: MERCADO DE SERVICIOS BPO, POR VERTICAL, 2020-2027 (MILES DE MILLONES DE USD)
- TABLA 50 ALEMANIA: MERCADO DE SERVICIOS BPO, POR TIPO, 2020-2027 (MILES DE MILLONES DE USD)
- TABLA 51 ALEMANIA: MERCADO DE SERVICIOS BPO, POR IMPLEMENTACIÓN, 2020-2027 (MILES DE MILLONES DE USD)
- TABLA 52 ALEMANIA: MERCADO DE SERVICIOS BPO, POR TAMAÑO DE ORGANIZACIÓN, 2020-2027 (MILES DE MILLONES DE USD)
- TABLA 53 ALEMANIA: MERCADO DE SERVICIOS BPO, POR VERTICAL, 2020-2027 (MILES DE MILLONES DE USD)
- TABLA 54 REINO UNIDO: MERCADO DE SERVICIOS BPO, POR TIPO, 2020-2027 (MILES DE MILLONES DE USD)
- TABLA 55 REINO UNIDO: MERCADO DE SERVICIOS BPO, POR IMPLEMENTACIÓN, 2020-2027 (MILES DE MILLONES DE USD)
- TABLA 56 REINO UNIDO: MERCADO DE SERVICIOS BPO, POR TAMAÑO DE ORGANIZACIÓN, 2020-2027 (MILES DE MILLONES DE USD)
- TABLA 57 REINO UNIDO: MERCADO DE SERVICIOS BPO, POR VERTICAL, 2020-2027 (MILES DE MILLONES DE USD)
- TABLA 58 FRANCIA: MERCADO DE SERVICIOS BPO, POR TIPO, 2020-2027 (MILES DE MILLONES DE USD)
- TABLA 59 FRANCIA: MERCADO DE SERVICIOS BPO, POR IMPLEMENTACIÓN, 2020–2027 (MILES DE MILLONES DE USD)
- TABLA 60 FRANCIA: MERCADO DE SERVICIOS BPO, POR TAMAÑO DE ORGANIZACIÓN, 2020–2027 (MILES DE MILLONES DE USD)
- TABLA 61 FRANCIA: MERCADO DE SERVICIOS BPO, POR VERTICAL, 2020–2027 (MILES DE MILLONES DE USD)
- TABLA 62 RESTO DE EUROPA: MERCADO DE SERVICIOS BPO, POR TIPO, 2020–2027 (MILES DE MILLONES DE USD)
- TABLA 63 RESTO DE EUROPA: MERCADO DE SERVICIOS BPO, POR IMPLEMENTACIÓN, 2020–2027 (MILES DE MILLONES DE USD)
- TABLA 64 RESTO DE EUROPA: MERCADO DE SERVICIOS BPO, POR TAMAÑO DE ORGANIZACIÓN, 2020–2027 (MILES DE MILLONES DE USD)
- TABLA 65 RESTO DE EUROPA: MERCADO DE SERVICIOS BPO, POR VERTICAL, 2020–2027 (USD MIL MILLONES)
- TABLA 66 ORIENTE MEDIO Y ÁFRICA: MERCADO DE SERVICIOS BPO, POR TIPO, 2020–2027 (USD MIL MILLONES)
- TABLA 67 ORIENTE MEDIO Y ÁFRICA: MERCADO DE SERVICIOS BPO, POR IMPLEMENTACIÓN, 2020–2027 (USD MIL MILLONES)
- TABLA 68 ORIENTE MEDIO Y ÁFRICA: MERCADO DE SERVICIOS BPO, POR TAMAÑO DE LA ORGANIZACIÓN, 2020–2027 (USD MIL MILLONES)
- TABLA 69 ORIENTE MEDIO Y ÁFRICA: MERCADO DE SERVICIOS BPO, POR VERTICAL, 2020–2027 (USD MIL MILLONES)
- TABLA 70 AMÉRICA DEL SUR: MERCADO DE SERVICIOS BPO, POR TIPO, 2020–2027 (USD MIL MILLONES)
- TABLA 71 AMÉRICA DEL SUR AMÉRICA: MERCADO DE SERVICIOS BPO, POR IMPLEMENTACIÓN, 2020-2027 (USD MILLONES)
- TABLA 72 AMÉRICA DEL SUR: MERCADO DE SERVICIOS BPO, POR TAMAÑO DE ORGANIZACIÓN, 2020-2027 (USD MILLONES)
- TABLA 73 AMÉRICA DEL SUR: MERCADO DE SERVICIOS BPO, POR VERTICAL, 2020-2027 (USD MILLONES)
- TABLA 74 TABLERO: EL JUGADOR MÁS ACTIVO EN EL MERCADO GLOBAL DE SERVICIOS DE SUBCONTRATACIÓN DE PROCESOS DE NEGOCIO (BPO)
- TABLA 75 LANZAMIENTO DE NUEVOS PRODUCTOS/IMPLEMENTACIÓN DE SERVICIOS 108
- TABLA 76 FUSIÓN Y ADQUISICIÓN
-
15 Lista de figuras
- FIGURA 1 SINOPSIS DEL MERCADO
- FIGURA 2 ANÁLISIS DEL ATRACTIVO DEL MERCADO: MERCADO GLOBAL DE SERVICIOS DE SUBCONTRATACIÓN DE PROCESOS DE NEGOCIO
- FIGURA 3 MERCADO GLOBAL DE SERVICIOS BPO: ESTRUCTURA DEL MERCADO
- FIGURA 4 PROCESO DE INVESTIGACIÓN DE MRFR
- FIGURA 5 ENFOQUE DE ARRIBA HACIA ABAJO Y DE ABAJO HACIA ARRIBA
- FIGURA 6 TAMAÑO DEL MERCADO GLOBAL Y PARTICIPACIÓN DE MERCADO POR REGIÓN (2020 VS 2027)
- FIGURA 7 TAMAÑO DEL MERCADO DE AMÉRICA DEL NORTE Y PARTICIPACIÓN DE MERCADO POR PAÍS (2020 VS 2027)
- FIGURA 8 TAMAÑO DEL MERCADO DE ASIA-PACÍFICO Y PARTICIPACIÓN DE MERCADO POR PAÍS (2020 VS 2027)
- FIGURA 9 TAMAÑO DEL MERCADO DE EUROPA Y PARTICIPACIÓN DE MERCADO POR PAÍS (2020 VS 2027) PARTICIPACIÓN DE MERCADO POR PAÍS (2020 VS 2027)
- FIGURA 10 ANÁLISIS DRO DEL MERCADO GLOBAL DE SERVICIOS BPO
- FIGURA 11 NÚMERO DE ACUERDOS BPO DE 2013 A 2017
- FIGURA 12 ANÁLISIS DEL IMPACTO DE LOS IMPULSORES: MERCADO DE SERVICIOS BPO
- FIGURA 13 ANÁLISIS DEL IMPACTO DE LAS RESTRICCIONES: MERCADO DE SERVICIOS BPO
- FIGURA 14 CADENA DE VALOR: MERCADO GLOBAL DE SERVICIOS BPO
- FIGURA 15 ANÁLISIS DE LAS CINCO FUERZAS DE PORTER DEL MERCADO GLOBAL DE SERVICIOS BPO
- FIGURA 16 MERCADO GLOBAL DE SERVICIOS BPO, POR TIPO, 2020-2027 (MIDORES DE MILLONES DE USD)
- FIGURA 17 MERCADO GLOBAL DE SERVICIOS BPO, POR IMPLEMENTACIÓN, 2020-2027 (USD MIL MILLONES)
- FIGURA 18 MERCADO GLOBAL DE SERVICIOS BPO, POR TAMAÑO DE ORGANIZACIÓN, 2020-2027 (USD MIL MILLONES)
- FIGURA 19 MERCADO GLOBAL DE SERVICIOS BPO, POR VERTICAL, 2020-2027 (USD MIL MILLONES)
- FIGURA 20 MERCADO GLOBAL DE SERVICIOS BPO, POR REGIÓN, 2020-2027 (USD MIL MILLONES)
- FIGURA 21 AMÉRICA DEL NORTE: MERCADO DE SERVICIOS BPO, POR PAÍS, 2020-2027 (USD MIL MILLONES)
- FIGURA 22 AMÉRICA DEL NORTE: MERCADO DE SERVICIOS BPO, POR TIPO, 2020-2027 (USD MIL MILLONES)
- FIGURA 23 AMÉRICA DEL NORTE AMÉRICA: MERCADO DE SERVICIOS BPO, POR IMPLEMENTACIÓN, 2020-2027 (USD MIL MILLONES)
- FIGURA 24 AMÉRICA DEL NORTE: MERCADO DE SERVICIOS BPO, POR TAMAÑO DE ORGANIZACIÓN, 2020-2027 (USD MIL MILLONES)
- FIGURA 25 AMÉRICA DEL NORTE: MERCADO DE SERVICIOS BPO, POR VERTICAL, 2020-2027 (USD MIL MILLONES)
- FIGURA 26 ASIA-PACÍFICO: MERCADO DE SERVICIOS BPO, POR PAÍS, 2020-2027 (USD MIL MILLONES)
- FIGURA 27 ASIA-PACÍFICO: MERCADO DE SERVICIOS BPO, POR TIPO, 2020-2027 (USD MIL MILLONES)
- FIGURA 28 ASIA-PACÍFICO: MERCADO DE SERVICIOS BPO, POR IMPLEMENTACIÓN, 2020–2027 (USD MIL MILLONES)
- FIGURA 29 ASIA-PACÍFICO: MERCADO DE SERVICIOS BPO, POR TAMAÑO DE ORGANIZACIÓN, 2020–2027 (USD MIL MILLONES)
- FIGURA 30 ASIA-PACÍFICO: MERCADO DE SERVICIOS BPO, POR VERTICAL, 2020–2027 (USD MIL MILLONES)
- FIGURA 31 EUROPA: MERCADO DE SERVICIOS BPO, POR PAÍS, 2020–2027 (USD MIL MILLONES)
- FIGURA 32 EUROPA: MERCADO DE SERVICIOS BPO, POR TIPO, 2020–2027 (USD MIL MILLONES)
- FIGURA 33 EUROPA: MERCADO DE SERVICIOS BPO, POR IMPLEMENTACIÓN, 2020–2027 (USD MIL MILLONES)
- FIGURA 34 EUROPA: MERCADO DE SERVICIOS BPO, POR TAMAÑO DE LA ORGANIZACIÓN, 2020-2027 (USD MIL MILLONES)
- FIGURA 35 EUROPA: MERCADO DE SERVICIOS BPO, POR VERTICAL, 2020-2027 (USD MIL MILLONES)
- FIGURA 36 ORIENTE MEDIO Y ÁFRICA: MERCADO DE SERVICIOS BPO, POR TIPO, 2020-2027 (USD MIL MILLONES)
- FIGURA 37 ORIENTE MEDIO Y ÁFRICA: MERCADO DE SERVICIOS BPO, POR IMPLEMENTACIÓN, 2020-2027 (USD MIL MILLONES)
- FIGURA 38 ORIENTE MEDIO Y ÁFRICA: MERCADO DE SERVICIOS BPO, POR TAMAÑO DE LA ORGANIZACIÓN, 2020-2027 (USD MIL MILLONES)
- FIGURA 39 ORIENTE MEDIO Y ÁFRICA: MERCADO DE SERVICIOS BPO, POR VERTICAL, 2020-2027 (USD MIL MILLONES)
- FIGURA 40 SUDAMÉRICA: MERCADO DE SERVICIOS BPO, POR TIPO, 2020-2027 (USD MIL MILLONES)
- FIGURA 41 SUDAMÉRICA: MERCADO DE SERVICIOS BPO, POR IMPLEMENTACIÓN, 2020-2027 (USD MIL MILLONES)
- FIGURA 42 SUDAMÉRICA: MERCADO DE SERVICIOS BPO, POR TAMAÑO DE ORGANIZACIÓN, 2020-2027 (USD MIL MILLONES)
- FIGURA 43 SUDAMÉRICA: MERCADO DE SERVICIOS BPO, POR VERTICAL, 2020-2027 (USD MIL MILLONES)
- FIGURA 44 CONTRATOS Y ACUERDOS: LA PRINCIPAL ESTRATEGIA ADOPTADA POR LOS ACTORES CLAVE EN EL MERCADO GLOBAL DE SERVICIOS BPO
- FIGURA 45 ANÁLISIS DE REFERENCIA DE LOS PRINCIPALES COMPETIDORES
Customer Stories

“This is really good guys. Excellent work on a tight deadline. I will continue to use you going forward and recommend you to others. Nice job”

“Thanks. It’s been a pleasure working with you, please use me as reference with any other Intel employees.”

“Thanks for sending the report it gives us a good global view of the Betaïne market.”

“Thank you, this will be very helpful for OQS.”

“We found the report very insightful! we found your research firm very helpful. I'm sending this email to secure our future business.”

“I am very pleased with how market segments have been defined in a relevant way for my purposes (such as "Portable Freezers & refrigerators" and "last-mile"). In general the report is well structured. Thanks very much for your efforts.”

“I have been reading the first document or the study, ,the Global HVAC and FP market report 2021 till 2026. Must say, good info! I have not gone in depth at all parts, but got a good indication of the data inside!”

“We got the report in time, we really thank you for your support in this process. I also thank to all of your team as they did a great job.”