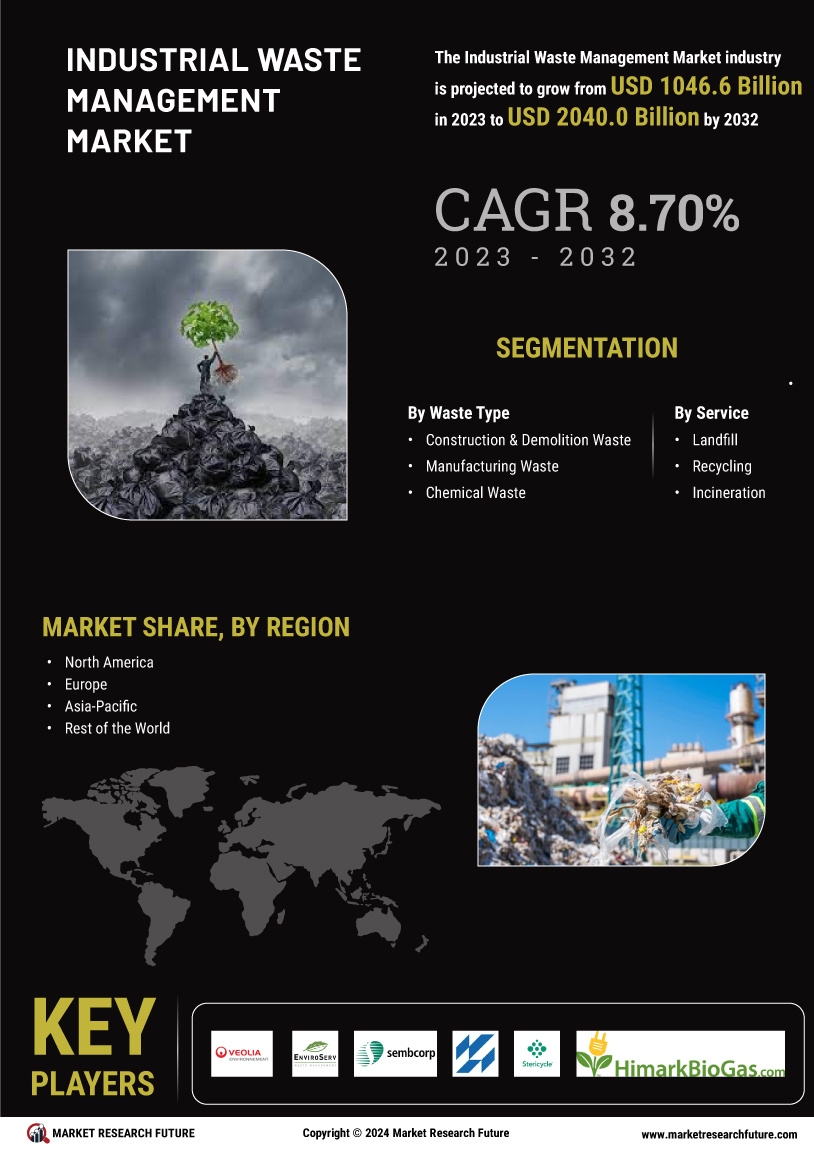
Request Free Sample ×

Kindly complete the form below to receive a free sample of this Report

* Please use a valid business email

Leading companies partner with us for data-driven Insights

clients tt-cursor
Hero Background

Industrial Waste Management Market

ID: MRFR/Equip/5027-HCR
100 Pages
Priya Nagrale
Last Updated: April 09, 2026

Informationen zum Marktforschungsbericht zur industriellen Abfallbewirtschaftung nach Abfallart (Bau- und Abbruchabfälle, Produktionsabfälle, Chemieabfälle, Bergbauabfälle, Öl- und Gasabfälle, landwirtschaftliche Abfälle, Atomabfälle und andere), nach Dienstleistung (Deponie, Recycling, Verbrennung) und nach Region (Nordamerika, Europa, Asien-Pazifik und Rest der Welt) – Marktprognose bis 2032

Teilen
Download PDF ×

We do not share your information with anyone. However, we may send you emails based on your report interest from time to time. You may contact us at any time to opt-out.

Industrial Waste Management Market Infographic
Purchase Options
  1. 1 ZUSAMMENFASSUNG
    1. 1.1 Marktattraktivitätsanalyse
      1. 1.1.1 Markt fĂĽr Industrieabfallmanagement nach Typ
      2. 1.1.2 Markt fĂĽr Industrieabfallmanagement nach Abfallart
      3. 1.1.3 Markt fĂĽr Industrieabfallmanagement nach Dienstleistung
      4. 1.1.4 Markt fĂĽr Industrieabfallmanagement nach Region
  2. 2 MARKTEINFĂśHRUNG
    1. 2.1 Definition
    2. 2.2 Umfang der Studie
    3. 2.3 Marktstruktur
    4. 2.4 Wichtige Kaufkriterien
    5. 2.5 Makrofaktoranalyse
  3. 3 FORSCHUNGSMETHODIK
    1. 3.1 Forschungsprozess
    2. 3.2 Primärforschung
    3. 3.3 Sekundärforschung
    4. 3.4 Schätzung der Marktgröße
    5. 3.5 Prognosemodell
    6. 3.6 Liste der Annahmen
  4. 4 MARKTDYNAMIK
    1. 4.1 Einleitung
    2. 4.2 Treiber
      1. 4.2.1 Strenge staatliche Vorschriften weltweit fĂĽr ein besseres Abfallmanagement
      2. 4.2.2 Starker Fokus mehrerer Regierungen auf die DurchfĂĽhrung von Sensibilisierungsprogrammen, die die Bedeutung von Abfalltrennung und Abfallmanagement aufzeigen
    3. 4.3 Einschränkungen
      1. 4.3.1 Hohe Abfallentsorgungskosten
    4. 4.4 Chancen
      1. 4.4.1 Steigende Nachfrage nach Abfallmanagementdienstleistungen aus Schwellenländern aufgrund der raschen Industrialisierung
      2. 4.4.2 Zunehmende Verwendung von Bau- und Abbruchmaterialien (C&D) in städtischen Gebieten mit steigender Anzahl von Bauprojekten
    5. 4.5 Covid-19-Auswirkungsanalyse
      1. 4.5.1 Auswirkungen auf die gesamte Industrieabfallwirtschaftsbranche
        1. 4.5.1.1 Wirtschaftliche Auswirkungen
      2. 4.5.2 Auswirkungen auf den Markt fĂĽr industrielle Abfallwirtschaft
      3. 4.5.3 Auswirkungen auf die Marktnachfrage
        1. 4.5.3.1 Auswirkungen aufgrund von Einschränkungen/Lockdown
        2. 4.5.3.2 Verbraucherstimmung
      4. 4.5.4 Auswirkungen auf die Preisgestaltung
  5. 5 Marktfaktorenanalyse
    1. 5.1 Porters Fünf-Kräfte-Modell
      1. 5.1.1 Verhandlungsmacht der Anbieter
      2. 5.1.2 Verhandlungsmacht der Käufer
      3. 5.1.3 Bedrohung durch neue Marktteilnehmer
      4. 5.1.4 Bedrohung durch Ersatzprodukte
      5. 5.1.5 Intensität der Rivalität
  6. 6 Schätzungen und Prognosen für den Markt für industrielle Abfallwirtschaft, nach Typ
    1. 6.1 Einleitung
    2. 6.2 Gefährlich
    3. 6.3 Ungefährlich
  7. 7 Marktschätzungen und -prognose für die industrielle Abfallwirtschaft nach Abfallart
    1. 7.1 Einleitung
    2. 7.2 Bau- und Abbruchabfälle
    3. 7.3 Produktionsabfälle
    4. 7.4 Chemische Abfälle
    5. 7.5 Bergbauabfälle
    6. 7.6 Öl- und Gasabfälle
    7. 7.7 Landwirtschaftliche Abfälle
    8. 7.8 AtommĂĽll
    9. 7.9 Sonstige
  8. 8 Marktschätzungen und -prognose für die industrielle Abfallwirtschaft nach Dienstleistung
    1. 8.1 Einleitung
    2. 8.2 Deponie
    3. 8.3 Recycling
    4. 8.4 Verbrennung
  9. 9 Marktschätzungen und -prognose für die industrielle Abfallwirtschaft nach Region
    1. 9.1 Einleitung
    2. 9.2 Nordamerika
      1. 9.2.1 Industrielle Abfallbewirtschaftung in Nordamerika nach Art (Mrd. USD, 2018–2032)
      2. 9.2.2 Industrielle Abfallbewirtschaftung in Nordamerika nach Dienstleistung (Mrd. USD, 2018–2032)
      3. 9.2.3 Industrielle Abfallbewirtschaftung in Nordamerika nach Abfallart (Mrd. USD, 2018–2032)
      4. 9.2.4 USA
        1. 9.2.4.1 Industrielle Abfallbewirtschaftung in den USA nach Art (Mrd. USD, 2018–2032)
        2. 9.2.4.2 Industrielle Abfallbewirtschaftung in den USA nach Dienstleistung (Mrd. USD, 2018–2032)
        3. 9.2.4.3 Industrielle Abfallbewirtschaftung in den USA nach Abfallart (Mrd. USD, 2018–2032)
      5. 9.2.5 Kanada
        1. 9.2.5.1 Kanada: Industrieabfallmanagement nach Art (Mrd. USD, 2018–2032)
        2. 9.2.5.2 Kanada: Industrieabfallmanagement nach Dienstleistung (Mrd. USD, 2018–2032)
        3. 9.2.5.3 Kanada: Industrieabfallmanagement nach Abfallart (Mrd. USD, 2018–2032)
      6. 9.2.6 Mexiko
        1. 9.2.6.1 Mexiko: Industrieabfallmanagement nach Art (Mrd. USD, 2018–2032)
        2. 9.2.6.2 Mexiko: Industrieabfallmanagement nach Dienstleistung (Mrd. USD, 2018–2032)
        3. 9.2.6.3 Mexiko: Industrieabfallmanagement nach Abfallart (Mrd. USD, 2018–2032)
    3. 9.3 Europa
      1. 9.3.1 Industrielle Abfallbewirtschaftung in Europa nach Art (Mrd. USD, 2018–2032)
      2. 9.3.2 Industrielle Abfallbewirtschaftung in Europa nach Dienstleistung (Mrd. USD, 2018–2032)
      3. 9.3.3 Industrielle Abfallbewirtschaftung in Europa nach Abfallart (Mrd. USD, 2018–2032)
      4. 9.3.4 Deutschland
        1. 9.3.4.1 Industrielle Abfallbewirtschaftung in Deutschland nach Art (Mrd. USD, 2018–2032)
        2. 9.3.4.2 Industrielle Abfallbewirtschaftung in Deutschland nach Dienstleistung (Mrd. USD, 2018–2032)
        3. 9.3.4.3 Industrielle Abfallbewirtschaftung in Deutschland nach Abfallart (Mrd. USD, 2018–2032)
      5. 9.3.5 Frankreich
        1. 9.3.5.1 Industrielle Abfallbewirtschaftung in Frankreich nach Art (Mrd. USD, 2018–2032)
        2. 9.3.5.2 Industrielle Abfallbewirtschaftung in Frankreich nach Dienstleistung (Mrd. USD, 2018–2032)
        3. 9.3.5.3 Industrielle Abfallbewirtschaftung in Frankreich nach Abfallart (Mrd. USD, 2018–2032)
      6. 9.3.6 Vereinigtes Königreich
        1. 9.3.6.1 Industrielle Abfallbewirtschaftung in Großbritannien nach Art (Mrd. USD, 2018–2032)
        2. 9.3.6.2 Industrielle Abfallbewirtschaftung in Großbritannien nach Dienstleistung (Mrd. USD, 2018–2032)
        3. 9.3.6.3 Industrielle Abfallbewirtschaftung in Großbritannien nach Abfallart (Mrd. USD, 2018–2032)
      7. 9.3.7 Italien
        1. 9.3.7.1 Industrielle Abfallbewirtschaftung in Italien nach Art (Mrd. USD, 2018–2032)
        2. 9.3.7.2 Industrielle Abfallbewirtschaftung in Italien nach Dienstleistung (Mrd. USD, 2018–2032)
        3. 9.3.7.3 Industrielle Abfallbewirtschaftung in Italien nach Abfallart (Mrd. USD, 2018–2032)
      8. 9.3.8 Spanien
        1. 9.3.8.1 Industrielle Abfallbewirtschaftung in Spanien nach Art (Mrd. USD, 2018–2032)
        2. 9.3.8.2 Industrielle Abfallbewirtschaftung in Spanien nach Dienstleistung (Mrd. USD, 2018–2032)
        3. 9.3.8.3 Industrielle Abfallbewirtschaftung in Spanien nach Abfallart (Mrd. USD, 2018–2032)
      9. 9.3.9 Restliches Europa
        1. 9.3.9.1 Industrieabfallmanagement im übrigen Europa nach Art (Mrd. USD, 2018–2032)
        2. 9.3.9.2 Industrieabfallmanagement im übrigen Europa nach Dienstleistung (Mrd. USD, 2018–2032)
        3. 9.3.9.3 Industrieabfallmanagement im übrigen Europa nach Abfallart (Mrd. USD, 2018–2032)
    4. 9.4 Asien-Pazifik
      1. 9.4.1 Industrieabfallmanagement im asiatisch-pazifischen Raum nach Art (Mrd. USD, 2018–2032)
      2. 9.4.2 Industrieabfallmanagement im asiatisch-pazifischen Raum nach Dienstleistung (Mrd. USD, 2018–2032)
      3. 9.4.3 Industrieabfallmanagement im asiatisch-pazifischen Raum nach Abfallart (Mrd. USD, 2018–2032)
      4. 9.4.4 China
        1. 9.4.4.1 Industrielle Abfallwirtschaft in China nach Art (Mrd. USD, 2018–2032)
        2. 9.4.4.2 Industrielle Abfallwirtschaft in China nach Dienstleistung (Mrd. USD, 2018–2032)
        3. 9.4.4.3 Industrielle Abfallwirtschaft in China nach Abfallart (Mrd. USD, 2018–2032)
      5. 9.4.5 Indien
        1. 9.4.5.1 Industrielle Abfallwirtschaft in Indien nach Art (Mrd. USD, 2018–2032)
        2. 9.4.5.2 Industrielle Abfallwirtschaft in Indien nach Dienstleistung (Mrd. USD, 2018–2032)
        3. 9.4.5.3 Industrielle Abfallwirtschaft in Indien nach Abfallart (Mrd. USD, 2018–2032)
      6. 9.4.6 Japan
        1. 9.4.6.1 Industrielle Abfallwirtschaft in Japan nach Art (Mrd. USD, 2018–2032)
        2. 9.4.6.2 Industrielle Abfallwirtschaft in Japan nach Dienstleistung (Mrd. USD, 2018–2032)
        3. 9.4.6.3 Industrielle Abfallwirtschaft in Japan nach Abfallart (Mrd. USD, 2018–2032)
      7. 9.4.7 SĂĽdkorea
        1. 9.4.7.1 Industrielle Abfallwirtschaft in Südkorea nach Art (Mrd. USD, 2018–2032)
        2. 9.4.7.2 Industrielle Abfallwirtschaft in Südkorea nach Dienstleistung (Mrd. USD, 2018–2032)
        3. 9.4.7.3 Industrielle Abfallwirtschaft in Südkorea nach Abfallart (Mrd. USD, 2018–2032)
      8. 9.4.8 Australien
        1. 9.4.8.1 Industrielle Abfallbewirtschaftung in Australien nach Art (Mrd. USD, 2018–2032)
        2. 9.4.8.2 Industrielle Abfallbewirtschaftung in Australien nach Dienstleistung (Mrd. USD, 2018–2032)
        3. 9.4.8.3 Industrielle Abfallbewirtschaftung in Australien nach Abfallart (Mrd. USD, 2018–2032)
      9. 9.4.9 Restlicher asiatisch-pazifischer Raum
        1. 9.4.9.1 Industrielle Abfallbewirtschaftung im Restlichen asiatisch-pazifischen Raum nach Art (Mrd. USD, 2018–2032)
        2. 9.4.9.2 Industrielle Abfallbewirtschaftung im Restlichen asiatisch-pazifischen Raum nach Dienstleistung (Mrd. USD, 2018–2032)
        3. 9.4.9.3 Industrielle Abfallbewirtschaftung im Restlichen asiatisch-pazifischen Raum nach Abfallart (Mrd. USD, 2018–2032)
    5. 9.5 Naher Osten und Afrika
      1. 9.5.1 Industrielle Abfallwirtschaft im Nahen Osten und Afrika nach Art (Mrd. USD, 2018–2032)
      2. 9.5.2 Industrielle Abfallwirtschaft im Nahen Osten und Afrika nach Dienstleistung (Mrd. USD, 2018–2032)
      3. 9.5.3 Industrielle Abfallwirtschaft im Nahen Osten und Afrika nach Abfallart (Mrd. USD, 2018–2032)
      4. 9.5.4 Saudi-Arabien
        1. 9.5.4.1 Industrielle Abfallwirtschaft in Saudi-Arabien nach Art (Mrd. USD, 2018–2032)
        2. 9.5.4.2 Industrielle Abfallwirtschaft in Saudi-Arabien nach Dienstleistung (Mrd. USD, 2018–2032)
        3. 9.5.4.3 Industrielle Abfallwirtschaft in Saudi-Arabien nach Abfallart (Mrd. USD, 2018–2032)
      5. 9.5.5 SĂĽdafrika
        1. 9.5.5.1 Industrieabfallmanagement in Südafrika nach Art (Mrd. USD, 2018–2032)
        2. 9.5.5.2 Industrieabfallmanagement in Südafrika nach Dienstleistung (Mrd. USD, 2018–2032)
        3. 9.5.5.3 Industrieabfallmanagement in Südafrika nach Abfallart (Mrd. USD, 2018–2032)
      6. 9.5.6 VAE
        1. 9.5.6.1 Industrieabfallmanagement in den VAE nach Art (Mrd. USD, 2018–2032)
        2. 9.5.6.2 Industrieabfallmanagement in den VAE nach Dienstleistung (Mrd. USD, 2018–2032)
        3. 9.5.6.3 Industrieabfallmanagement in den VAE nach Abfallart (Mrd. USD, 2018–2032)
      7. 9.5.7 Restliches MEA
        1. 9.5.7.1 Industrieabfallmanagement im Restlichen MEA nach Art (Mrd. USD, 2018–2032)
        2. 9.5.7.2 Industrieabfallmanagement im Restlichen MEA nach Dienstleistung (Mrd. USD, 2018–2032)
        3. 9.5.7.3 Industrieabfallmanagement im Restlichen MEA nach Abfallart (Mrd. USD, 2018–2032)
    6. 9.6 SĂĽdamerika
      1. 9.6.1 Industrieabfallmanagement in Südamerika nach Art (Mrd. USD, 2018–2032)
      2. 9.6.2 Industrieabfallmanagement in Südamerika nach Dienstleistung (Mrd. USD, 2018–2032)
      3. 9.6.3 Industrieabfallmanagement in Südamerika nach Abfallart (Mrd. USD, 2018–2032)
      4. 9.6.4 Brasilien
        1. 9.6.4.1 Industrielle Abfallbewirtschaftung in Brasilien nach Art (Mrd. USD, 2018–2032)
        2. 9.6.4.2 Industrielle Abfallbewirtschaftung in Brasilien nach Dienstleistung (Mrd. USD, 2018–2032)
        3. 9.6.4.3 Industrielle Abfallbewirtschaftung in Brasilien nach Abfallart (Mrd. USD, 2018–2032)
      5. 9.6.5 Argentinien
        1. 9.6.5.1 Industrielle Abfallbewirtschaftung in Argentinien nach Art (Mrd. USD, 2018–2032)
        2. 9.6.5.2 Industrielle Abfallbewirtschaftung in Argentinien nach Dienstleistung (Mrd. USD, 2018–2032)
        3. 9.6.5.3 Industrielle Abfallbewirtschaftung in Argentinien nach Abfallart (Mrd. USD, 2018–2032)
      6. 9.6.6 Restliches SĂĽdamerika
        1. 9.6.6.1 Industrielle Abfallbewirtschaftung im übrigen Südamerika nach Art (Mrd. USD, 2018–2032)
        2. 9.6.6.2 Industrielle Abfallbewirtschaftung im übrigen Südamerika nach Dienstleistung (Mrd. USD, 2018–2032)
        3. 9.6.6.3 Industrielle Abfallbewirtschaftung im übrigen Südamerika nach Abfallart (Mrd. USD, 2018–2032)
  10. 10 WETTBEWERBSLANDSCHAFT
    1. 10.1 Einleitung
    2. 10.2 Marktanteilsanalyse der Hauptakteure, 2022 (%)
    3. 10.3 Wettbewerbsbenchmarking
    4. 10.4 Dashboard der Wettbewerber
    5. 10.5 Wichtige Wachstumsstrategien im Markt
    6. 10.6 Wichtige Entwicklungen und Wachstumsstrategien
      1. 10.6.1 Entwicklung neuer Produkte
      2. 10.6.2 Fusionen und Ăśbernahmen
      3. 10.6.3 Verträge und Vereinbarungen
      4. 10.6.4 Erweiterungen und Investitionen
  11. 11 FIRMENPROFILE
    1. 11.1 Daiseki Co., Ltd.
      1. 11.1.1 FirmenĂĽbersicht
      2. 11.1.2 FinanzĂĽbersicht
      3. 11.1.3 Angebotene Produkte
      4. 11.1.4 Wichtige Entwicklungen
      5. 11.1.5 SWOT-Analyse
      6. 11.1.6 Wichtige Strategien
    2. 11.2 Veolia Environmental Inc.
      1. 11.2.1 FirmenĂĽbersicht
      2. 11.2.2 FinanzĂĽbersicht
      3. 11.2.3 Angebotene Produkte
      4. 11.2.4 Wichtige Entwicklungen
      5. 11.2.5 SWOT-Analyse
      6. 11.2.6 Wichtige Strategien
    3. 11.3 EnviroServ Waste
      1. 11.3.1 FirmenĂĽbersicht
      2. 11.3.2 FinanzĂĽbersicht
      3. 11.3.3 Angebotene Produkte
      4. 11.3.4 Wichtige Entwicklungen
      5. 11.3.5 SWOT-Analyse
      6. 11.3.6 Wichtige Strategien
    4. 11.4 SembCorp
      1. 11.4.1 FirmenĂĽbersicht
      2. 11.4.2 FinanzĂĽbersicht
      3. 11.4.3 Angebotene Produkte
      4. 11.4.4 Wichtige Entwicklungen
      5. 11.4.5 SWOT-Analyse
      6. 11.4.6 Wichtige Strategien
    5. 11.5 Reclay Group
      1. 11.5.1 FirmenĂĽbersicht
      2. 11.5.2 FinanzĂĽbersicht
      3. 11.5.3 Angebotene Produkte
      4. 11.5.4 Wichtige Entwicklungen
      5. 11.5.5 SWOT-Analyse
      6. 11.5.6 SchlĂĽsselstrategien
    6. 11.6 SA Waste Holding Pvt Ltd.
      1. 11.6.1 UnternehmensĂĽbersicht
      2. 11.6.2 FinanzĂĽbersicht
      3. 11.6.3 Angebotene Produkte
      4. 11.6.4 Wichtige Entwicklungen
      5. 11.6.5 SWOT-Analyse
      6. 11.6.6 SchlĂĽsselstrategien
    7. 11.7 Suez Environnement
      1. 11.7.1 UnternehmensĂĽbersicht
      2. 11.7.2 FinanzĂĽbersicht
      3. 11.7.3 Angebotene Produkte
      4. 11.7.4 Wichtige Entwicklungen
      5. 11.7.5 SWOT-Analyse
      6. 11.7.6 SchlĂĽsselstrategien
    8. 11.8 Stericycle Inc.
      1. 11.8.1 UnternehmensĂĽbersicht
      2. 11.8.2 FinanzĂĽbersicht
      3. 11.8.3 Angebotene Produkte
      4. 11.8.4 Wichtige Entwicklungen
      5. 11.8.5 SWOT-Analyse
      6. 11.8.6 Wichtige Strategien
    9. 11.9 Himark BioGas Inc.
      1. 11.9.1 UnternehmensĂĽbersicht
      2. 11.9.2 FinanzĂĽbersicht
      3. 11.9.3 Angebotene Produkte
      4. 11.9.4 Wichtige Entwicklungen
      5. 11.9.5 SWOT-Analyse
      6. 11.9.6 Wichtige Strategien
    10. 11.10 Clean Harbor
      1. 11.10.1 UnternehmensĂĽbersicht
      2. 11.10.2 FinanzĂĽbersicht
      3. 11.10.3 Angebotene Produkte
      4. 11.10.4 Wichtige Entwicklungen
      5. 11.10.5 SWOT-Analyse
      6. 11.10.6 SchlĂĽsselstrategien
    11. ?
    12. TABELLENLISTE
    13. TABELLE 1. MARKT FÜR INDUSTRIELLE ABFALLWIRTSCHAFTUNG, NACH REGION, 2018–2032
    14. TABELLE 2. NORDAMERIKA: MARKT FÜR INDUSTRIELLE ABFALLWIRTSCHAFTUNG, NACH ABFALLART, 2018–2032
    15. TABELLE 3. NORDAMERIKA: MARKT FÜR INDUSTRIELLE ABFALLWIRTSCHAFTUNG, NACH ABFALLART, 2018–2032
    16. TABELLE 4. NORDAMERIKA: MARKT FÜR INDUSTRIELLE ABFALLWIRTSCHAFTUNG, NACH DIENSTLEISTUNG, 2018–2032
    17. TABELLE 5. EUROPA: MARKT FĂśR INDUSTRIELLE ABFALLWIRTSCHAFTUNG, NACH ABFALLART, 2018 -2032
    18. TABELLE 7. EUROPA: MARKT FÜR INDUSTRIELLE ABFALLWIRTSCHAFT, NACH DIENSTLEISTUNG, 2018–2032
    19. TABELLE 8. ASIEN-PAZIFIK: MARKT FÜR INDUSTRIELLE ABFALLWIRTSCHAFT, NACH ART, 2018–2032
    20. TABELLE 9. ASIEN-PAZIFIK: MARKT FÜR INDUSTRIELLE ABFALLWIRTSCHAFT, NACH ABFALLART, 2018–2032
    21. TABELLE 10. ASIEN-PAZIFIK: MARKT FÜR INDUSTRIELLE ABFALLWIRTSCHAFT, NACH DIENSTLEISTUNG, 2018–2032
    22. TABELLE 11. NAHER OSTEN UND AFRIKA: MARKT FÜR INDUSTRIELLE ABFALLWIRTSCHAFT, NACH ART, 2018–2032
    23. TABELLE 12. NAHER OSTEN UND AFRIKA: MARKT FÜR INDUSTRIELLE ABFALLWIRTSCHAFT, NACH ABFALL TYP, 2018–2032
    24. TABELLE 13. NAHER OSTEN UND AFRIKA: MARKT FÜR INDUSTRIELLE ABFALLWIRTSCHAFTUNG, NACH DIENSTLEISTUNG, 2018–2032
    25. TABELLE 14. SÜDAMERIKA: MARKT FÜR INDUSTRIELLE ABFALLWIRTSCHAFTUNG, NACH TYP, 2018–2032
    26. TABELLE 15. SÜDAMERIKA: MARKT FÜR INDUSTRIELLE ABFALLWIRTSCHAFTUNG, NACH ABFALLART, 2018–2032
    27. TABELLE 16. SÜDAMERIKA: MARKT FÜR INDUSTRIELLE ABFALLWIRTSCHAFTUNG, NACH DIENSTLEISTUNG, 2018–2032
    28. ?
    29. ABBILDUNGSVERZEICHNIS
    30. ABBILDUNG 1. MARKTĂśBERSICHT
    31. ABBILDUNG 2. ANALYSE DER MARKTATTRACTIVEN MARKT FĂśR INDUSTRIELLE ABFALLWIRTSCHAFTUNG
    32. ABBILDUNG 3. GLOBALE MARKTANALYSE FĂśR INDUSTRIELLE ABFALLWIRTSCHAFTUNG NACH ART
    33. ABBILDUNG 4. GLOBALE MARKTANALYSE FĂśR INDUSTRIELLE ABFALLWIRTSCHAFTUNG NACH ABFALLART
    34. ABBILDUNG 5. GLOBALE MARKTANALYSE FĂśR INDUSTRIELLE ABFALLWIRTSCHAFTUNG NACH DIENSTLEISTUNG
    35. ABBILDUNG 6. GLOBALE MARKTANALYSE FĂśR INDUSTRIELLE ABFALLWIRTSCHAFTUNG NACH REGION
    36. ABBILDUNG 7. MARKT FĂśR INDUSTRIELLE ABFALLWIRTSCHAFTUNG: STRUKTUR
    37. ABBILDUNG 8. FORSCHUNGSPROZESS VON MRFR
    38. ABBILDUNG 9. TOP-DOWN- UND BOTTOM-UP-ANSÄTZE
    39. ABBILDUNG 10. MARKTDYNAMIK: MARKT FĂśR INDUSTRIELLE ABFALLWIRTSCHAFTUNG
    40. ABBILDUNG 11. TREIBER: AUSWIRKUNGEN ANALYSE
    41. ABBILDUNG 12. BESCHRÄNKUNG: AUSWIRKUNGSANALYSE
    42. ABBILDUNG 13. LIEFER-/WERTSCHÄTZUNGSKETTE: GLOBALER MARKT FÜR INDUSTRIELLE ABFALLWIRTSCHAFTUNG
    43. ABBILDUNG 14. PORTERS FÜNF-KRÄFTE-ANALYSE: MARKT FÜR INDUSTRIELLE ABFALLWIRTSCHAFTUNG
    44. ABBILDUNG 15. MARKT FĂśR INDUSTRIELLE ABFALLWIRTSCHAFTUNG NACH ART, 2022 (%-ANTEIL)
    45. ABBILDUNG 16. MARKT FĂśR INDUSTRIELLE ABFALLWIRTSCHAFTUNG NACH ABFALLART, 2022 (%-ANTEIL)
    46. ABBILDUNG 17. MARKT FĂśR INDUSTRIELLE ABFALLWIRTSCHAFTUNG NACH DIENSTLEISTUNG, 2022 (%-ANTEIL)
    47. ABBILDUNG 18. MARKTANTEIL DER INDUSTRIELLE ABFALLWIRTSCHAFTUNG NACH REGION ANTEIL)
    48. ABBILDUNG 19. NORDAMERIKA: MARKTANTEIL INDUSTRIELLER ABFALLWIRTSCHAFTUNG NACH LÄNDERN, 2022 (%-ANTEIL)
    49. ABBILDUNG 20. EUROPA: MARKTANTEIL INDUSTRIELLER ABFALLWIRTSCHAFTUNG NACH LÄNDERN, 2022 (%-ANTEIL)
    50. ABBILDUNG 21. ASIEN-PAZIFIK: MARKTANTEIL INDUSTRIELLER ABFALLWIRTSCHAFTUNG NACH LÄNDERN, 2022 (%-ANTEIL)
    51. ABBILDUNG 22. NAHER OSTEN UND AFRIKA: MARKTANTEIL INDUSTRIELLER ABFALLWIRTSCHAFTUNG NACH LÄNDERN, 2022 (%-ANTEIL)
    52. ABBILDUNG 23. SÜDAMERIKA: MARKTANTEIL INDUSTRIELLER ABFALLWIRTSCHAFTUNG NACH LÄNDERN, 2022 (%-ANTEIL)
    53. ABBILDUNG 24. WICHTIGSTE ANALYSE DER MARKTANTEILE DER HERSTELLER, 2022
    54. ABBILDUNG 25. VERTRÄGE & VEREINBARUNGEN: DIE WICHTIGSTE STRATEGIE DER WICHTIGSTEN AKTEURE AUF DEM MARKT FÜR INDUSTRIELLE ABFALLWIRTSCHAFTUNG
    55. ABBILDUNG 26. DAISEKI CO., LTD.: ĂśBERSICHT ZUM FINANZĂśBERBLICK
    56. ABBILDUNG 27. DAISEKI CO., LTD.: SWOT-ANALYSE
    57. ABBILDUNG 28. VEOLIA ENVIRONMENTAL INC.: ĂśBERSICHT ZUM FINANZĂśBERBLICK
    58. ABBILDUNG 29. VEOLIA ENVIRONMENTAL INC.: SWOT-ANALYSE
    59. ABBILDUNG 30. ENVIROSERV WASTE: ĂśBERSICHT ZUM FINANZĂśBERBLICK
    60. ABBILDUNG 31. ENVIROSERV WASTE: SWOT-ANALYSE
    61. ABBILDUNG 32. SEMBCORP: ĂśBERSICHT ZUM FINANZĂśBERBLICK
    62. ABBILDUNG 33. SEMBCORP: SWOT-ANALYSE
    63. ABBILDUNG 34. RECLAY GROUP: ĂśBERSICHT DER FINANZIELLEN ĂśBERSICHT
    64. ABBILDUNG 35. RECLAY GROUP: SWOT-ANALYSE
    65. ABBILDUNG 36. SA WASTE HOLDING PVT LTD.: ĂśBERSICHT DER FINANZIELLEN ĂśBERSICHT
    66. ABBILDUNG 37. SA WASTE HOLDING PVT LTD.: SWOT-ANALYSE
    67. ABBILDUNG 38. SUEZ ENVIRONNEMENT: ĂśBERSICHT DER FINANZIELLEN ĂśBERSICHT
    68. ABBILDUNG 39. SUEZ ENVIRONNEMENT: SWOT-ANALYSE
    69. ABBILDUNG 40. STERICYCLE INC.: ĂśBERSICHT DER FINANZIELLEN ĂśBERSICHT
    70. ABBILDUNG 41. STERICYCLE INC.: SWOT-ANALYSE
    71. ABBILDUNG 42. HIMARK BIOGAS INC.: ĂśBERSICHT DER FINANZIELLEN ĂśBERSICHT ĂśBERSICHT
    72. ABBILDUNG 43. HIMARK BIOGAS INC.: SWOT-ANALYSE
    73. ABBILDUNG 44. CLEAN HARBOR: FINANZĂśBERSICHT ĂśBERSICHT
    74. ABBILDUNG 45. CLEAN HARBOR: SWOT-ANALYSE

Marktsegmentierung fĂĽr die industrielle Abfallbewirtschaftung

Marktausblick für die industrielle Abfallbewirtschaftung nach Abfallart (Mrd. USD, 2024–2032)

  • Bau- und Abbruchabfälle

  • Produktionsabfälle

  • Chemische Abfälle

  • Bergbauabfälle

  • Ă–l- und Gasabfälle

  • Landwirtschaftliche Abfälle

  • AtommĂĽll

  • Sonstige

Marktausblick für die Entsorgung industrieller Abfälle nach Dienstleistung (Mrd. USD, 2024–2032)

  • Deponie

  • Recycling

  • Verbrennung

Marktausblick für die Entsorgung industrieller Abfälle nach Regionen (Mrd. USD, 2024–2032)

  • Marktausblick fĂĽr die Entsorgung industrieller Abfälle nach Regionen (Mrd. USD, 2024–2032)

    • Marktausblick fĂĽr die Entsorgung industrieller Abfälle nach Regionen Abfallart

      • Bau- und Abbruchabfälle

      • Produktionsabfälle

      • Chemische Abfälle

      • Bergbauabfälle

      • Ă–l- und Gasabfälle

      • Landwirtschaftliche Abfälle

      • AtommĂĽll

      • Sonstige

    • Markt fĂĽr industrielle Abfallentsorgung in Nordamerika nach Dienstleistung

      • Deponie

      • Recycling

      • Verbrennung

    • Ausblick USA (Mrd. USD, 2024–2032)

    • Markt fĂĽr industrielle Abfallentsorgung in den USA nach Abfallart

      • Bau & Abbruchabfälle

      • Produktionsabfälle

      • Chemieabfälle

      • Bergbauabfälle

      • Ă–l & Gasabfälle

      • Landwirtschaftliche Abfälle

      • AtommĂĽll

      • Sonstige

    • US-Markt fĂĽr industrielle Abfallentsorgung nach Dienstleistung

      • Deponie

      • Recycling

      • Verbrennung

    • KANADA-Ausblick (Mrd. USD, 2024–2032)

    • KANADA-Markt fĂĽr industrielle Abfallentsorgung nach Abfallart

      • Bau & Abbruchabfälle

      • Produktionsabfälle

      • Chemieabfälle

      • Bergbauabfälle

      • Ă–l & Gasabfälle

      • Landwirtschaftliche Abfälle

      • AtommĂĽll

      • Sonstige

    • KANADISCHER Markt fĂĽr industrielle Abfallentsorgung nach Dienstleistung

      • Deponie

      • Recycling

      • Verbrennung

  • Ausblick Europa (Mrd. USD, 2024–2032)

    • Europäischer Markt fĂĽr industrielle Abfallentsorgung nach Abfallart

      • Bau & Abbruchabfälle

      • Produktionsabfälle

      • Chemieabfälle

      • Bergbauabfälle

      • Ă–l & Gasabfälle

      • Landwirtschaftliche Abfälle

      • AtommĂĽll

      • Sonstige

    • Europäischer Markt fĂĽr industrielle Abfallentsorgung nach Dienstleistung

      • Deponie

      • Recycling

      • Verbrennung

    • Ausblick Deutschland (Mrd. USD, 2024–2032)

    • Deutscher Markt fĂĽr industrielle Abfallentsorgung nach Abfallart

      • Bau & Abbruchabfälle

      • Produktionsabfälle

      • Chemieabfälle

      • Bergbauabfälle

      • Ă–l & Gasabfälle

      • Landwirtschaftliche Abfälle

      • AtommĂĽll

      • Sonstige

    • Markt fĂĽr Industrieabfälle in Deutschland nach Dienstleistung

      • Deponie

      • Recycling

      • Verbrennung

    • Ausblick fĂĽr Frankreich (Mrd. USD, 2024–2032)

    • Markt fĂĽr Industrieabfälle in Frankreich nach Abfallart

      • Bau & Abbruchabfälle

      • Produktionsabfälle

      • Chemieabfälle

      • Bergbauabfälle

      • Ă–l & Gasabfälle

      • Landwirtschaftliche Abfälle

      • AtommĂĽll

      • Sonstige

    • Industrieabfallwirtschaft in Frankreich nach Dienstleistung

      • Deponie

      • Recycling

      • Verbrennung

    • Ausblick GroĂźbritannien (Mrd. USD, 2024–2032)

    • Industrieabfallwirtschaft in GroĂźbritannien nach Abfallart

      • Bau & Abbruchabfälle

      • Produktionsabfälle

      • Chemieabfälle

      • Bergbauabfälle

      • Ă–l & Gasabfälle

      • Landwirtschaftliche Abfälle

      • AtommĂĽll

      • Sonstige

    • Markt fĂĽr Industrieabfälle in GroĂźbritannien nach Dienstleistung

      • Deponie

      • Recycling

      • Verbrennung

    • Ausblick Italien (Mrd. USD, 2024–2032)

    • Markt fĂĽr Industrieabfälle in Italien nach Abfallart

      • Bau & Abbruchabfälle

      • Produktionsabfälle

      • Chemieabfälle

      • Bergbauabfälle

      • Ă–l & Gasabfälle

      • Landwirtschaftliche Abfälle

      • AtommĂĽll

      • Sonstige

    • ITALIEN: Markt fĂĽr Industrieabfallbewirtschaftung nach Dienstleistung

      • Deponie

      • Recycling

      • Verbrennung

    • SPANIEN: Ausblick (Mrd. USD, 2024–2032)

    • Spanien: Markt fĂĽr Industrieabfallbewirtschaftung nach Abfallart

      • Bau & Abbruchabfälle

      • Produktionsabfälle

      • Chemieabfälle

      • Bergbauabfälle

      • Ă–l & Gasabfälle

      • Landwirtschaftliche Abfälle

      • AtommĂĽll

      • Sonstige

    • Spanien: Markt fĂĽr Industrieabfälle nach Dienstleistung

      • Deponie

      • Recycling

      • Verbrennung

    • Ausblick fĂĽr das ĂĽbrige Europa (Mrd. USD, 2024–2032)

    • Markt fĂĽr Industrieabfälle nach Abfallart im ĂĽbrigen Europa

      • Bau & Abbruchabfälle

      • Produktionsabfälle

      • Chemieabfälle

      • Bergbauabfälle

      • Ă–l & Gasabfälle

      • Landwirtschaftliche Abfälle

      • AtommĂĽll

      • Sonstige

    • ĂśBRIGES EUROPA: Markt fĂĽr industrielle Abfallentsorgung nach Dienstleistung

      • Deponie

      • Recycling

      • Verbrennung

  • Ausblick Asien-Pazifik (Mrd. USD, 2024–2032)

    • Markt fĂĽr industrielle Abfallentsorgung im Asien-Pazifik-Raum nach Abfallarten Typ

      • Bau- und Abbruchabfälle

      • Produktionsabfälle

      • Chemische Abfälle

      • Bergbauabfälle

      • Ă–l- und Gasabfälle

      • Landwirtschaftliche Abfälle

      • AtommĂĽll

      • Sonstige

    • Markt fĂĽr industrielle Abfallentsorgung im asiatisch-pazifischen Raum nach Dienstleistung

      • Deponie

      • Recycling

      • Verbrennung

    • Ausblick fĂĽr China (Mrd. USD, 2024–2032)

    • Markt fĂĽr industrielle Abfallentsorgung in China nach Abfallart

      • Bau & Abbruchabfälle

      • Produktionsabfälle

      • Chemieabfälle

      • Bergbauabfälle

      • Ă–l & Gasabfälle

      • Landwirtschaftliche Abfälle

      • AtommĂĽll

      • Sonstige

    • Markt fĂĽr industrielle Abfallentsorgung in China nach Dienstleistung

      • Deponie

      • Recycling

      • Verbrennung

    • Ausblick fĂĽr Japan (Mrd. USD, 2024–2032)

    • Markt fĂĽr industrielle Abfallentsorgung in Japan nach Abfallart

      • Bau & Abbruchabfälle

      • Produktionsabfälle

      • Chemieabfälle

      • Bergbauabfälle

      • Ă–l & Gasabfälle

      • Landwirtschaftliche Abfälle

      • AtommĂĽll

      • Sonstige

    • Japanischer Markt fĂĽr industrielle Abfallentsorgung nach Dienstleistung

      • Deponie

      • Recycling

      • Verbrennung

    • Ausblick Indien (Mrd. USD, 2024–2032)

    • Indischer Markt fĂĽr industrielle Abfallentsorgung nach Abfallart

      • Bau & Abbruchabfälle

      • Produktionsabfälle

      • Chemieabfälle

      • Bergbauabfälle

      • Ă–l & Gasabfälle

      • Landwirtschaftliche Abfälle

      • AtommĂĽll

      • Sonstige

    • Markt fĂĽr industrielle Abfallentsorgung in Indien nach Dienstleistung

      • Deponie

      • Recycling

      • Verbrennung

    • Ausblick fĂĽr Australien (Mrd. USD, 2024–2032)

    • Markt fĂĽr industrielle Abfallentsorgung in Australien nach Abfallart

      • Bau & Abbruchabfälle

      • Produktionsabfälle

      • Chemieabfälle

      • Bergbauabfälle

      • Ă–l & Gasabfälle

      • Landwirtschaftliche Abfälle

      • AtommĂĽll

      • Sonstige

    • Markt fĂĽr Industrieabfallmanagement in Australien nach Dienstleistung

      • Deponie

      • Recycling

      • Verbrennung

    • Ausblick fĂĽr den Rest der Region Asien-Pazifik (Mrd. USD, 2024–2032)

    • Markt fĂĽr Industrieabfallmanagement im Rest der Region Asien-Pazifik nach Abfallart

      • Bau & Abbruchabfälle

      • Produktionsabfälle

      • Chemische Abfälle

      • Bergbauabfälle

      • Ă–l- und Gasabfälle

      • Landwirtschaftliche Abfälle

      • AtommĂĽll

      • Sonstige

    • Markt fĂĽr Industrieabfallmanagement im Rest der Region Asien-Pazifik nach Dienstleistungsangebot

      • Deponie

      • Recycling

      • Verbrennung

  • Ausblick fĂĽr den Rest der Welt (Mrd. USD, 2024–2032)

    • Markt fĂĽr die Entsorgung industrieller Abfälle im Rest der Welt nach Abfallart

      • Bau- und Abbruchabfälle

      • Produktionsabfälle

      • Chemische Abfälle

      • Bergbauabfälle

      • Ă–l- und Gasabfälle

      • Landwirtschaftliche Abfälle

      • AtommĂĽll

      • Sonstige

    • Markt fĂĽr industrielle Abfallentsorgung im Rest der Welt nach Dienstleistung

      • Deponie

      • Recycling

      • Verbrennung

    • Ausblick fĂĽr den Nahen Osten (Mrd. USD, 2024–2032)

    • Markt fĂĽr industrielle Abfallentsorgung im Nahen Osten nach Abfallart

      • Bau & Abbruchabfälle

      • Produktionsabfälle

      • Chemieabfälle

      • Bergbauabfälle

      • Ă–l & Gasabfälle

      • Landwirtschaftliche Abfälle

      • AtommĂĽll

      • Sonstige

    • Markt fĂĽr industrielle Abfallentsorgung im Nahen Osten nach Dienstleistung

      • Deponie

      • Recycling

      • Verbrennung

    • Ausblick Afrika (Mrd. USD, 2024–2032)

    • Markt fĂĽr industrielle Abfallentsorgung in Afrika nach Abfallart

      • Bau & Abbruchabfälle

      • Produktionsabfälle

      • Chemieabfälle

      • Bergbauabfälle

      • Ă–l & Gasabfälle

      • Landwirtschaftliche Abfälle

      • AtommĂĽll

      • Sonstige

    • Markt fĂĽr industrielle Abfallentsorgung in Afrika nach Dienstleistung

      • Deponie

      • Recycling

      • Verbrennung

    • Ausblick Lateinamerika (Mrd. USD, 2024–2032)

    • Markt fĂĽr industrielle Abfallentsorgung in Lateinamerika nach Abfallart

      • Bau & Abbruchabfälle

      • Produktionsabfälle

      • Chemische Abfälle

      • Bergbauabfälle

      • Ă–l- und Gasabfälle

      • Landwirtschaftliche Abfälle

      • AtommĂĽll

      • Sonstige

    • Markt fĂĽr Industrieabfallmanagement in Lateinamerika nach Dienstleistungsangebot

      • Deponie

      • Recycling

      • Verbrennung

Compare Licence

×
Features License Type
Single User Multiuser License Enterprise User
Price $4,950 $5,950 $7,250
Maximum User Access Limit 1 User Upto 10 Users Unrestricted Access Throughout the Organization
Free Customization âś“ âś“ âś“
Direct Access to Analyst âś“ âś“ âś“
Deliverable Format âś“ âś“ âś“
Platform Access âś— âś— âś“
Discount on Next Purchase 10% 15% 15%
Printable Versions âś— âś— âś“