


 来源:二手资料研究、一手资料研究、MRFR 数据库和分析师评论
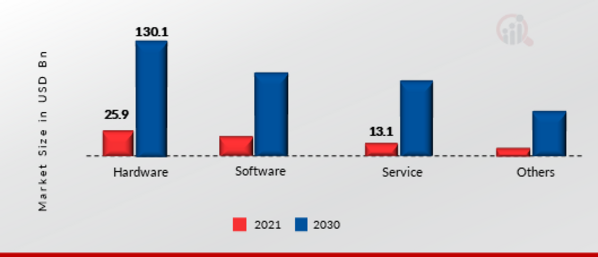 来源:二手资料研究、一手资料研究、MRFR 数据库和分析师评论
 来源:二手资料研究、一手资料研究、MRFR 数据库和分析师评论
What is the current valuation of the Proximity Marketing Market as of 2024?
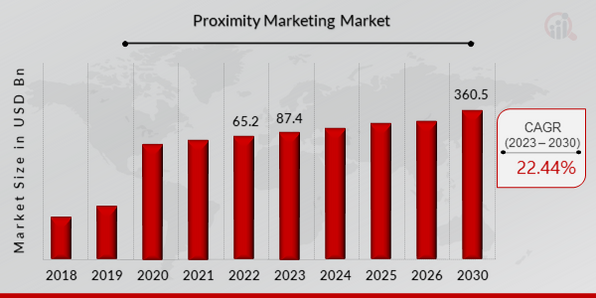
The Proximity Marketing Market was valued at 107.01 USD Billion in 2024.
What is the projected market size for the Proximity Marketing Market in 2035?
The market is projected to reach 992.18 USD Billion by 2035.
What is the expected CAGR for the Proximity Marketing Market during the forecast period 2025 - 2035?
The expected CAGR for the Proximity Marketing Market during 2025 - 2035 is 22.44%.
Which companies are considered key players in the Proximity Marketing Market?
Key players in the market include Google, Apple, Samsung, IBM, Microsoft, Qualcomm, Nokia, Bluetooth SIG, and Proxama.
What are the main components of the Proximity Marketing Market?
The main components include Hardware, Software, Service, and Others, with valuations ranging from 20.0 to 360.0 USD Billion.
How do consulting services contribute to the Proximity Marketing Market?
Consulting services contributed 10.7 USD Billion to the market, with projections reaching 100.0 USD Billion.
What is the valuation of technology services in the Proximity Marketing Market?
Technology services are valued at 60.0 USD Billion, with expectations to grow to 600.0 USD Billion.
What is the significance of integration services in the Proximity Marketing Market?
Integration services are valued at 36.31 USD Billion, with a potential increase to 292.18 USD Billion.
How does the Proximity Marketing Market's growth compare to other digital marketing sectors?
The Proximity Marketing Market's growth appears robust, with a projected increase to 992.18 USD Billion by 2035.
What trends are influencing the Proximity Marketing Market in 2025?
Trends influencing the market include advancements in technology and increasing adoption of proximity marketing solutions by businesses.


