Request Free Sample ×

Kindly complete the form below to receive a free sample of this Report

* Please use a valid business email

Leading companies partner with us for data-driven Insights

clients tt-cursor
Hero Background

Live Streaming Market

ID: MRFR/ICT/8656-CR
127 Pages
Aarti Dhapte
May 2025

直播市场研究报告信息按组件(平台、工业和服务)、应用领域(媒体和娱乐、电子竞技、活动、零售、政府和其他)和地区(北美、欧洲、亚太地区、中东和非洲以及南美)划分 - 预测至 2035 年

分享
Download PDF ×

We do not share your information with anyone. However, we may send you emails based on your report interest from time to time. You may contact us at any time to opt-out.

Live Streaming Market Infographic
Purchase Options

直播市场概览

p2024 年,直播市场规模价值 1276.811 亿美元。预计应用跟踪系统行业将从 2025 年的 1549.428 亿美元增长到 2035 年的 10507.756 亿美元,预测期内(2025-2035 年)的复合年增长率 (CAGR) 为 22.8%。

高速互联网接入的可用性和可负担性的提高、各行业消费者对直播视频消费的增加以及通过直播视频实现的品牌参与度和覆盖面的扩大,正在推动直播市场的增长。

MRFR 分析师表示:“在线播放的视频内容对潜在客户更具吸引力。据报道,超过 67% 的在线视频消费者预计会在直播结束后立即购买产品和服务。此外,来自各个组织的营销活动报告称,79% 的潜在客户进行了真诚的对话。营销人员主要关注那些足够精准和描述性的视频,以解释他们的产品和使用的好处。”

 图 1:直播市场价值(2019-2035)美元百万

直播市场价值 (2019-2035) 百万美元

 来源:二手资料研究、一手资料研究、MRFR 数据库和分析师评论

直播市场 strong 机遇

h3增强现实 (AR) 和虚拟现实 (VR) 技术的进步有望增强直播的沉浸式体验 p直播更具沉浸感AR 和 VR 的出现。我们可以预期,所有这些技术在今年都将得到更广泛的应用。例如,我们现在可以在 AR 直播中添加数字特效或交互式滤镜。这极大地提升了观看体验。VR 直播让观众沉浸在完全沉浸式的虚拟世界中,这也是虚拟世界日益普及的一个例证。AR 眼镜和头戴式耳机是目前日益流行的两项尖端技术。随着价格越来越实惠,这些技术已成为日常生活的一部分,为观众带来了全新的沉浸式体验。

实时直播中的人工智能

p人工智能正在以多种方式改进直播。通过自动内容审核、优化视频质量、自动添加字幕以及根据观众的观看偏好提供个性化推荐,人工智能正被用于创造更安全的环境。以一种更具未来感的方式,主播们已经在使用人工智能生成的虚拟形象或虚拟网红进行直播。人工智能可以生成实时统计数据,主播可以利用这些数据来了解用户行为和趋势,以及其作品的表现。

NextVR 示例

p一家名为 NextVR 的公司专注于利用虚拟现实技术进行赛事直播。为了给观众带来引人入胜的直播体验,他们与 NBA 和 NFL 等体育联盟合作。借助 NextVR,观众可以坐在场边或赛场上,以虚拟现实的方式观看比赛,身临其境地体验比赛。在 NBA 总决赛期间,球迷们体验了增强现实技术,这让他们能够更近距离地感受场上的精彩瞬间。为了让球迷们感觉自己仿佛坐在场边观看比赛,NBA 与 NextVR 合作开发了虚拟现实和增强现实体验。球迷可以使用智能手机或虚拟现实头戴设备从多个角度观看比赛,包括 360 度的赛场全景。然而,叠加在直播电视流上的增强现实图像才是真正的魅力所在。除了现场比赛录像,球迷还可以实时查看球员数据、比赛精彩片段和其他统计数据。球迷们仿佛置身于比赛现场,从而获得引人入胜且富有教育意义的体验。

AR 体育视觉效果

p增强现实 (AR) 技术正被用于体育广播,以制作更有趣、更具教育意义的视觉效果。ESPN 和 NBC 等电视网正在使用 AR 来生成球员统计数据、虚拟记分牌和其他实时数据。这使得体验更加身临其境,并提高了观众对比赛的理解。

广告是增强现实的另一个应用。麦当劳和百事可乐等企业已经开发了增强现实广告,将虚拟事物叠加到实际景观上。例如,百事可乐开发了一则增强现实广告,让用户在街上也能玩虚拟足球比赛。球员和虚拟球叠加在直播视频流之上。

直播市场 strong细分洞察

h3 直播 strong组件洞察 p直播市场根据组件分为平台和服务。各种提供商提供的直播平台帮助品牌与现有和潜在客户互动。提供商还为客户提供相关服务,帮助他们有效地发起直播活动。平台细分市场在2024年占据了全球市场的主导地位,而平台预计将成为预测期内增长最快的细分市场。直播平台是一种视频托管解决方案,允许用户上传和广播视频内容给观众。一些主要的直播平台包括Twitch、YouTube、Vimeo、Dacast和IBM Video Cloud。用户根据各种参数(包括身份验证、授权、定制和定价)选择直播平台。因此,在这个市场中运营的参与者相互竞争,为用户提供一流的(满足上述所有参数的)平台。

图 2:2024 年和 2035 年直播市场份额(按技术划分)(百万美元)

2024 年和 2035 年直播市场份额(按技术划分)(百万美元)

来源:二手资料研究、一手资料研究、MRFR 数据库和分析师评论

直播 应用领域 strong洞察

p此细分市场分为混合激光-LED 系统和纯激光荧光粉系统。媒体和娱乐细分市场在 2024 年占据全球市场主导地位,而预计在预测期内,媒体和娱乐细分市场将成为增长最快的细分市场。媒体和娱乐涵盖新闻广播公司、电影制作和活动管理公司,这些公司负责推广其活动并向目标受众报道各种国家级活动。许多媒体和娱乐公司正在转向直播服务,以吸引目标受众,从而推动整个市场的发展。

直播 strong系统区域洞察

p根据地区,全球直播细分市场分为北美、欧洲、亚太地区、中东和非洲以及南美和中美。北美在 2024 年占据了最大的市场份额,预计在预测期内将达到这一水平。然而,预计北美在预测期内的复合年增长率最高。该地区通过宽带或移动网络服务的强大互联网连接网络以及众多直播平台的可用性正在加速直播市场的增长。与其他细分领域相比,人们对直播视频的偏好逐年增加。超过 44% 的人口表示,自直播平台推出以来,他们观看的电视频道减少了。深入研究发现,在美国,86% 的人更喜欢观看体育赛事直播,而不是其他流媒体内容。该国主要全球参与者的数量是促进市场增长的重要因素。据报道,直播的品牌参与度带来了较高的销售转化率,更多潜在客户参与了在线组织的销售活动。亚太地区在直播市场占据主导地位,主要是因为该地区年轻人口众多。此外,其他促成市场增长的因素包括直播视频服务的蓬勃发展,以及对直播的需求不断增长,而传统电视频道则需要用户等待他们喜爱的节目播出。此外,该地区数字创新的采用率不断上升,互联网人口不断增长,印度、马来西亚、新加坡和中国等新兴经济体也蓬勃发展。预计该地区数字化转型的速度将超过美国零售业的增长率,采用数字化战略将推动整体经济增长。

欧洲地区的直播市场由亚马逊的 Twitch、谷歌的 YouTube、Facebook Gaming 和微软的 Mixer 等公司主导。这些关键参与者正在建立战略合作伙伴关系,以最大限度地抢占市场份额。例如,游戏工作室动视暴雪 (Activision Blizzard) 和谷歌签署了一项为期多年的合作伙伴关系,将直播包括《使命召唤》联赛和《守望先锋》联赛在内的电子竞技赛事。然而,其他市场参与者正在通过各种战略举措尝试扩大市场。

图 3:2024 年和 2035 年各地区直播市场价值(百万美元)

2024 年和 2035 年各地区直播市场价值(百万美元)          

来源:二手资料、一手资料、MRFR 数据库和分析师评论

此外,应用程序跟踪系统市场范围内考虑的国家包括美国、加拿大、墨西哥、英国、德国、法国、意大利、西班牙、瑞士、奥地利、比利时、丹麦、芬兰、希腊、匈牙利、意大利、卢森堡、荷兰、挪威、波兰、葡萄牙、斯洛伐克、瑞典、罗马尼亚、爱尔兰、中国、日本、新加坡、马来西亚、印度尼西亚、菲律宾、韩国、香港、澳门、新加坡、文莱、印度、澳大利亚和新西兰、南非、埃及、尼日利亚、沙特阿拉伯、卡塔尔、阿拉伯联合酋长国、巴林、科威特和阿曼、巴西、阿根廷、智利等。

直播关键市场参与者和竞争洞察

p许多全球、区域和本地供应商是直播市场的特点。市场竞争非常激烈,所有参与者都在争夺市场份额。激烈的竞争、技术的快速进步、政府政策的频繁变化以及环境法规是阻碍市场增长的关键因素。供应商基于成本、产品质量、可靠性和政府法规展开竞争。供应商必须提供具有成本效益的高质量产品才能在竞争激烈的市场中生存并取得成功。

市场的主要参与者包括 StreamYard、Kaltura、BrightCove、IBM、Dacast、Twitch Interactive, Inc.、Vimeo, Inc、ByteDance、StreamShark、Flux Broadcast、Wowsome XR LTD、Wowsome XR LTD、Kick、GOOGLE LLC、Microsoft Corporation、AFREECTV CO., LTD. (Soop)、STREAMING.HR、Event Streaming、Huya Inc. 等。由于竞争加剧、收购、兼并以及其他旨在提高运营效率的战略性市场发展和决策,直播市场呈现整合态势。

直播市场 strong的主要公司 strong包括

ul
  • StreamYard
  • Kaltura
  • BrightCove
  • Dacast
  • Twitch Interactive, Inc.
  • Vimeo,公司
  • 字节跳动
  • StreamShark
  • 通量广播
  • Wowsome XR 有限公司
  • 令人惊叹的 XR LT
  • Kick,GOOGLE LLC
  • AFREECATV有限公司(Soop)
  • 人力资源
  • 活动直播
  • 虎牙直播
h2 直播市场 strong行业发展 p2023年1月:IBM 推出 IBM Video Streaming 软件,旨在提升全球业务协作。IBM Video Streaming 是一项企业级直播技术,可为企业提供安全性高、功能强大的解决方案。这款移动视频流软件支持多个直播视频。由 AI 支持的隐藏式字幕是该应用程序引入的一项专为企业打造的功能。管理员可以轻松修改此隐藏字幕,以获得更清晰的上下文或更清晰的理解。

2019 年 5 月:

直播市场 strong细分

    • 直播 按组件类型展望

      • 平台
      • 服务
    • 直播 按应用领域展望

      • 媒体和娱乐
      • 电子竞技
      • 活动
      • 零售
      • 政府
      • 其他
    • 直播 区域展望

    • 北美 ul
    • 美国
    • 加拿大
    • 墨西哥
  • 欧洲 ul
  • 德国
  • 法国
  • 英国
  • 其他地区欧洲
  • 亚太地区 ul
  • 中国
  • 日本
  • 印度
  • 亚太其他地区
  • 中东和非洲 ul
  • 阿联酋
  • 沙特阿拉伯
  • 南非
  • 中东和非洲其他地区
  • 南美洲 ul
  • 巴西
  • 阿根廷
  • 南美洲其他地区

市场亮点

作者
Author
Author Profile
Aarti Dhapte LinkedIn
AVP - Research
A consulting professional focused on helping businesses navigate complex markets through structured research and strategic insights. I partner with clients to solve high-impact business problems across market entry strategy, competitive intelligence, and opportunity assessment. Over the course of my experience, I have led and contributed to 100+ market research and consulting engagements, delivering insights across multiple industries and geographies, and supporting strategic decisions linked to $500M+ market opportunities. My core expertise lies in building robust market sizing, forecasting, and commercial models (top-down and bottom-up), alongside deep-dive competitive and industry analysis. I have played a key role in shaping go-to-market strategies, investment cases, and growth roadmaps, enabling clients to make confident, data-backed decisions in dynamic markets.
发表评论

FAQs

What is the current valuation of the Live Streaming Market as of 2024?

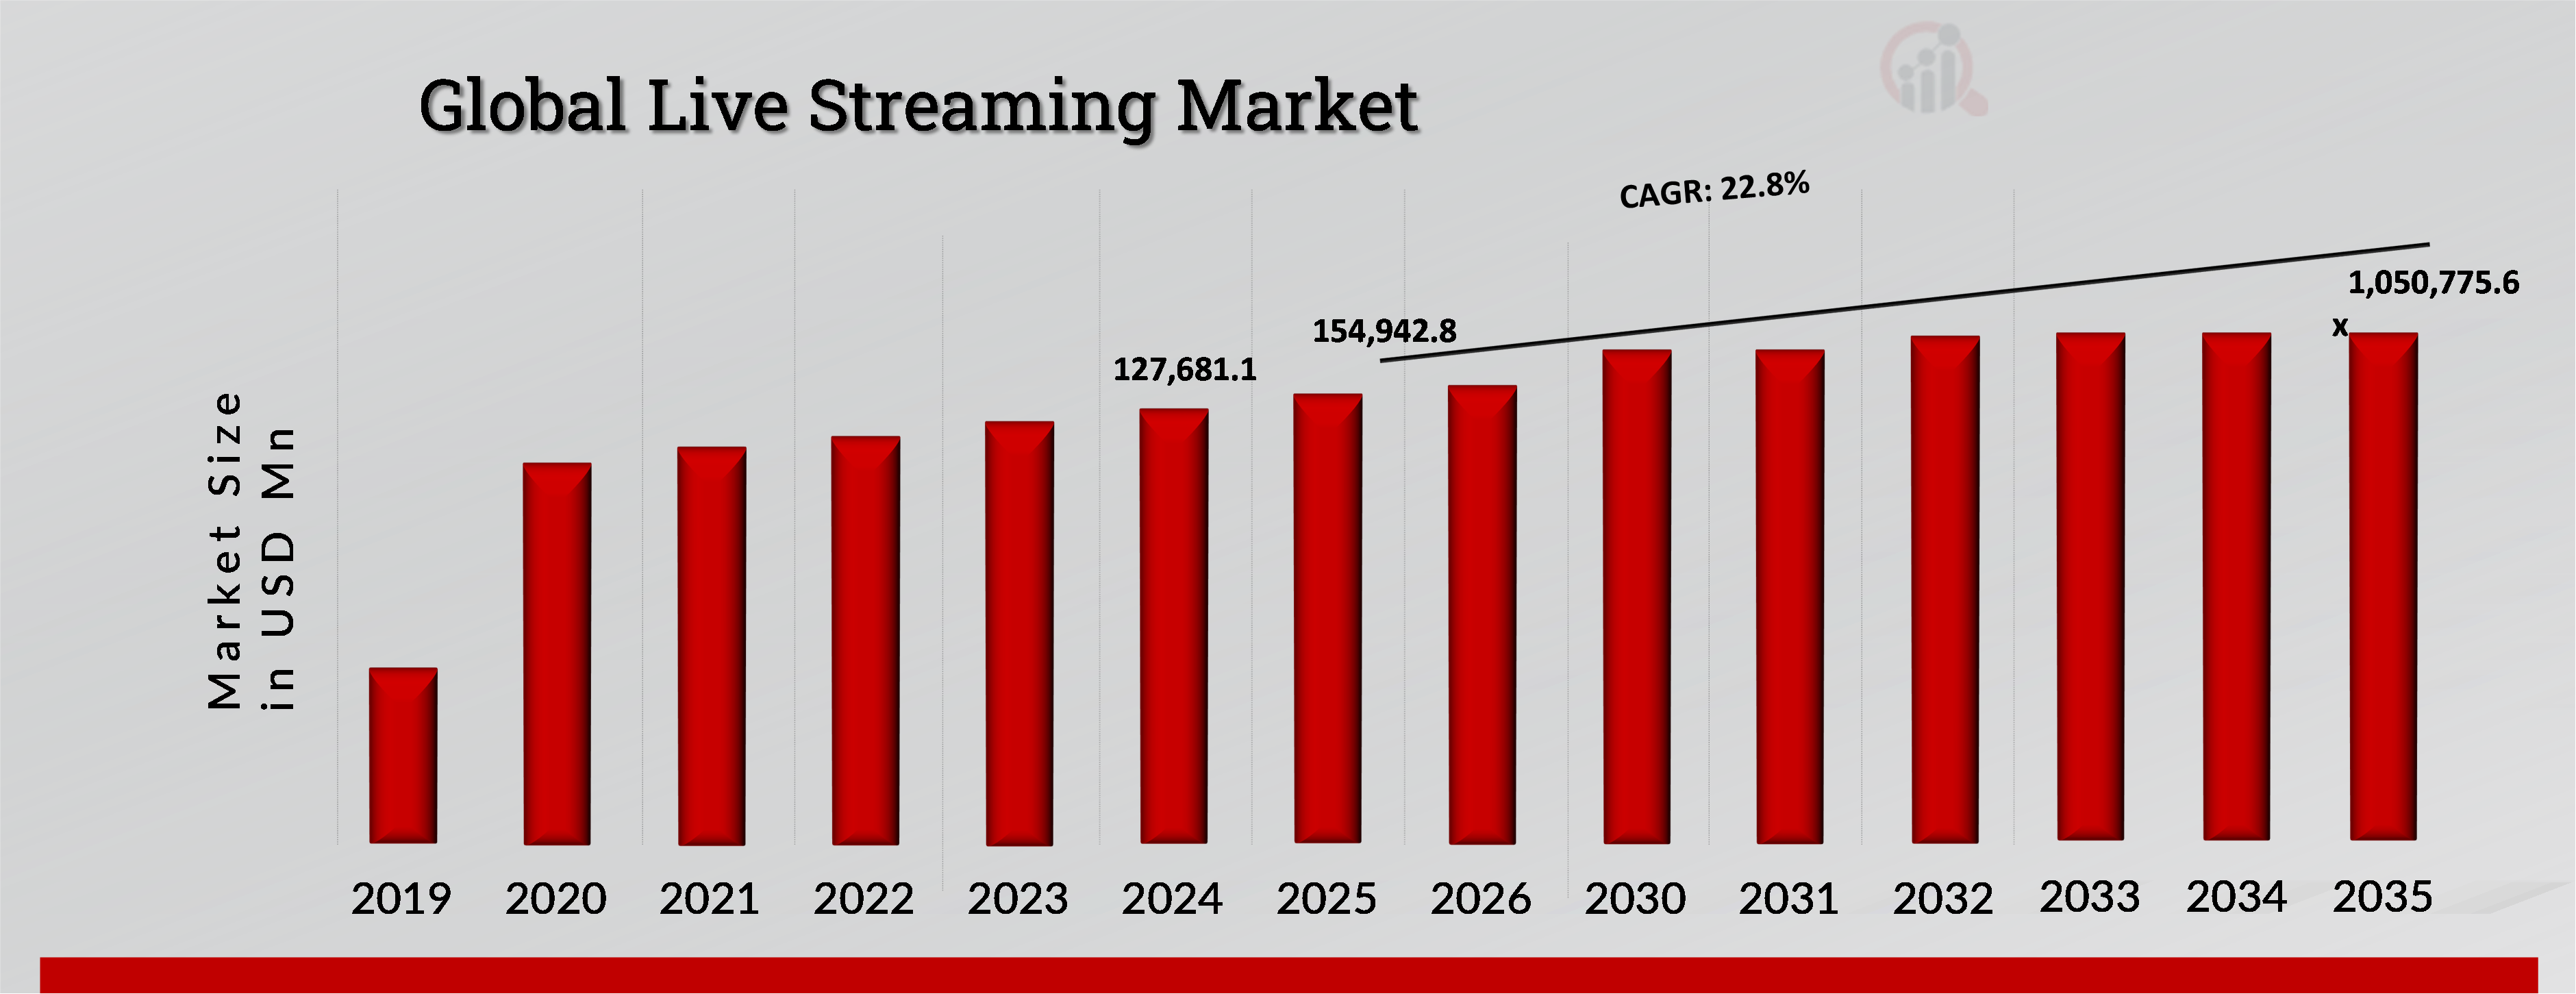
The Live Streaming Market was valued at 90.01 USD Million in 2024.

What is the projected market valuation for the Live Streaming Market in 2035?

The market is projected to reach a valuation of 1104.72 USD Million by 2035.

What is the expected CAGR for the Live Streaming Market during the forecast period 2025 - 2035?

The expected CAGR for the Live Streaming Market during 2025 - 2035 is 25.6%.

Which companies are considered key players in the Live Streaming Market?

Key players in the market include Twitch, YouTube, Facebook, DLive, Niconico, Bilibili, Trovo, Vimeo, and Periscope.

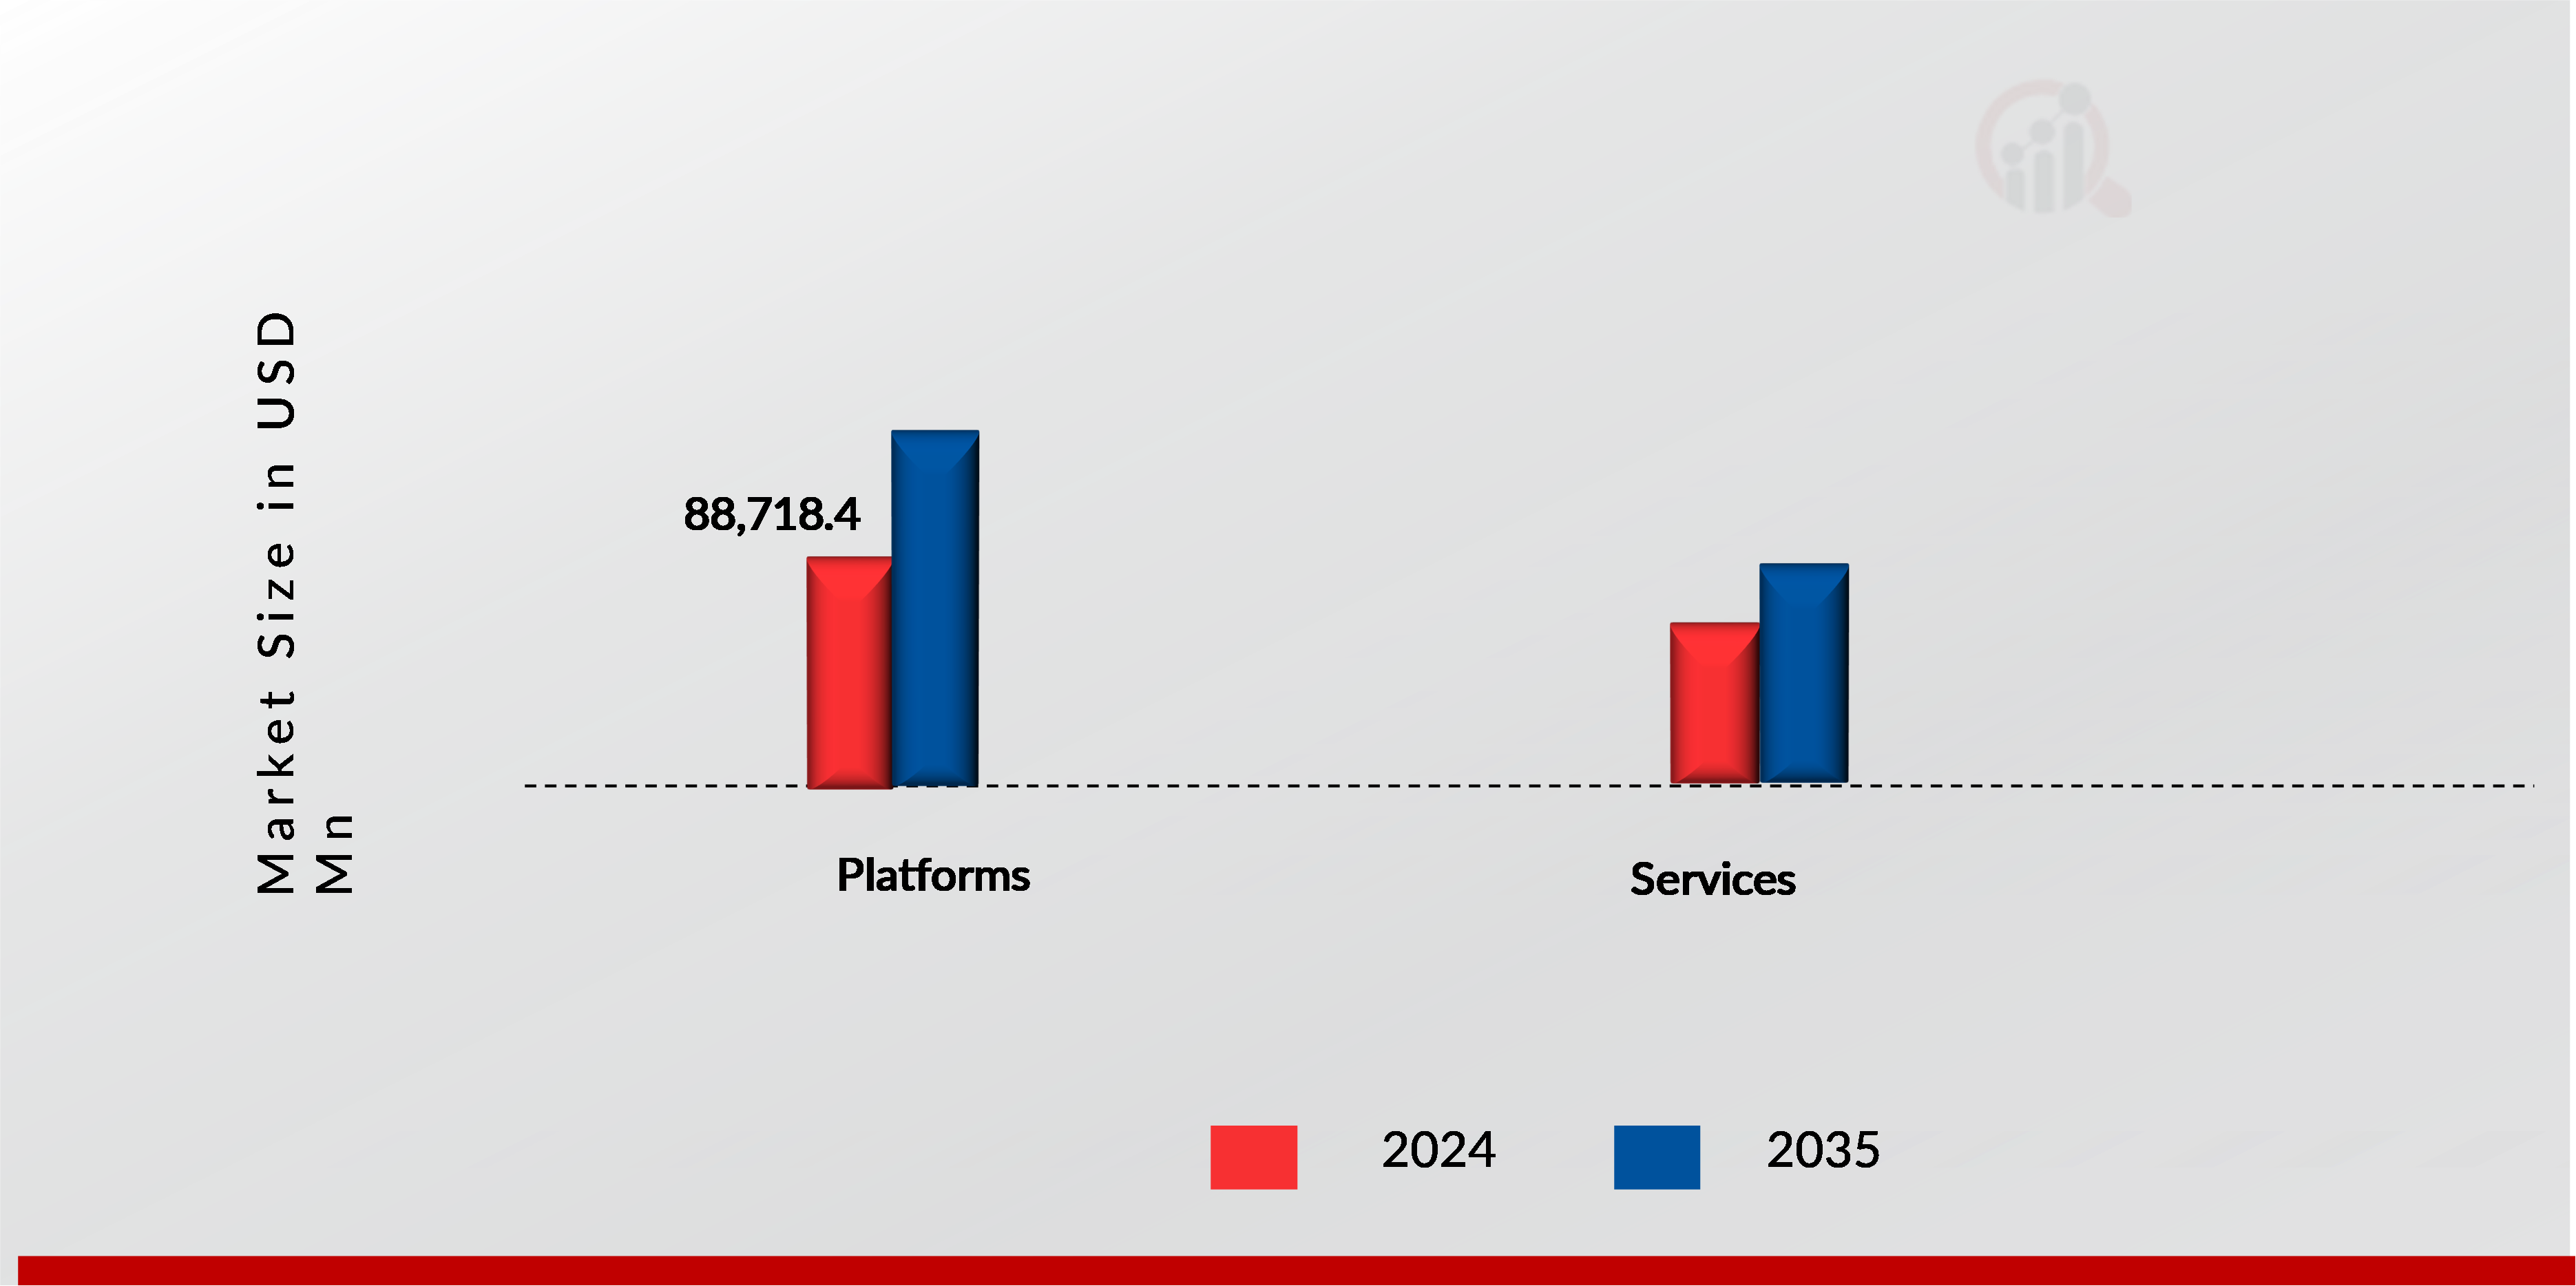
What are the main components of the Live Streaming Market?

The main components of the market include platforms, valued at 30.0 to 400.0 USD Million, and services, valued at 60.01 to 704.72 USD Million.

How does the Media and Entertainment segment perform within the Live Streaming Market?

The Media and Entertainment segment is valued between 30.0 and 400.0 USD Million.

What is the valuation range for the Esports application area in the Live Streaming Market?

The Esports application area is valued between 15.0 and 200.0 USD Million.

What is the projected valuation for the Events segment in the Live Streaming Market?

The Events segment is projected to be valued between 20.0 and 250.0 USD Million.

How does the Retail application area contribute to the Live Streaming Market?

The Retail application area contributes a valuation range of 10.0 to 100.0 USD Million.

What is the expected growth trajectory for the Live Streaming Market in the coming years?

The Live Streaming Market is expected to experience substantial growth, reaching over 1104.72 USD Million by 2035.

Research Approach

Secondary Research

The secondary research process involved comprehensive analysis of regulatory filings, telecommunications authority databases, digital media consumption reports, and broadcasting industry statistics. Key sources included the US Federal Communications Commission (FCC), National Telecommunications and Information Administration (NTIA), UK Office of Communications (Ofcom), European Broadcasting Union (EBU), European Audiovisual Observatory, Canadian Radio-television and Telecommunications Commission (CRTC), Australian Communications and Media Authority (ACMA), Ministry of Industry and Information Technology (China), Ministry of Internal Affairs and Communications (Japan), International Telecommunication Union (ITU), World Intellectual Property Organization (WIPO), Interactive Advertising Bureau (IAB), Streaming Video Technology Alliance (SVTA), Fédération Internationale de l'Automobile (FIA – for esports governance), International Esports Federation (IESF), Asia Video Industry Association (AVIA), National Association of Broadcasters (NAB), OECD Digital Economy Outlook, World Bank Digital Development Reports, and UNESCO Institute for Statistics. These sources were used to collect broadband penetration data, platform licensing agreements, content monetization regulations, 5G infrastructure deployment rates, esports viewership statistics, and cross-border data flow policies governing live streaming architectures.

Primary Research

During the primary research process, qualitative and quantitative insights regarding platform architecture, content monetization strategies, and user acquisition dynamics were obtained through interviews with supply-side and demand-side stakeholders. The supply-side sources consist of CEOs, Chief Product Officers (CPOs), VP of Engineering, Head of Content Partnerships, and Monetization Directors from live streaming platforms, content delivery network (CDN) providers, cloud infrastructure vendors, and interactive video technology developers. Demand-side sources included Chief Marketing Officers from retail brands, esports tournament organizers, broadcast media procurement chiefs, government digital communication officers, and influencers/content creators with followings of 500K or more on major platforms. The primary research validated the segmentation between platform infrastructure and service layers, confirmed the timelines for the adoption of real-time engagement (RTE) technology, and collected insights on the advertising versus subscription revenue mix, content moderation compliance costs, and latency optimization investments.

Primary Respondent Breakdown:

By Designation: C-Suite/Executive Leadership (40%), VP/Director Level (32%), Product/Technical Managers (28%)

By Region: North America (40%), Europe (30%), Asia-Pacific (25%), Middle East & Africa (3%), South America (2%)

Note:Tier1=>USD50Bmarketcap;Tier2=USD5B−50B;Tier3=

Market Size Estimation

Global market valuation was derived through revenue mapping and user engagement analysis across content delivery infrastructure. The methodology included:

Identification of 50+ key platform providers andCDN operators across North America, Europe, Asia-Pacific, and Latin America

Product mapping across live streaming platforms (Twitch, YouTube Live, Bilibili), white-label streaming services, and post-production/live editing tools

Analysis of advertising-supported (AVOD), subscription-based (SVOD), and transaction-based (TVOD) revenue streams specific to live content portfolios

Coverage of platforms representing 75-80% of global market share in 2024

Extrapolation using bottom-up (monthly active users × average revenue per user by content vertical) and top-down (platform reported revenue validation) approaches to derive segment-specific valuations for gaming, entertainment, retail commerce, and government broadcasting applications

下载免费样本

请填写以下表格以获取本报告的免费样本

Compare Licence

×
Features License Type
Single User Multiuser License Enterprise User
Price $4,950 $5,950 $7,250
Maximum User Access Limit 1 User Upto 10 Users Unrestricted Access Throughout the Organization
Free Customization
Direct Access to Analyst
Deliverable Format
Platform Access
Discount on Next Purchase 10% 15% 15%
Printable Versions
%>