Request Free Sample ×

Kindly complete the form below to receive a free sample of this Report

* Please use a valid business email

Leading companies partner with us for data-driven Insights

clients tt-cursor
Hero Background

Infrastructure as a Service Market

ID: MRFR/ICT/4454-HCR
100 Pages
Nirmit Biswas
April 2026

基础设施即服务市场研究报告:按部署模型(公共云、私有云、混合云)、按服务类型(计算、存储、网络、灾难恢复)、按最终用户(IT 和电信、BFSI、医疗保健、零售、政府)、按应用程序(业务连续性、数据备份、测试和开发、大数据分析)和按区域(北美、欧洲、南美、亚太地区、中东和非洲)- 预测到 2035 年。

分享
Download PDF ×

We do not share your information with anyone. However, we may send you emails based on your report interest from time to time. You may contact us at any time to opt-out.

Infrastructure as a Service Market Infographic
Purchase Options

全球基础设施即服务市场概览

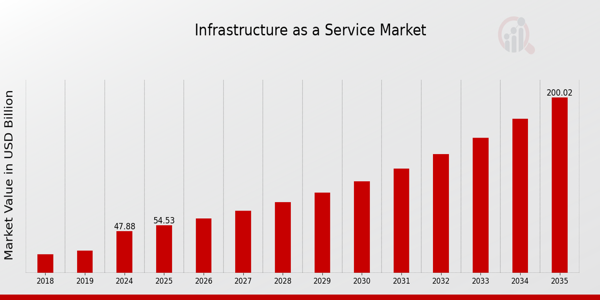
根据 MRFR 分析,2023 年基础设施即服务市场规模估计为 420.5 亿美元。预计到 2035 年,基础设施即服务市场规模将从 2024 年的 478.8 亿美元增长到 2000 亿美元。预测期内(2025 - 2035 年),基础设施即服务市场复合年增长率 (CAGR) 预计约为 13.88%。

重点介绍基础设施即服务市场关键趋势

对可扩展且高效的 IT 基础设施日益增长的需求,正在推动全球基础设施即服务行业的显著发展。企业在降低运营成本的同时提升性能,对云服务的需求日益增长,这是推动市场发展的主要因素之一。

IaaS 在企业中越来越受欢迎,因为它允许企业根据不断变化的业务需求调整资源,从而促进数字化转型。此外,由于远程办公和国际企业运营的增长,对可靠且安全的云基础设施的需求也在增长。

技术供应商现在有很多机会创新和改进其提供的服务,尤其是在自动化、安全和混合云解决方案等领域。企业希望通过利用多云方法优化其云基础设施,并避免供应商锁定。

随着企业越来越意识到其对环境的影响,最近的发展也表明,IaaS 解决方案更加重视可持续性和能源效率。数据中心运营商已通过采用绿色实践和使用可再生能源来应对这一挑战。

此外,通过将人工智能和机器学习融入 IaaS 产品,资源管理和运营效率也得到了提升。总而言之,由于新技术、企业流程的变化以及对可持续性的日益关注,全球基础设施即服务行业正在迅速变化,这为扩张和投资营造了令人兴奋的氛围。

全球基础设施即服务市场概览

来源:初步研究、二次研究、MRFR 数据库和分析师评论

基础设施即服务市场驱动因素

数字化转型需求增加

随着世界各地的企业接受数字化转型,对基础设施即服务市场解决方案的需求正在显着增长。全球信息技术协会 (GIA) 的一项调查显示,70% 的组织正处于数字化转型的某个阶段,其中 40% 的组织计划增加 IT 支出以支持这些举措。

这一趋势凸显了基础设施即服务 (IaaS) 在提供可扩展资源方面的重要作用,而这些资源对于有效的数字化运营至关重要。亚马逊网络服务和微软 Azure 等大公司在提供强大的云解决方案方面处于领先地位,这些解决方案促进了这一转型,巩固了它们在推动市场增长方面的影响力。

此外,联合国的研究表明,对云计算的投资可将生产率提高高达 30%,因此,企业在利用技术进步的同时,也不得不采用基础设施即服务产品。

远程办公日益普及

远程办公的兴起从根本上重塑了组织结构,并促进了基础设施即服务市场的扩张。根据国际劳工组织的一份报告,在最近的全球疫情期间,全球远程工作者的数量激增了 30%,这凸显了对灵活且可扩展的基础设施解决方案的需求。

谷歌和 IBM 等组织已成功将许多员工转为远程工作,推动了对基础设施即服务 (IaaS) 的需求,以确保无缝连接和协作。这种转变需要部署云资源,云资源提供可靠且易于访问的 IT 环境,有利于远程运营,从而推动企业采用基础设施即服务 (IaaS) 解决方案。

成本效益和降低资本支出

与传统 IT 基础设施相比,IaaS 为企业提供的显著成本优势推动了 IaaS 市场的发展。

根据国际电信联盟的研究,采用 IaaS 的企业可以通过消除对物理硬件的需求并减少维护费用,将总成本降低约 25-30%。IBM 和 Oracle 等公司已成功展示了如何过渡到基础设施即服务可以优化运营,同时最大限度地降低管理成本。

这种财务激励措施对需要高效资源管理的中小企业尤其有吸引力。随着各组织在后疫情时代继续评估其支出,基础设施即服务解决方案的经济效益将推动其进一步采用和增长。

日益重视数据安全和合规性

随着全球网络威胁的增加,人们越来越关注数据安全和合规性法规,这促使各组织转向基础设施即服务市场寻求安全的解决方案。网络安全和基础设施安全局表示,超过 60% 的企业在去年经历过至少一次重大网络安全事件。

Google Cloud 和 Microsoft Azure 等公司已经开发出符合 ISO 27001 和 GDPR 等国际标准的强大安全框架,这些框架不仅可以保护敏感数据,还可以增强客户信任。随着组织优先保护其信息和遵守法规,对安全的基础设施即服务平台的需求将继续增长,从而进一步催化市场扩张。

基础设施即服务市场细分洞察

基础设施即服务市场部署模型洞察

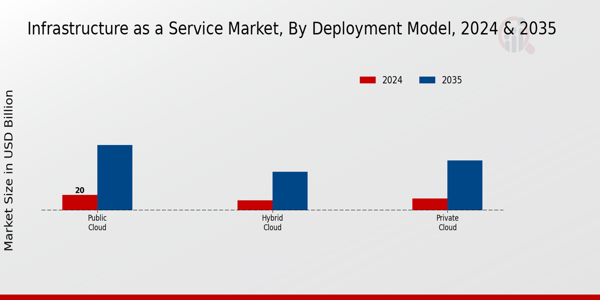
基础设施即服务市场中的部署模型为这个不断发展的行业的整体结构和创收做出了重大贡献。部署模型在企业如何利用云解决方案优化运营效率和技术能力方面发挥着至关重要的作用。

2024年,公有云市场规模达200亿美元,预计到2035年将增至850亿美元,使其成为市场中的佼佼者。该模式的成功之处在于它能够为各类企业提供可扩展且经济高效的资源,使其无需大量资本投入即可访问先进的基础设施。

此外,私有云市场规模达150亿美元,预计到2035年将增长至650亿美元,主要面向注重安全性和合规性的企业。这种部署模型提供了一个量身定制的环境,这对于医疗保健和金融等数据敏感性至关重要的行业尤其重要。

混合云细分市场的价值在 2024 年为 128.8 亿美元,预计到 2035 年将达到 500 亿美元,它融合了公共云和私有云解决方案,为企业提供了平衡工作负载的灵活性。这转化为一种强劲的市场趋势,即在优化性能的同时确保满足严格的合规性和安全性基准,凸显了这种模型在日益注重集成解决方案的市场中的重要性。

随着企业努力提高运营敏捷性和可扩展性,了解这些部署模型中的动态对于在基础设施即服务市场中运营的利益相关者至关重要。市场增长受到技术进步、数字化转型需求的不断增长以及各个行业云采用率的提高的驱动,凸显了这些部署策略在当今商业格局中的重要性。

基础设施即服务市场部署模型洞察

来源:一手资料研究、二手资料研究、MRFR 数据库和分析师评论

基础设施即服务市场服务类型洞察

服务类型中的市场细分包括计算、存储、网络和灾难恢复等关键要素,每个要素都对整体格局产生重大影响。计算服务通过为企业提供可扩展的处理能力发挥着至关重要的作用,而存储解决方案对于高效管理和存储海量数据至关重要。

网络服务增强了连接性和数据传输,这在当今依赖云的环境中至关重要。此外,灾难恢复服务的需求日益增长,以确保业务连续性并在面临意外挑战时保护数据完整性。

随着企业持续采用云计算,基础设施即服务市场数据呈现出上升趋势,这主要得益于对运营效率和成本效益的需求。市场有望受益于技术进步和对数字解决方案日益增长的依赖,在持续的挑战中提供无数的创新和增长机会。

基础设施即服务市场最终用户洞察

IT 和电信行业是主要贡献者,利用云服务来提高运营效率和服务交付。同时,BFSI 部门强调对安全可靠的数据管理和交易处理基础设施的需求。

在医疗保健领域,组织越来越依赖基础设施即服务来确保遵守法规,同时通过数据分析改善患者护理。零售业利用这些服务来优化供应链运营,并通过个性化体验提升客户参与度。

最后,政府机构正在采用基础设施即服务 (IaaS) 来改善服务交付并降低成本,以配合数字化转型计划。基础设施即服务市场的整体收入反映了这些关键行业采用先进技术以及对可扩展基础设施解决方案的需求不断增长。这些行业专注于提高运营敏捷性并降低资本支出,因此在未来几年将占据市场主导地位。

基础设施即服务市场应用洞察

该细分市场涵盖多个方面,尤其是业务连续性和数据备份,它们在确保全球企业的运营弹性和数据完整性方面发挥着关键作用。对云服务的日益依赖推动了对高效测试和开发环境的需求,使企业能够在无需巨额基础设施投资的情况下快速创新。

此外,随着企业利用海量数据获取洞察并改进决策流程,大数据分析已成为市场增长的重要驱动力。数字化转型趋势和对成本效率的日益关注是推动基础设施即服务市场发展的关键因素。

通过利用这些应用程序,企业不仅可以提升运营能力,还可以抓住增长和竞争优势的机会。随着企业不断应对现代技术需求的复杂性,对全面的基础设施即服务解决方案的需求预计将显著增强。

基础设施即服务市场区域洞察

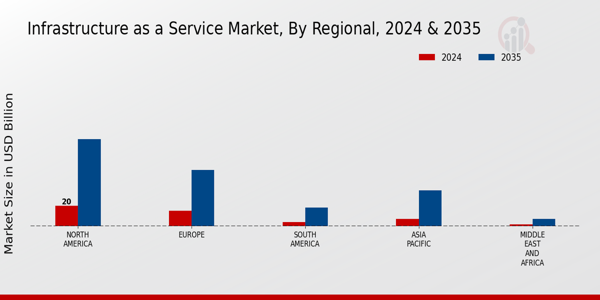
基础设施即服务市场收入呈现大幅增长。在本次区域分析中,北美占据主导地位,2024 年估值为 200 亿美元,预计到 2035 年将激增至 850 亿美元,这得益于先进技术的采用和强大的云基础设施。

欧洲的市场估值在 2024 年为 150 亿美元,到 2035 年将扩大到 550 亿美元,这反映了对数字化转型计划和基于云的解决方案的大量投资。在南美,该市场引起了人们的兴趣,2024 年的价值为 40 亿美元,预计到 2035 年将达到 180 亿美元,表明随着云计算意识的不断提高,对 IaaS 的需求不断增长。与此同时,亚太地区 2024 年的价值为 70 亿美元,随着企业越来越多地采用 IaaS 来提高运营效率,预计到 2035 年将达到 350 亿美元。

最后,中东和非洲市场 2024 年的规模为 18.8 亿美元,预计到 2035 年将增长到 70 亿美元,因为区域参与者认识到云解决方案推动创新的潜力。总体而言,基础设施即服务市场细分表明这些地区的增长动力和市场准备程度各不相同,每个地区都解决了不断发展的数字格局中的特定技术需求和挑战。

基础设施即服务市场区域洞察

来源:初步研究、二次研究、MRFR 数据库和分析师评论

基础设施即服务市场主要参与者和竞争洞察

基础设施即服务市场是一个快速发展的行业,其特点是对云解决方案、灵活性和可扩展性的需求不断增长。这个市场囊括了各种各样的公司,它们通过互联网提供虚拟化计算资源,使组织能够利用 IT 基础设施,而无需承担管理物理硬件的负担。

激烈的竞争格局受到技术进步、战略合作伙伴关系和不断变化的客户需求的驱动,这些因素促使公司不断创新。该领域的主要参与者正在利用人工智能、机器学习和大数据分析等先进技术来增强其服务产品。

市场参与者还致力于建立全球影响力,以开拓新兴市场,同时确保遵守区域法规和标准。随着来自不同行业的组织寻求经济高效的解决方案,该市场持续扩张,凸显了塑造其未来的竞争洞察力。

华为是基础设施即服务 (IaaS) 市场的杰出参与者,在提供先进的云计算解决方案和服务方面享有盛誉。该公司通过其全面的产品组合(包括云服务、DevOps 和分布式计算架构)展示了强大的市场影响力。

华为的优势在于其对研发的投入,使其能够提供量身定制的创新解决方案,满足全球客户的需求。他们专注于增强数据安全性和改善用户体验,这使其成为这一竞争环境中值得信赖的提供商。

此外,华为与全球多家科技公司的战略合作和伙伴关系扩大了其影响力和市场范围,使其在不断发展的云环境中保持竞争力。Oracle 还在基础设施即服务市场中发挥着重要作用,提供涵盖基础设施、平台和软件即服务解决方案的一套云服务。

该公司的优势包括其全面的数据库产品、企业资源规划解决方案以及创新的 Oracle 云基础设施,可确保高性能、安全性和可扩展性。 Oracle 通过并购实现了战略举措,增强了自身能力并扩展了服务组合,以满足全球企业的多样化需求。

该公司始终专注于提供满足各个行业需求的集成解决方案,从而能够有效地为跨国客户提供服务。Oracle 致力于持续改进,并能够适应不断变化的市场条件,这确保了它在全球 IaaS 领域始终是一个强大的竞争对手,使企业能够利用云技术提高运营效率和敏捷性。

基础设施即服务市场的主要公司包括

  • 华为
  • 甲骨文
  • 微软
  • IBM
  • 谷歌
  • DigitalOcean
  • Linode
  • 亚马逊网络服务
  • Equinix
  • VMware
  • 阿里巴巴云
  • Red Hat
  • Salesforce
  • Rackspace
  • NTT Communications

基础设施即服务市场发展

随着 2025 年 1 月第 35 个全球区域的开放,AWS 现在可在亚太地区(泰国)区域支持最高机密级别的政府级工作负载。 AWS 于 2025 年 6 月发布了 Amazon Elastic VMware Service (EVS) 的公开预览版,该服务允许 VMware Cloud 工作负载在 AWS 环境中原生运行。

2025 年 3 月,IBM Cloud 宣布合作,将 AMD Instinct MI300X GPU 与其 Watsonx AI 平台连接起来,并推出了 Storage Ceph as a Service,使本地客户端能够通过云式运营模式使用基于 Ceph 的存储。

Google Cloud 扩展了 Workforce Identity Federation(包括 Microsoft Entra ID 单点登录),协调了其 Cloud Functions 和 Cloud Run 平台,并在 2024 年 12 月在 BigQuery 中引入了用于近乎实时分析的持续查询功能。

Microsoft Azure 于 2025 年 6 月发布了重要的 IaaS 改进,例如改进了其云采用框架中用于改进 AI 虚拟机安装的指南,以及复杂的 AI 工作负载管理工具。 Oracle 云基础设施于 2023 年 11 月更新了用户界面 (UI),整合了 IaaS、PaaS 和 SaaS 导航功能,从而简化了企业用户的基础设施管理。

基础设施即服务市场细分洞察

基础设施即服务市场部署模式展望

  • 公有云
  • 私有云
  • 混合云

基础设施即服务市场服务类型展望

  • 计算
  • 存储
  • 网络
  • 灾难恢复

基础设施即服务市场最终用户展望

  • IT 和电信
  • BFSI
  • 医疗保健
  • 零售
  • 政府

基础设施即服务市场应用展望

  • 业务连续性
  • 数据备份
  • 测试与开发
  • 大数据分析

基础设施即服务市场区域展望

  • 北美
  • 欧洲
  • 南美
  • 亚太地区
  • 中东和非洲

市场亮点

作者
Author
Author Profile
Nirmit Biswas LinkedIn
Senior Research Analyst
With 5+ years of expertise in Market Intelligence and Strategic Research, Nirmit Biswas specializes in ICT, Semiconductors, and BFSI. Backed by an MBA in Financial Services and a Computer Science foundation, Nirmit blends technical depth with business acumen. He has successfully led 100+ projects for global enterprises and startups, including Amazon, Cisco, L&T and Huawei, delivering market estimations, competitive benchmarking, and GTM strategies. His focus lies in transforming complex data into clear, actionable insights that drive growth, innovation, and investment decisions. Recognized for bridging engineering innovation with executive strategy, Nirmit helps businesses navigate dynamic markets with confidence.
Co-Author
Co-Author Profile
Aarti Dhapte LinkedIn
AVP - Research
A consulting professional focused on helping businesses navigate complex markets through structured research and strategic insights. I partner with clients to solve high-impact business problems across market entry strategy, competitive intelligence, and opportunity assessment. Over the course of my experience, I have led and contributed to 100+ market research and consulting engagements, delivering insights across multiple industries and geographies, and supporting strategic decisions linked to $500M+ market opportunities. My core expertise lies in building robust market sizing, forecasting, and commercial models (top-down and bottom-up), alongside deep-dive competitive and industry analysis. I have played a key role in shaping go-to-market strategies, investment cases, and growth roadmaps, enabling clients to make confident, data-backed decisions in dynamic markets.
发表评论

FAQs

What is the current valuation of the Infrastructure-as-a-Service market in 2025?

The Infrastructure-as-a-Service market valuation is approximately 47.88 USD Billion in 2024.

What is the projected market size for Infrastructure-as-a-Service by 2035?

The market is expected to reach approximately 200.02 USD Billion by 2035.

What is the expected CAGR for the Infrastructure-as-a-Service market during the forecast period 2025 - 2035?

The expected CAGR for the Infrastructure-as-a-Service market is 13.88% during the forecast period 2025 - 2035.

Which deployment model segment shows the highest growth potential in the Infrastructure-as-a-Service market?

The Public Cloud segment is projected to grow from 20.0 USD Billion to 80.0 USD Billion by 2035.

How does the performance of the Compute service type compare to others in the Infrastructure-as-a-Service market?

The Compute service type is anticipated to increase from 20.0 USD Billion to 85.0 USD Billion by 2035, indicating strong growth.

Which end-user segment is expected to contribute the most to the Infrastructure-as-a-Service market by 2035?

The IT and Telecommunications segment is likely to grow from 15.0 USD Billion to 65.0 USD Billion by 2035.

What applications are driving growth in the Infrastructure-as-a-Service market?

Big Data Analytics is projected to expand from 19.7 USD Billion to 82.02 USD Billion by 2035, suggesting significant demand.

Who are the key players in the Infrastructure-as-a-Service market?

Key players include Amazon Web Services, Microsoft Azure, Google Cloud, IBM Cloud, Oracle Cloud, Alibaba Cloud, DigitalOcean, Linode, and Vultr.

What is the expected growth of the Disaster Recovery service type in the Infrastructure-as-a-Service market?

The Disaster Recovery service type is projected to grow from 5.0 USD Billion to 25.0 USD Billion by 2035.

How does the growth of the Hybrid Cloud segment compare to the Private Cloud segment?

The Hybrid Cloud segment is expected to grow from 12.88 USD Billion to 60.02 USD Billion, while the Private Cloud segment is projected to increase from 15.0 USD Billion to 60.0 USD Billion by 2035.

Research Approach

Secondary Research

The secondary research process involved comprehensive analysis of regulatory databases, peer-reviewed technology journals, industry publications, and authoritative IT organizations. Key sources included the US National Institute of Standards and Technology (NIST), European Union Agency for Cybersecurity (ENISA), International Organization for Standardization (ISO/IEC JTC 1/SC 38 - Cloud Computing and Distributed Platforms), Cloud Security Alliance (CSA), IEEE Computer Society, Association for Computing Machinery (ACM Digital Library), US General Services Administration (GSA) FedRAMP, European Data Protection Board (EDPB), International Telecommunication Union (ITU), World Economic Forum (WEF) Digital Economy Reports, Organisation for Economic Co-operation and Development (OECD) Digital Economy Outlook, and national digital transformation strategies from key markets.

Cloud adoption figures, compliance framework data, cybersecurity research, enterprise migration patterns, and competitive landscape analysis for public, private, and hybrid cloud deployments, as well as compute, storage, networking, and disaster recovery service types, were gathered from these sources.

Primary Research

In order to gather both qualitative and quantitative insights, supply-side and demand-side stakeholders were interviewed during the primary research process. CEOs, CTOs, VPs of Cloud Infrastructure, heads of Product Strategy, and regional directors from tier-2 infrastructure suppliers, hyperscale cloud providers, and managed service providers were examples of supply-side sources. Chief information officers (CIOs), chief technology officers (CTOs), IT directors, cloud architects, and procurement heads from Fortune 500 companies, mid-market businesses, governmental organizations, healthcare systems, financial institutions, and retail conglomerates were examples of demand-side sources. Primary research verified service roadmap dates, validated market segmentation across deployment modes (public, private, and hybrid), and collected information on enterprise adoption trends, pricing models (reserved instances, spot pricing, pay-as-you-go), and multi-cloud governance dynamics.

Primary Respondent Breakdown:

By Designation: C-level Primaries (32%), Director Level (35%), Others (33%)

By Region: North America (38%), Europe (25%), Asia-Pacific (28%), Middle East & Africa (5%), South America (4%)

Market Size Estimation

Workload deployment analysis and revenue mapping were used to determine the global market valuation. The methodology comprised:

Finding more than fifty major infrastructure suppliers in North America, Europe, Asia-Pacific, Latin America, the Middle East, and Africa

Service mapping across networking (CDN, load balancing, VPN), storage (object, block, file), computing (virtual machines, containers, serverless), and disaster recovery categories

Analysis of IaaS portfolio-specific actual and estimated annual revenues (where feasible, eliminating SaaS and PaaS revenues)

Coverage of suppliers accounting for 75–80% of the worldwide market in 2024

Extrapolation of segment-specific valuations across deployment models and end-user industries (IT & Telecommunications, BFSI, Healthcare, Retail, Government) using top-down (provider revenue validation triangulated with CapEx spending on data center infrastructure) and bottom-up (enterprise workload volume × average spend per workload by vertical and region) approaches

下载免费样本

请填写以下表格以获取本报告的免费样本

Compare Licence

×
Features License Type
Single User Multiuser License Enterprise User
Price $4,950 $5,950 $7,250
Maximum User Access Limit 1 User Upto 10 Users Unrestricted Access Throughout the Organization
Free Customization
Direct Access to Analyst
Deliverable Format
Platform Access
Discount on Next Purchase 10% 15% 15%
Printable Versions
%>