Wireless Asset Management Market (2026 - 2035)

Wireless Asset Management Market Size, Share and Research Report By Component (Hardware, Software, and Services), By Connectivity Technology (RFID, Bluetooth Low Energy, Wi-Fi, Cellular IoT (LTE-M, NB-IoT, 5G), GPS / GNSS, and LPWAN (LoRa, Sigfox, etc.)), By Asset Category (Mobile Equipment, Fixed Equipment, Consumables, Returnable Transport Assets, and Other Asset Categories), By Industry Vertical (Manufacturing, Healthcare, Logistics and Transportation, Oil and Gas, Retail, and Other Industry Verticals), By Application (Physical Asset Monitoring, Inventory Control Automation, Predictive Maintenance Management, Loss Prevention, and Other Applications) – Industry Forecast Till 2035
ID: MRFR/ICT/30340-HCR 100 Pages Aarti Dhapte Last Updated: October 24, 2026
Wireless Asset Management Market
Market Size
Forecast Period2026-2035
CAGR (2026-2035)11.6%
2025 Market SizeUSD 20.20 Billion
2035 Market SizeUSD 60.55 Billion
Key Players
Zebra Technologies
Honeywell International
Avery Dennison
Impinj
Trimble
Siemens
Opportunities
  • Emerging-Market Logistics Corridors
  • Asset-as-a-Service and Data Monetization
  • Multi-Radio Hybrid Tags

Wireless Asset Management Market Summary

The Wireless Asset Management Market was valued at USD 20.20 Billion in 2025. It is projected to reach USD 22.55 Billion in 2026 and USD 60.55 Billion by 2035, a CAGR of 11.6% over 2026–2035. Two catalysts anchor that trajectory. The U.S. FDA's Drug Supply Chain Security Act moved to interoperable electronic package tracing in November 2024 , and Walmart expanded supplier-applied RFID tagging into new merchandise categories in 2024 [5]. Both turn asset visibility from an efficiency project into a condition of doing business.

Spreadsheets, barcode scans and periodic manual audits are giving way to IoT asset tracking solutions that stream location and condition data continuously. Passive RAIN RFID handles chokepoint identification, Bluetooth Low Energy covers indoor zones, and LTE-M and NB-IoT modules extend coverage to yards, railcars and remote sites. The economics are proven. Auburn University's RFID Lab has measured item-level inventory accuracy rising from roughly 65% to above 95% after RFID adoption [2]. On the supply side, the USD 52.7 billion CHIPS and Science Act is expanding domestic capacity for the chips inside readers and modules [15].

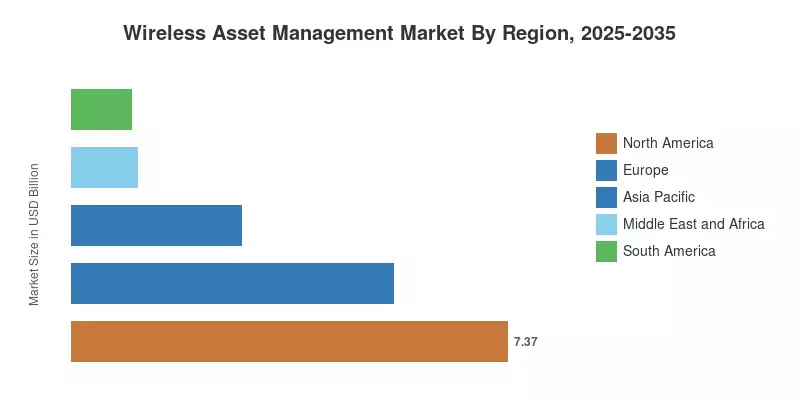
North America leads the Wireless Asset Management Market with a 36.5% share in 2025, built on healthcare compliance spending and retail RFID programs. Asia Pacific is the fastest-growing region at a 14.2% CAGR, driven by China's manufacturing base and India's logistics digitization push. Europe ranks second, where circular-packaging regulation is turning crates, pallets and roll cages into tracked assets. Over the next decade, competitive advantage will shift from tag hardware toward the analytics and services built on top of it.

Key Report Takeaways

• By Component

  • Hardware accounts for a 53.2% share of the Wireless Asset Management Market in 2025, led by RFID readers, beacons and cellular trackers
  • Services is the fastest-growing component at a 12.9% CAGR as enterprises outsource deployment and firmware management

• By Connectivity Technology

  • RFID holds a 33.8% share, anchored in retail item-level tagging and medical device traceability
  • Cellular IoT (LTE-M, NB-IoT, 5G) expands at a 14.1% CAGR on private-network momentum

• By Asset Category

  • Mobile Equipment leads with a 39.2% share, covering forklifts, hospital beds and field tools
  • Consumables grows at a 13.7% CAGR as reuse-tracking mandates tighten

• By Industry Vertical

  • Healthcare commands a 28.5% share of the Wireless Asset Management Market, propelled by UDI and sterilization compliance
  • Retail is the fastest-growing vertical at a 14.4% CAGR
  • Manufacturing generates USD 4.36 Billion in 2025 from work-in-progress and tooling visibility

• By Application

  • Physical Asset Monitoring accounts for a 37.5% share
  • Predictive Maintenance Management records the highest application CAGR at 14.8%

• By Region

  • North America dominates with a 36.5% share
  • Asia Pacific posts the fastest regional CAGR at 14.2%
  • Europe contributes USD 5.45 Billion in 2025

Market Size and Forecast (2021–2035)

Market Research Future sized the Wireless Asset Management Market through a bottom-up build of hardware shipments, software subscriptions and service contracts across every country in the regional scope. These estimates were validated top-down against vendor filings from Zebra Technologies, Impinj and Samsara [16][17][18] and against connection data from GSMA Intelligence [9]. Values for 2021–2024 reflect reported revenue, 2025 is the base year, and 2026–2035 values are forecast.
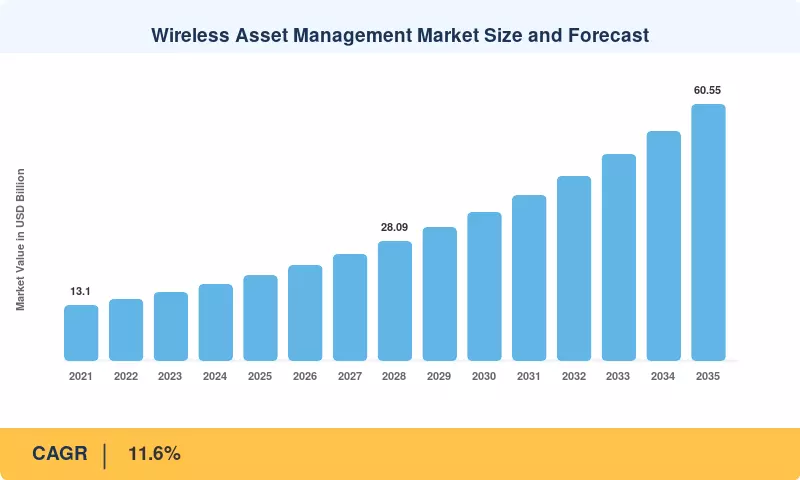
Wireless Asset Management Market Size and Forecast
Our Impact

Enabled $4.3B Revenue Impact for Fortune 500 and Leading Multinationals

Partnering with 2000+ Global Organizations Each Year

30K+ Citations by Top-Tier Firms in the Industry

Driver Impact Analysis

Driver ~% Impact on CAGR Geographic Relevance Impact Timeline
Item-level RFID mandates in retail ~+2.1% North America, Europe Short-term (≤2 yr)
Healthcare UDI and drug traceability compliance ~+1.8% North America, Europe Medium-term (2–4 yr)
Private 5G and cellular IoT expansion ~+1.7% North America, Europe, Asia Pacific Medium-term (2–4 yr)
Industry 4.0 and predictive maintenance adoption ~+1.5% Europe, Asia Pacific Long-term (≥4 yr)
Circular packaging and reuse regulation ~+1.2% Europe, spreading globally Long-term (≥4 yr)
Logistics digitization in emerging economies ~+1.0% Asia Pacific, Middle East and Africa Medium-term (2–4 yr)
Declining tag and module costs ~+1.3% Global Short-term (≤2 yr)

Item-Level RFID Mandates in Retail

Tagging expenses were moved upstream and EPC data flows were standardized by Walmart's 2024 mandate that suppliers tag at source across other categories, such as electronics and home products [5]. Because omnichannel fulfillment is impossible without it, retailers strive for the accuracy increases reported by Auburn University's RFID Lab, where inventory accuracy increased from roughly 65% to more than 95% [2]. Thousands of providers maintain encoding interoperability thanks to GS1's Gen2v3 standard [1]. This factor peaks in two years and contributes about 2.1 percentage points of directional growth.

Healthcare UDI and Drug Traceability Compliance

The DSCSA enforced interoperable electronic tracing of prescription medicine packages starting in November 2024, and the FDA's Unique Device Identification rule requires machine-readable identifiers on medical devices . In order to reduce rentals and losses, hospitals react by labeling sterilization trays, surgical kits, and infusion pumps before reusing that equipment. Once utilization becomes apparent, tracking programs typically aim to reduce mobile equipment fleets by 10% to 20%. When clinical workflows are reconstructed using location data, the effect compounds over a period of two to four years.

Private 5G and Cellular IoT Expansion

Enterprise spectrum access keeps widening. The FCC's CBRS framework opened 150 MHz in the 3.5 GHz band [10], and Germany's Bundesnetzagentur assigns 3.7–3.8 GHz licenses for local campus networks [24]. Another source reports cellular IoT connections above 3.5 billion globally in 2024 [8], while 3GPP RedCap and 5G-Advanced specifications lower module complexity [11]. Operators now bundle trackers, gateways and edge compute into single managed contracts, removing a major integration hurdle for buyers.

Industry 4.0 and Predictive Maintenance Adoption

Manufacturers attach vibration, temperature and runtime sensors to motors, compressors and tooling, feeding failure-prediction models. IoT Analytics counted roughly 16.6 billion connected IoT devices at the end of 2023, with industrial endpoints among the fastest-growing groups [22]. Plants that pair location with condition data report unplanned downtime reductions in the 20–30% range, a return that justifies retrofitting brownfield lines. Adoption is gradual, so the full contribution arrives after 2029.

Circular Packaging and Reuse Regulation

Regulation (EU) 2025/40 on packaging and packaging waste sets reuse targets reaching 40% for certain transport packaging by 2030 [6]. Proving reuse requires counting cycles, which means tagging pallets, crates and roll cages with durable RFID or BLE. Brand owners and pooling operators across Europe are retrofitting millions of returnable units, and comparable producer-responsibility rules are spreading to other jurisdictions. Impact builds steadily as compliance deadlines approach.

Logistics Digitization in Emerging Economies

India's National Logistics Policy aims to cut logistics costs from roughly 13–14% of GDP toward global benchmarks near 8% [14], and the PM Gati Shakti platform links rail, road and port data. Similar corridor programs in Southeast Asia and the Gulf depend on container, trailer and railcar tracking. Lower-cost NB-IoT modules make these deployments viable at scale, giving Asia Pacific and the Middle East and Africa a growth premium over mature regions.

Declining Tag and Module Costs

Bluetooth SIG data show annual Bluetooth device shipments near 5 billion units , and that volume has driven beacon and tag prices sharply lower. Impinj filings describe continued growth in RAIN RFID endpoint ICs, with passive inlays priced at a few U.S. cents in high volume [17]. Cheaper endpoints widen the addressable base from forklifts to totes and consumables. Savings on devices also free budget for software and services.

Restraints Impact Analysis

Restraint impacts are directional estimates of downward pressure on the Wireless Asset Management Market's growth rate. They overlap with one another and should not be summed against the forecast CAGR.

Restraint ~% Impact on CAGR Geographic Relevance Impact Timeline
Legacy system integration complexity ~−1.1% Global Medium-term (2–4 yr)
Cybersecurity and device compliance costs ~−0.9% North America, Europe Long-term (≥4 yr)
Battery life and maintenance burden ~−0.7% Global Short-term (≤2 yr)
Network sunsets and spectrum fragmentation ~−0.6% Europe, Asia Pacific Short-term (≤2 yr)
Upfront cost and ROI uncertainty for SMEs ~−0.8% South America, Middle East and Africa Medium-term (2–4 yr)

Legacy System Integration Complexity

ERP and EAM systems, which were never intended for continuous event streams, are used by the majority of businesses to manage asset data. Pilots stall because location feeds cannot reconcile with master data, and integration frequently accounts for 30–40% of the project's overall cost. Because multiple APIs are exposed by reader, beacon, and tracker platforms, multi-vendor estates exacerbate the issue. Only when prebuilt connectors and open SDKs become more developed will there be relief [16].

Cybersecurity and Device Compliance Costs

Connected goods are subject to security-by-design obligations under the EU Cyber Resilience Act, which carries fines of up to EUR 15 million, or 2.5% of global revenue [7]. Default passwords on connectable consumer goods are prohibited under Britain's PSTI system as of April 2024 [20], and U.S. procurement is influenced by NIST's device baseline [19]. For low-margin tags and gateways, compliance increases the expense of engineering and certification.

Battery Life and Maintenance Burden

Active BLE, GPS and cellular tags depend on batteries, and replacing them across tens of thousands of assets erodes the labor savings that justified deployment. Frequent reporting intervals can cut battery life from five years to under two. Cold-chain and outdoor buyers, where low temperatures reduce capacity, often delay rollouts until energy-harvesting options mature [11].

Network Sunsets and Spectrum Fragmentation

2G and 3G shutdowns stranded legacy trackers across Europe and Asia, forcing unplanned replacement cycles. GSMA data show LTE-M and NB-IoT availability remains uneven, with some operators supporting only one technology [9]. UHF RFID bands also differ by region, 865–868 MHz in Europe versus 902–928 MHz in the United States, complicating global tag sourcing for multinational shippers.

Upfront Cost and ROI Uncertainty for SMEs

Small and mid-sized firms face reader, gateway and integration bills that can exceed USD 100,000 for a single warehouse before benefits appear. In South America and Africa, currency volatility and higher financing costs lengthen payback. Without subscription pricing, many SMEs stay on barcode processes, slowing penetration beyond large enterprises [22].

Wireless Asset Management Market Opportunities

Emerging-Market Logistics Corridors

Asia Pacific and the Middle East and Africa combine heavy infrastructure spending with low current penetration. India's logistics policy [14] and Gulf port-and-rail expansions create greenfield demand for container, trailer and railcar tracking, with no legacy systems to displace. Vendors offering NB-IoT trackers bundled with local operator connectivity can win share before incumbents localize.

Asset-as-a-Service and Data Monetization

Location and condition histories are becoming revenue streams in their own right within the Wireless Asset Management Market. Equipment lessors use utilization data to price pay-per-use contracts, insurers adjust premiums for monitored cargo, and pooling operators sell cycle-count evidence to brand owners facing reuse audits [6]. Subscriptions also lower SME entry costs, directly addressing the ROI restraint. Samsara's recurring-revenue growth shows the model's appeal [18].

Multi-Radio Hybrid Tags

Tags that switch between Bluetooth indoors, cellular on highways and RFID at dock doors remove the need to choose one radio per site. Hybrid designs optimize battery life by selecting the lowest-power link available. Shippers moving goods from factory to store gain a single identity per asset, a gap no single-technology vendor fills today.

Cold-Chain Pharmaceutical and Food Monitoring

DSCSA tracing and stricter temperature-excursion audits push pharmacies, distributors and biologics makers toward battery-assisted labels that log temperature alongside identity. Combining chain-of-custody and condition records in one data feed simplifies regulatory submissions. Fresh-food retailers face similar pressure from waste-reduction targets, opening a second large buyer pool.

Battery-Free and Ambient IoT Tags

3GPP's Release 19 ambient IoT study and Bluetooth energy-harvesting work point toward tags powered by ambient radio energy [11]. Eliminating battery replacement would make tracking viable for low-value consumables and returnable packaging at volumes in the billions. Early movers in chip design and reader infrastructure stand to set de facto standards.

Wireless Asset Management Market Future Outlook

AI-Driven Asset Intelligence

Through 2035, value in the Wireless Asset Management Market will migrate from knowing where an asset is to predicting what it will need. Machine-learning models trained on location, vibration and usage data already forecast failures and optimize fleet sizing. IoT Analytics expects connected IoT devices to approach 40 billion by 2030 [22], and that data volume makes AI-native platforms the default rather than an add-on.

Platform Economics and Recurring Revenue

Vendors are shifting from one-time device sales to subscriptions bundling hardware, connectivity and analytics. Zebra and Samsara both emphasize recurring software revenue in their filings [16][18]. Expect consolidation as hardware specialists acquire analytics firms and network operators move up the stack through managed private-network contracts.

5G-Advanced, Ambient IoT and Precision Positioning

3GPP Release 18 adds positioning enhancements that bring cellular accuracy toward the sub-meter range [11]. Combined with ultra-wideband, these capabilities will let real-time location systems operate across campuses without dedicated anchor infrastructure. Ambient IoT tags, powered by harvested radio energy, should reach commercial volumes in the early 2030s.

ESG and Circular-Economy Reporting

The Corporate Sustainability Reporting Directive brings roughly 50,000 companies into mandatory sustainability disclosure [21]. Reuse rates, asset lifetimes and loss figures become auditable metrics, and tracking data supplies the evidence. Packaging rules [6] reinforce the trend, making asset-level traceability a compliance input rather than an operational choice.

Regional Market Share Analysis

Region Key Metric (2025) Primary Investment Themes
North America 36.5% share Healthcare UDI and DSCSA compliance; retail RFID; private 5G
Europe USD 5.45 Billion Packaging reuse tracking; Industry 4.0 retrofits; secure devices
Asia Pacific 14.2% CAGR Electronics manufacturing; logistics corridors; NB-IoT scale
South America 5.0% share Agribusiness logistics; mining fleets
Middle East and Africa USD 1.11 Billion Oil and gas assets; port and rail megaprojects
Total USD 20.20 Billion —

Regional demand in the Wireless Asset Management Market follows regulatory pressure and logistics intensity. North America and Europe lead on compliance-driven spending, while Asia Pacific and the Middle East and Africa grow fastest on infrastructure buildout.

North America

Country Key Metric (2025) Key Driver
United States USD 6.12 Billion DSCSA tracing, hospital equipment tagging, retail RFID
Canada 11.0% of regional market Rail and mining fleet tracking
Mexico 12.8% CAGR Nearshoring-led factory and trailer tracking

The United States is the single largest country in the Wireless Asset Management Market. DSCSA tracing , UDI requirements and Walmart's supplier mandate [5] create overlapping compliance pull, while CBRS spectrum lets hospitals, ports and factories run private LTE and 5G networks for trackers [10]. Canada's demand centers on Class I railways and mining fleets across remote territory. Mexico benefits from nearshoring as automotive and electronics plants adopt work-in-progress visibility and cross-border trailer monitoring.

Europe

Country Key Metric (2025) Key Driver
Germany 24.0% of regional market Smart factories and campus 5G
United Kingdom USD 1.04 Billion NHS equipment tracking and retail RFID
France 10.8% CAGR Reusable packaging and pharma logistics
Italy 10.5% of regional market Food and fashion supply chains
Spain USD 0.44 Billion Pallet pooling and retail tagging
Russia 7.2% CAGR Domestic rail and energy assets
Rest of Europe 16.0% of regional market Nordic and Benelux logistics hubs

Germany anchors European demand through Industry 4.0 programs and local 5G licenses in the 3.7–3.8 GHz band [24]. Packaging regulation [6] makes returnable transport assets a priority in France, Spain and Italy, where pooling operators manage large pallet and crate fleets. The United Kingdom leads hospital asset tracking within the NHS estate. Russia trails the region as sanctions restrict access to Western hardware and platforms.

Asia Pacific

Country Key Metric (2025) Key Driver
China 38.0% of regional market Manufacturing scale and NB-IoT coverage
Japan USD 1.05 Billion Convenience retail and apparel RFID
India 17.1% CAGR Logistics policy and warehousing boom
South Korea 9.0% of regional market 5G smart factories
Australia USD 0.37 Billion Mining and agriculture asset tracking
Rest of Asia Pacific 14.6% CAGR Southeast Asian port and corridor projects

China's electronics and automotive supply chains make it the region's largest country market, supported by nationwide NB-IoT coverage. India is the fastest-growing country, propelled by the National Logistics Policy [14] and rapid warehouse construction. Japan applies RFID across convenience retail and apparel, South Korea pairs 5G campus networks with smart-factory programs, and Australia deploys GPS and LPWAN trackers across mining, agriculture and remote logistics.

South America

Country Key Metric (2025) Key Driver
Brazil 54.0% of regional market Agribusiness and parcel logistics
Argentina 11.2% CAGR Grain exports and energy assets
Rest of South America USD 0.27 Billion Mining fleets in Chile and Peru

Brazil accounts for more than half of regional spending, led by agribusiness, mining and parcel logistics. Argentina's adoption concentrates in grain export logistics and energy assets in the Vaca Muerta basin, though currency volatility delays capital projects. Across the Rest of South America, Chilean and Peruvian mining operators drive demand for rugged GPS and LPWAN trackers.

Middle East and Africa

Country Key Metric (2025) Key Driver
Middle East 61.0% of regional market Energy assets and logistics hubs
Saudi Arabia 13.4% CAGR Vision 2030 construction and oil and gas
United Arab Emirates USD 0.17 Billion Port, airport and free-zone logistics
Turkey 11.9% CAGR Export manufacturing
Rest of Middle East USD 0.11 Billion Qatar and Oman energy projects
Africa 39.0% of regional market Mining, ports and fleet tracking
South Africa USD 0.18 Billion Mining and retail deployments
Nigeria 13.0% CAGR Fleet and oilfield asset tracking
Egypt 12.2% CAGR Suez corridor and port logistics
Rest of Africa USD 0.07 Billion Early-stage fleet tracking

Saudi Arabia's Vision 2030 megaprojects and the United Arab Emirates' port and free-zone hubs lead Middle Eastern demand, with oil and gas operators deploying rugged sensors on wellheads and pipelines. Turkey's manufacturing base adopts tracking for export supply chains. In Africa, South Africa leads on mining and retail deployments, Nigeria and Egypt scale cellular trackers for fleets and ports, and the Rest of Africa remains early-stage.

Wireless Asset Management Market By Region, 2025-2035

Wireless Asset Management Market Segmentation

By Component

Within the Wireless Asset Management Market, Hardware holds a 53.2% share in 2025 because every deployment starts with readers, beacons, gateways and trackers. Device margins are compressing as tags commoditize. Services is the fastest-growing component at a 12.9% CAGR, as enterprises outsource site surveys, integration, security monitoring and firmware patching. Software sits between them, unifying data from mixed radio estates and turning location streams into maintenance and utilization decisions.

Segment Key Metric (2025) Primary Demand Driver
Hardware 53.2% share Reader, beacon and tracker installations
Software USD 4.85 Billion Cloud platforms unifying multi-radio data
Services 12.9% CAGR Outsourced integration and managed security

By Connectivity Technology

In the Wireless Asset Management Market, RFID leads connectivity with a 33.8% share, sustained by retail item tagging and device traceability at controlled chokepoints. Cellular IoT (LTE-M, NB-IoT, 5G) grows fastest at a 14.1% CAGR as modules push tracking beyond four walls into yards and railcars. Bluetooth Low Energy dominates indoor zoning, GPS / GNSS remains the fleet staple, Wi-Fi reuses existing access points, and LPWAN (LoRa, Sigfox etc.) serves utilities and agriculture, where LoRa Alliance reports over 300 million end devices [13].

Segment Key Metric (2025) Primary Demand Driver
RFID 33.8% share Retail and healthcare item-level tagging
Bluetooth Low Energy USD 3.62 Billion Indoor zoning in hospitals and warehouses
Wi-Fi 11.5% share Reuse of enterprise access points
Cellular IoT (LTE-M, NB-IoT, 5G) 14.1% CAGR Private 5G and wide-area tracking
GPS / GNSS USD 2.22 Billion Over-the-road fleets and trailers
LPWAN (LoRa, Sigfox etc.) 13.2% CAGR Utilities, agriculture and remote sites

By Asset Category

Across the Wireless Asset Management Market, Mobile Equipment leads with a 39.2% share, spanning forklifts, hospital beds, carts and field tools that move often and go missing. Consumables grows fastest at a 13.7% CAGR as reuse mandates force tagging of surgical kits, calibrated tools and reusable containers. Returnable Transport Assets benefit from packaging regulation, while Fixed Equipment such as generators and HVAC units adopts condition sensors more slowly because retrofits are costly.

Segment Key Metric (2025) Primary Demand Driver
Mobile Equipment 39.2% share Utilization and loss reduction
Fixed Equipment USD 4.73 Billion Condition monitoring of installed assets
Consumables 13.7% CAGR Reuse tracking and sterilization cycles
Returnable Transport Assets 14.5% share Pallet and crate pooling compliance
Other Asset Category 9.6% CAGR IT hardware and specialty assets

By Industry Vertical

Healthcare is the largest vertical in the Wireless Asset Management Market with a 28.5% share, propelled by UDI, sterilization tracking and equipment-rental savings. Retail grows fastest at a 14.4% CAGR as chains extend item-level RFID from apparel to grocery, pharmacy and home goods. Manufacturing applies tracking to work-in-progress and tooling, Logistics and Transportation monetizes shipment visibility, and Oil and Gas deploys rugged sensors to curb inspection costs.

Segment Key Metric (2025) Primary Demand Driver
Manufacturing USD 4.36 Billion Work-in-progress and tooling visibility
Healthcare 28.5% share UDI and sterilization compliance
Logistics and Transportation 18.2% share Trailer, container and parcel visibility
Oil and Gas USD 1.41 Billion Remote wellhead and pipeline monitoring
Retail 14.4% CAGR Item-level RFID mandates
Other Industry Vertical 10.3% share Utilities, construction and government

By Application

Physical Asset Monitoring anchors the Wireless Asset Management Market with a 37.5% share, the entry use case for most buyers locating and auditing equipment. Predictive Maintenance Management grows fastest at a 14.8% CAGR as condition data feeds failure models. Inventory Control Automation follows retail and warehouse RFID programs, and Loss Prevention gains traction in high-shrink retail and construction tool cribs.

Segment Key Metric (2025) Primary Demand Driver
Physical Asset Monitoring 37.5% share Location and audit of equipment fleets
Inventory Control Automation USD 5.01 Billion Automated cycle counts in retail and warehouses
Predictive Maintenance Management 14.8% CAGR Condition-based maintenance models
Loss Prevention 12.6% share Shrink and theft reduction
Other Application USD 1.17 Billion Compliance logging and utilization billing

Competitive Benchmarking

The Wireless Asset Management Market is moderately fragmented. Market Research Future estimates the top five vendors hold about 34–38% of revenue, with a Herfindahl-Hirschman Index near 1,000. Hardware leaders, chip suppliers, network vendors and cloud-native platforms compete across overlapping layers, and no single company spans all of them.

Company Est. Revenue Share Range Key Offerings for Wireless Asset Management Market Strategic Positioning
Zebra Technologies ~9–12% RFID readers, printers, mobile computers, MotionWorks location software Broadest hardware-to-software portfolio; shift to subscriptions
Honeywell International ~6–9% Rugged scanners, RFID readers, Honeywell Forge analytics Warehouse and industrial automation integration
Avery Dennison ~4–7% RFID inlays and labels, atma.io product cloud Volume supplier for retail and apparel tagging
Impinj ~4–6% RAIN RFID endpoint ICs, readers, gateways Chip-level leader enabling item-level tagging
Trimble ~3–5% GNSS trackers, fleet and construction asset platforms Positioning expertise for field and transport assets
Siemens ~3–5% SIMATIC RF industrial identification, Insights Hub analytics Factory automation installed base
Samsara ~3–5% Connected Operations Cloud, asset tags, vehicle gateways Cloud-native subscription model
Cisco Systems ~2–4% Industrial Wi-Fi, private 5G, Spaces location analytics Network-layer positioning inside campuses
IBM ~2–4% Maximo Application Suite for EAM and predictive maintenance AI-driven maintenance on top of tracking data
Semtech ~2–3% LoRa chipsets, Sierra Wireless modules and trackers LPWAN and cellular connectivity supplier

Recent News & Developments

The developments below shaped the Wireless Asset Management Market between 2023 and 2025.

  • Semtech (January 2023): Completed its acquisition of Sierra Wireless, combining LoRa chipsets with cellular modules and giving one supplier both LPWAN and LTE-M/NB-IoT portfolios [23]
  • Impinj (October 2023): Introduced its M800 series RAIN RFID tag chips with improved sensitivity, extending read range for item-level retail and logistics tagging [17]
  • Walmart (February 2024): Expanded supplier RFID tagging requirements to additional general merchandise categories, shifting tag application upstream to manufacturers [5]
  • UK Government (April 2024): Product security requirements under the PSTI Act took effect, banning default passwords on connectable consumer products [20]
  • Zebra Technologies (June 2024): Extended its MotionWorks suite with maintenance-prediction capabilities, reinforcing the move toward recurring software revenue [16]
  • U.S. FDA (November 2024): DSCSA enhanced drug distribution security requirements took effect, with targeted exemptions to ease the transition for smaller trading partners
  • European Union (December 2024): The Cyber Resilience Act entered into force, setting a phased timeline for security-by-design obligations on connected devices [7]
  • European Union (January 2025): Regulation (EU) 2025/40 on packaging and packaging waste was published, establishing reuse targets that require cycle tracking of transport packaging [6]

Wireless Asset Management Market Report Scope

Parameter Details
Market Scope Hardware, software and services that identify, locate and monitor physical assets over RFID, Bluetooth Low Energy, Wi-Fi, cellular, GPS / GNSS and LPWAN networks across manufacturing, healthcare, logistics, oil and gas and retail end uses
Study Period 2021–2035
Base Year 2025
Historical Data 2021–2024
Forecast Period 2026–2035
Market Size in 2025 USD 20.20 Billion
Market Size in 2035 USD 60.55 Billion
CAGR (2026–2035) 11.6%
Fastest Growing Segments Predictive Maintenance Management (14.8% CAGR); Retail (14.4% CAGR); Cellular IoT (LTE-M, NB-IoT, 5G) (14.1% CAGR); Consumables (13.7% CAGR)
Regions Covered North America, Europe, South America, Asia Pacific, Middle East and Africa and ROW
Companies Profiled Zebra Technologies, Honeywell International, Avery Dennison, Impinj, Trimble, Siemens, Samsara, Cisco Systems, IBM, Semtech
Valuation Currency USD Billion
Methodology 350+ primary expert interviews; bottom-up market sizing; top-down validation; data triangulation; scenario-based forecasting; real-time project tracking

FAQs

How should buyers evaluate vendors in the Wireless Asset Management Market?
Prioritize open APIs, multi-radio support and proven integration with existing ERP or EAM systems. Request a paid pilot with defined accuracy and battery-life targets before committing to enterprise licensing.
Is ultra-wideband replacing Bluetooth Low Energy for indoor positioning?
No; the two are increasingly complementary. Ultra-wideband delivers 10–30 centimeter accuracy for robot navigation and tool control, while Bluetooth Low Energy stays cheaper for room-level zoning across large estates.
What contract terms matter most in tracker-as-a-service agreements?
Lock in data ownership, export rights and connectivity pricing for the full term. Clauses covering module replacement after network sunsets prevent surprise hardware costs midway through multi-year contracts.
How does data privacy regulation affect the Wireless Asset Management Market?
Trackers on vehicles or worn by staff can generate personal data under GDPR. Employers typically need a legitimate-interest assessment, works-council consultation in Germany and location masking outside working hours.
Can existing Wi-Fi infrastructure support asset tracking without new hardware?
Partially. Access points with location analytics can locate Wi-Fi-enabled devices at roughly 3–5 meter accuracy, but passive assets still need tags, so many enterprises activate the BLE radios built into newer access points.
Which emerging use cases could open new revenue in the Wireless Asset Management Market?
Construction tool rental, airport ground-support equipment and data-center hardware are early-stage niches of the Wireless Asset Management Market. Each involves high-value mobile assets with frequent loss and no established tracking standard.
What payback period do hospital equipment tracking deployments typically achieve?
Most hospitals report payback within 12–24 months from lower equipment rental, fewer lost devices and less nursing time spent searching. Projects linking tracking to maintenance and sterilization workflows reach payback fastest.
Author
Author Author Profile Aarti Dhapte LinkedIn AVP - Research
A consulting professional focused on helping businesses navigate complex markets through structured research and strategic insights. I partner with clients to solve high-impact business problems across market entry strategy, competitive intelligence, and opportunity assessment. Over the course of my experience, I have led and contributed to 100+ market research and consulting engagements, delivering insights across multiple industries and geographies, and supporting strategic decisions linked to $500M+ market opportunities. My core expertise lies in building robust market sizing, forecasting, and commercial models (top-down and bottom-up), alongside deep-dive competitive and industry analysis. I have played a key role in shaping go-to-market strategies, investment cases, and growth roadmaps, enabling clients to make confident, data-backed decisions in dynamic markets.
Download Free Sample

Kindly complete the form below to receive a free sample of this Report

Global Diameter Signaling Market
Case Study
Information and Communications Technology
Download PDF ×

We do not share your information with anyone. However, we may send you emails based on your report interest from time to time. You may contact us at any time to opt-out.