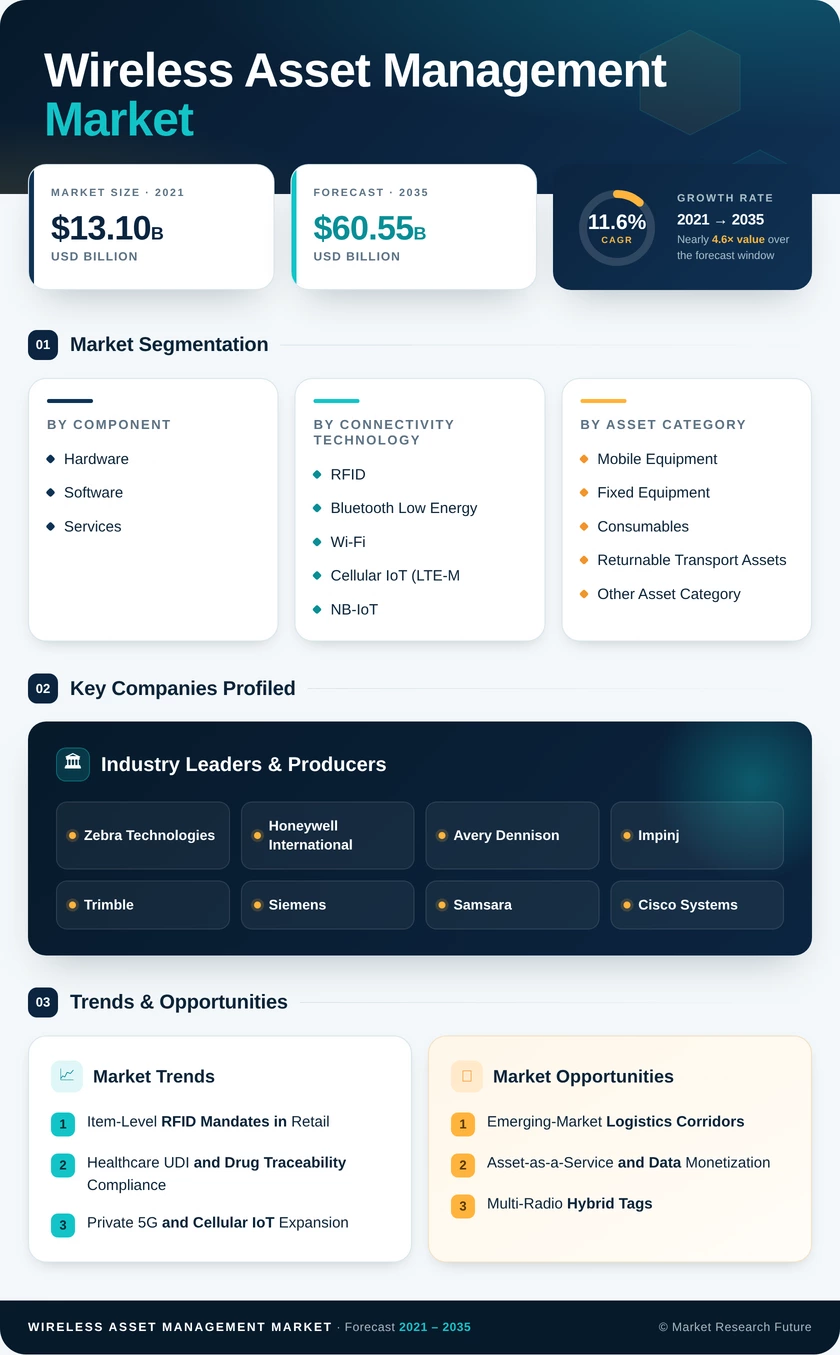
Wireless Asset Management Market (2026 - 2035)

ID: MRFR/ICT/30340-HCR 100 Pages Aarti Dhapte Last Updated: October 24, 2026
Wireless Asset Management Market Size, Share and Research Report By Component (Hardware, Software, and Services), By Connectivity Technology (RFID, Bluetooth Low Energy, Wi-Fi, Cellular IoT (LTE-M, NB-IoT, 5G), GPS / GNSS, and LPWAN (LoRa, Sigfox, etc.)), By Asset Category (Mobile Equipment, Fixed Equipment, Consumables, Returnable Transport Assets, and Other Asset Categories), By Industry Vertical (Manufacturing, Healthcare, Logistics and Transportation, Oil and Gas, Retail, and Other Industry Verticals), By Application (Physical Asset Monitoring, Inventory Control Automation, Predictive Maintenance Management, Loss Prevention, and Other Applications) – Industry Forecast Till 2035
Wireless Asset Management Market
Market Size
Forecast Period2026-2035
CAGR (2026-2035)11.6%
2025 Market SizeUSD 20.20 Billion
2035 Market SizeUSD 60.55 Billion
Key Players
Zebra Technologies
Honeywell International
Avery Dennison
Impinj
Trimble
Siemens
Opportunities
  • Emerging-Market Logistics Corridors
  • Asset-as-a-Service and Data Monetization
  • Multi-Radio Hybrid Tags
  1. 1 Market Summary | |
  2. 2 Key Report Takeaways | |
    1. 2.1 By Component | |
    2. 2.2 By Connectivity Technology | |
    3. 2.3 By Asset Category | |
    4. 2.4 By Industry Vertical | |
    5. 2.5 By Application | |
    6. 2.6 By Region | |
  3. 3 Market Size and Forecast (2021–2035) | |
    1. 3.1 Historical Market Size (2021–2025) | |
    2. 3.2 Forecast Market Size (2026–2035) | |
    3. 3.3 Year-over-Year Growth Analysis | |
  4. 4 Driver Impact Analysis | |
    1. 4.1 Item-Level RFID Mandates in Retail | |
    2. 4.2 Healthcare UDI and Drug Traceability Compliance | |
    3. 4.3 Private 5G and Cellular IoT Expansion | |
    4. 4.4 Industry
    5. 4.0 and Predictive Maintenance Adoption | |
    6. 4.5 Circular Packaging and Reuse Regulation | |
    7. 4.6 Logistics Digitization in Emerging Economies | |
    8. 4.7 Declining Tag and Module Costs | |
  5. 5 Restraints Impact Analysis | |
    1. 5.1 Legacy System Integration Complexity | |
    2. 5.2 Cybersecurity and Device Compliance Costs | |
    3. 5.3 Battery Life and Maintenance Burden | |
    4. 5.4 Network Sunsets and Spectrum Fragmentation | |
    5. 5.5 Upfront Cost and ROI Uncertainty for SMEs | |
  6. 6 Opportunities | |
    1. 6.1 Emerging-Market Logistics Corridors | |
    2. 6.2 Asset-as-a-Service and Data Monetization | |
    3. 6.3 Multi-Radio Hybrid Tags | |
    4. 6.4 Cold-Chain Pharmaceutical and Food Monitoring | |
    5. 6.5 Battery-Free and Ambient IoT Tags | |
  7. 7 Regional Market Share and Country-Level Analysis | |
    1. 7.1 North America | | |
      1. 7.1.1 United States | | |
      2. 7.1.2 Canada | | |
      3. 7.1.3 Mexico | |
    2. 7.2 Europe | | |
      1. 7.2.1 Germany | | |
      2. 7.2.2 United Kingdom | | |
      3. 7.2.3 France | | |
      4. 7.2.4 Italy | | |
      5. 7.2.5 Spain | | |
      6. 7.2.6 Russia | | |
      7. 7.2.7 Rest of Europe | |
    3. 7.3 Asia Pacific | | |
      1. 7.3.1 China | | |
      2. 7.3.2 Japan | | |
      3. 7.3.3 India | | |
      4. 7.3.4 South Korea | | |
      5. 7.3.5 Australia | | |
      6. 7.3.6 Rest of Asia Pacific | |
    4. 7.4 South America | | |
      1. 7.4.1 Brazil | | |
      2. 7.4.2 Argentina | | |
      3. 7.4.3 Rest of South America | |
    5. 7.5 Middle East and Africa | | |
      1. 7.5.1 Middle East | | |
      2. 7.5.2 Saudi Arabia | | |
      3. 7.5.3 United Arab Emirates | | |
      4. 7.5.4 Turkey | | |
      5. 7.5.5 Rest of Middle East | | |
      6. 7.5.6 Africa | | |
      7. 7.5.7 South Africa | | |
      8. 7.5.8 Nigeria | | |
      9. 7.5.9 Egypt | | |
      10. 7.5.10 Rest of Africa | |
  8. 8 Future Outlook (2026–2035) | |
    1. 8.1 AI-Driven Asset Intelligence | |
    2. 8.2 Platform Economics and Recurring Revenue | |
    3. 8.3 5G-Advanced, Ambient IoT and Precision Positioning | |
    4. 8.4 ESG and Circular-Economy Reporting | |
  9. 9 Segmentation Analysis | |
    1. 9.1 By Component | | |
      1. 9.1.1 Hardware | | |
      2. 9.1.2 Software | | |
      3. 9.1.3 Services | |
    2. 9.2 By Connectivity Technology | | |
      1. 9.2.1 RFID | | |
      2. 9.2.2 Bluetooth Low Energy | | |
      3. 9.2.3 Wi-Fi | | |
      4. 9.2.4 Cellular IoT (LTE-M, NB-IoT, 5G) | | |
      5. 9.2.5 GPS / GNSS | | |
      6. 9.2.6 LPWAN (LoRa, Sigfox etc.) | |
    3. 9.3 By Asset Category | | |
      1. 9.3.1 Mobile Equipment | | |
      2. 9.3.2 Fixed Equipment | | |
      3. 9.3.3 Consumables | | |
      4. 9.3.4 Returnable Transport Assets | | |
      5. 9.3.5 Other Asset Category | |
    4. 9.4 By Industry Vertical | | |
      1. 9.4.1 Manufacturing | | |
      2. 9.4.2 Healthcare | | |
      3. 9.4.3 Logistics and Transportation | | |
      4. 9.4.4 Oil and Gas | | |
      5. 9.4.5 Retail | | |
      6. 9.4.6 Other Industry Vertical | |
    5. 9.5 By Application | | |
      1. 9.5.1 Physical Asset Monitoring | | |
      2. 9.5.2 Inventory Control Automation | | |
      3. 9.5.3 Predictive Maintenance Management | | |
      4. 9.5.4 Loss Prevention | | |
      5. 9.5.5 Other Application | |
  10. 10 Competitive Landscape | |
    1. 10.1 Market Concentration Analysis | |
    2. 10.2 Competitive Benchmarking Matrix | |
    3. 10.3 Company Profiles | | |
      1. 10.3.1 Zebra Technologies | | |
      2. 10.3.2 Honeywell International | | |
      3. 10.3.3 Avery Dennison | | |
      4. 10.3.4 Impinj | | |
      5. 10.3.5 Trimble | | |
      6. 10.3.6 Siemens | | |
      7. 10.3.7 Samsara | | |
      8. 10.3.8 Cisco Systems | | |
      9. 10.3.9 IBM | | |
      10. 10.3.10 Semtech | |
  11. 11 Recent News & Developments | |
  12. 12 Report Scope and Methodology | |
  13. 13 Detailed Sources and Citations | |
  14. 14 Frequently Asked Questions (FAQs) | | LIST OF TABLES | |
  15. TABLE 1 Global Market Size and Forecast, by Revenue (USD Billion), 2021–2035 | |
  16. TABLE 2 Year-over-Year Growth Analysis, 2021–2035 | |
  17. TABLE 3 Driver Impact Analysis | |
  18. TABLE 4 Restraints Impact Analysis | |
  19. TABLE 5 Regional Summary, by Region, 2025 | |
  20. TABLE 6 North America Market, by Country, 2025 | |
  21. TABLE 7 Europe Market, by Country, 2025 | |
  22. TABLE 8 Asia Pacific Market, by Country, 2025 | |
  23. TABLE 9 South America Market, by Country, 2025 | |
  24. TABLE 10 Middle East and Africa Market, by Country, 2025 | |
  25. TABLE 11 Market Segmentation, by Component, 2025 | |
  26. TABLE 12 Market Segmentation, by Connectivity Technology, 2025 | |
  27. TABLE 13 Market Segmentation, by Asset Category, 2025 | |
  28. TABLE 14 Market Segmentation, by Industry Vertical, 2025 | |
  29. TABLE 15 Market Segmentation, by Application, 2025 | |
  30. TABLE 16 Competitive Benchmarking Matrix, 2025 | |
  31. TABLE 17 Report Scope and Methodology | |
  32. TABLE 18 Detailed Sources and Citations | |
  33. TABLE 19 Segmentation Quick Reference | | LIST OF FIGURES | |
  34. FIGURE 1 Market Dynamics Overview (Drivers, Restraints, Opportunities) | |
  35. FIGURE 2 Industry Value Chain Analysis | |
  36. FIGURE 3 Porter's Five Forces Analysis | |
  37. FIGURE 4 Global Market Size Trend (USD Billion), 2021–2035 | |
  38. FIGURE 5 Market Share, by Component, 2025 | |
  39. FIGURE 6 Market Share, by Connectivity Technology, 2025 | |
  40. FIGURE 7 Market Share, by Asset Category, 2025 | |
  41. FIGURE 8 Market Share, by Industry Vertical, 2025 | |
  42. FIGURE 9 Market Share, by Application, 2025 | |
  43. FIGURE 10 Regional Market Share, 2025 | |
  44. FIGURE 11 Regional CAGR Comparison, 2026–2035 | |
  45. FIGURE 12 Competitive Landscape Positioning Map | |
  46. FIGURE 13 Estimated Vendor Revenue Share Ranges, 2025

Segmentation Quick Reference

DimensionSub-SegmentsDominant SegmentFastest Growing Segment
By ComponentHardware, Software, ServicesHardware (53.2% share)Services (12.9% CAGR)
By Connectivity TechnologyRFID, Bluetooth Low Energy, Wi-Fi, Cellular IoT (LTE-M, NB-IoT, 5G), GPS / GNSS, LPWAN (LoRa, Sigfox etc.)RFID (33.8% share)Cellular IoT (LTE-M, NB-IoT, 5G) (14.1% CAGR)
By Asset CategoryMobile Equipment, Fixed Equipment, Consumables, Returnable Transport Assets, Other Asset CategoryMobile Equipment (39.2% share)Consumables (13.7% CAGR)
By Industry VerticalManufacturing, Healthcare, Logistics and Transportation, Oil and Gas, Retail, Other Industry VerticalHealthcare (28.5% share)Retail (14.4% CAGR)
By ApplicationPhysical Asset Monitoring, Inventory Control Automation, Predictive Maintenance Management, Loss Prevention, Other ApplicationPhysical Asset Monitoring (37.5% share)Predictive Maintenance Management (14.8% CAGR)
By RegionNorth America, Europe, Asia Pacific, South America, Middle East and AfricaNorth America (36.5% share)Asia Pacific (14.2% CAGR)

Market Segmentation Overview

By Component

Sub-SegmentKey Trend
HardwareReader and tag commoditization compresses device margins
SoftwareCloud platforms consolidate data from mixed radio estates
ServicesOutsourced integration, security monitoring and firmware patching

Hardware leads because every deployment begins with readers, beacons and trackers, yet falling device prices limit its revenue upside. Services grows fastest as enterprises lack in-house skills to integrate heterogeneous radios and keep firmware patched under new device-security rules. Software ties the two together, and buyers increasingly judge vendors on API openness rather than antenna specifications.

By Connectivity Technology

Sub-SegmentKey Trend
RFIDItem-level retail and medical device tagging at chokepoints
Bluetooth Low EnergyLow-cost indoor zoning in hospitals and warehouses
Wi-FiLocation analytics on existing access points
Cellular IoT (LTE-M, NB-IoT, 5G)Private 5G and wide-area coverage beyond facility walls
GPS / GNSSFleet and trailer tracking on open roads
LPWAN (LoRa, Sigfox etc.)Long-range, low-data links for utilities and agriculture

RFID leads on the strength of retail source-tagging and healthcare traceability, but it only reads at fixed portals. Cellular IoT (LTE-M, NB-IoT, 5G) grows fastest because power-saving modes and private-network contracts let trackers follow assets through yards, railcars and highways. Bluetooth Low Energy and Wi-Fi remain the practical indoor complements.

By Asset Category

Sub-SegmentKey Trend
Mobile EquipmentUtilization analytics to right-size fleets
Fixed EquipmentCondition sensors on HVAC units and generators
ConsumablesDurable tags that survive sterilization and reuse cycles
Returnable Transport AssetsCycle counting for pallet and crate pooling
Other Asset CategoryIT hardware and specialty tools

Mobile Equipment dominates because forklifts, beds and carts move constantly and carry high replacement costs. Consumables grows fastest as reuse obligations require proof of every sterilization or return cycle, while Returnable Transport Assets gains from European packaging rules. Fixed Equipment trails because retrofitting older installed assets is slow and costly.

By Industry Vertical

Sub-SegmentKey Trend
ManufacturingWork-in-progress and tooling visibility
HealthcareUDI, DSCSA and sterilization compliance
Logistics and TransportationMonetized shipment visibility
Oil and GasRugged sensors on remote wellheads and pipelines
RetailItem-level RFID beyond apparel
Other Industry VerticalUtilities, construction and government fleets

Healthcare leads because device identification and drug tracing rules make tracking mandatory rather than optional. Retail grows fastest as supplier tagging mandates extend RFID from apparel into grocery, pharmacy and home goods, removing tagging cost from stores. Manufacturing and Logistics and Transportation provide steady volume through work-in-progress and trailer tracking.

By Application

Sub-SegmentKey Trend
Physical Asset MonitoringLocation and audit as the entry use case
Inventory Control AutomationAutomated cycle counts replacing manual audits
Predictive Maintenance ManagementFailure models fed by condition data
Loss PreventionShrink reduction in retail and tool cribs
Other ApplicationCompliance logging and utilization billing

Physical Asset Monitoring leads because locating and auditing equipment is where most buyers start. Predictive Maintenance Management grows fastest once location tags gain vibration and temperature sensing, letting operators move from fixed schedules to condition-based service. Inventory Control Automation and Loss Prevention follow retail and warehouse RFID programs closely.


Download PDF ×

We do not share your information with anyone. However, we may send you emails based on your report interest from time to time. You may contact us at any time to opt-out.