ID: MRFR/ICT/1256-HCR | February 2021 | Region: Global | 110 pages
Market Synopsis:
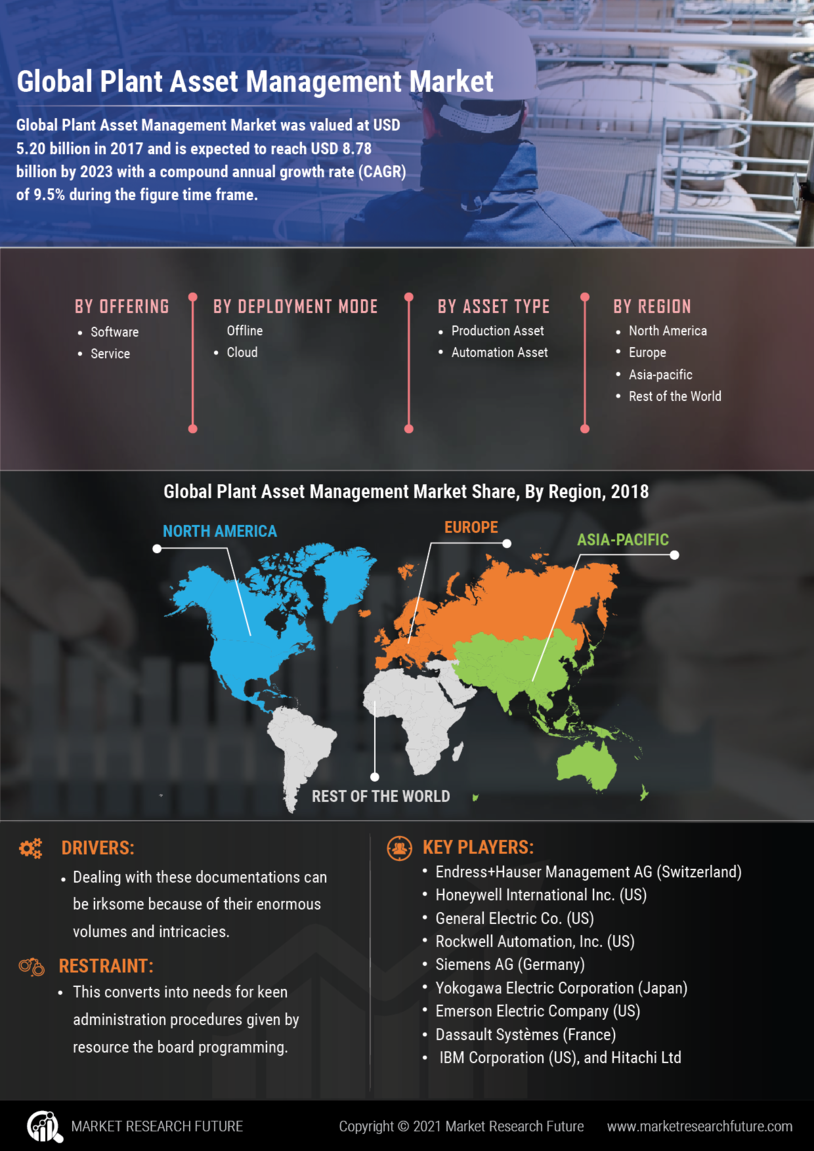
Globally, plant asset management (PAM) market is expected to grow from USD 5.20 billion in 2017 to USD 8.78 billion by 2023, at a CAGR of 9.5% during the forecast period.
Plant asset management is a practice used to optimize operations and gain maximum benefits from all the involved assets in a facility. It is a process of enhancing field devices and monitoring their functioning; this information is used to improve the machine operating performance, thus reducing maintenance cost and documentation. Plant asset management is a cost-cutting strategy used in different industrial plants; it predicts potential asset failures and precautionary measures needed to minimize the downtime according to the size of an industrial plant. Plant asset management assesses the condition of assets and uses different technologies such as ultrasonic vibration, and modeling software to protect and forecast the health of an asset. The plant asset management market is driven by the rising demand for cloud-based plant asset management solution. The adoption of lean manufacturing practicing, the requirement of real-time data analysis, and increasing demand for failure detection software is also propelling market growth. Plant asset management in industries offers efficient plant commissioning, provides remote device parameterization, comprehensive monitoring of process-critical devices, and enables users to manage devices or parameters in plant remotely.
Plant Asset Management Market, USD Billion:
Regional Analysis:
The global market for plant asset management is estimated to grow at a moderate rate during the forecast period from 2018 to 2023.
Asia-Pacific is expected to dominate the plant asset management market due to the presence of various key players and vendors in the region. Additionally, the growing solar , hardware, energy and power, and automotive industries are fueling market growth in the region. The growing economy has led to the development in Japan, India, China, and other Asian countries as the industries are adopting plant asset management to reduce the cost of maintenance; this factor is driving the market growth due to increasing foreign investments in the region. Asia-Pacific is also expected to be the fastest growing market due to the rapidly expanding industrial base and rising competition among the players in the region. North America is projected to be the second-largest market due to the presence of various industries and key players such as IBM Corporation and Honeywell International Inc. in the region. North America also has early access to new technologies due to superior infrastructure support, therefore it is one of the early adopters of the plant asset management solution, which is responsible for the market growth.
Competitive Analysis:
The requirement of plant asset management is increasing rapidly for reducing machine failure and downtime, resulting in cost saving. Technological advancements and increasing awareness about plant asset management among the users drive the growth of the plant asset management market.
In September 2018, Encavis Asset Management a Germany-based company agreed to enter into an extensive cooperative alliance for institutional investments in renewable energy services with Maxwell Technologies, Inc. This will lead to management of the machinery in the energy plants and reduction of cost.
Key Players:
The prominent players in the market of plant asset management market are General Electric Co. (US), Endress+Hauser Management AG (Switzerland), Rockwell Automation, Inc. (US) , Honeywell International Inc. (US), Siemens AG (Germany), Yokogawa Electric Corporation (Japan), Dassault Systèmes (France), Emerson Electric Company (US), IBM Corporation (US), and Hitachi Ltd.
Intended Audience:
Frequently Asked Questions (FAQ) :
USD 5.20 billion is the historic valuation that the plant asset management market gained in 2017.
The plant asset management market will gain a valuation of USD 8.78 billion until 2023.
The plant asset management market will be attaining a CAGR of 9.5% for its growth in the forecast period.
The global market for plant asset management will be growing during the period from 2018 to 2023.
Asia-Pacific will be leading the plant asset management market for having the presence of key players and sellers.
TABLE OF CONTENTS
1. Executive Summary
2. Scope of the Report
2.1. Market Definition
2.2. Scope of the Study
2.2.1. Research Objectives
2.2.2. Assumptions & Limitations
2.3. Markets Structure
3. Market Research Methodology
3.1. Research Process
3.2. Secondary Research
3.3. Primary Research
3.4. Forecast Model
4. Market Landscape
4.1. Porter’s Five Forces Analysis
4.1.1. Threat of New Entrants
4.1.2. Bargaining power of buyers
4.1.3. Threat of substitutes
4.1.4. Rivalry
4.1.5. Bargaining Power of Suppliers
4.2. Value Chain/Supply Chain of Global Plant Asset Management Market
5. Market Overview of Global Plant Asset Management Market
5.1. Introduction
5.2. Growth Drivers
5.3. Impact Analysis
5.4. Market Challenges
6. Market Trends
6.1. Introduction
6.2. Growth Trends
6.3. Impact Analysis
7. Global Plant Asset Management Market, by Offering
7.1. Introduction
7.2. Software
7.2.1. Market Estimates & Forecast, 2018–2023
7.2.2. Market Estimates & Forecast, by Region, 2018–2023
7.3. Services
7.3.1.1. Market Estimates & Forecast, 2018–2023
7.3.1.2. Market Estimates & Forecast, by Region, 2018–2023
8. Global Plant Asset Management Market, by Deployment
8.1. Introduction
8.2. Offline Deployment
8.2.1. Market Estimates & Forecast, 2018–2023
8.2.2. Market Estimates & Forecast, by Region, 2018–2023
8.3. Cloud Deployment
8.3.1.1. Market Estimates & Forecast, 2018–2023
8.3.1.2. Market Estimates & Forecast, by Region, 2018–2023
9. Global Plant Asset Management Market, by Asset Type
9.1. Introduction
9.2. Production Assets
9.2.1. Market Estimates & Forecast, 2018–2023
9.2.2. Market Estimates & Forecast, by Region, 2018–2023
9.3. Automation Assets
9.3.1.1. Market Estimates & Forecast, 2018–2023
9.3.1.2. Market Estimates & Forecast, by Region, 2018–2023
10. Global Plant Asset Management Market, by End-User Industry
10.1. Introduction
10.2. Chemical
10.2.1.1. Market Estimates & Forecast, 2018–2023
10.2.1.2. Market Estimates & Forecast, by Region, 2018–2023
10.3. Energy and Power
10.3.1.1. Market Estimates & Forecast, 2018–2023
10.3.1.2. Market Estimates & Forecast, by Region, 2018–2023
10.4. Food and Beverages
10.4.1.1. Market Estimates & Forecast, 2018–2023
10.4.1.2. Market Estimates & Forecast, by Region, 2018–2023
10.5. Oil and Gas
10.5.1.1. Market Estimates & Forecast, 2018–2023
10.5.1.2. Market Estimates & Forecast, by Region, 2018–2023
10.6. Pharmaceutical
10.6.1.1. Market Estimates & Forecast, 2018–2023
10.6.1.2. Market Estimates & Forecast by Region, 2018-2023
10.7. Aerospace and Defense
10.7.1.1. Market Estimates & Forecast, 2018–2023
10.7.1.2. Market Estimates & Forecast, by Region, 2018–2023
10.8. Automotive
10.8.1.1. Market Estimates & Forecast, 2018–2023
10.8.1.2. Market Estimates & Forecast, by Region, 2018–2023
11. Global Plant Asset Management Market, by Region
11.1. Introduction
11.2. North America
11.2.1. Market Estimates & Forecast, by Country 2018–2023
11.2.2. Market Estimates & Forecast, by Offering, 2018–2023
11.2.3. Market Estimates & Forecast, by Deployment, 2018–2023
11.2.4. Market Estimates & Forecast, by Asset Type, 2018–2023
11.2.5. Market Estimates & Forecast, by End-User Industry, 2018–2023
11.2.6. US
11.2.6.1. Market Estimates & Forecast, by Offering, 2018–2023
11.2.6.2. Market Estimates & Forecast, by Deployment, 2018–2023
11.2.6.3. Market Estimates & Forecast, by Asset Type, 2018–2023
11.2.6.4. Market Estimates & Forecast, by End-User Industry, 2018–2023
11.2.7. Mexico
11.2.7.1. Market Estimates & Forecast, by Offering, 2018–2023
11.2.7.2. Market Estimates & Forecast, by Deployment, 2018–2023
11.2.7.3. Market Estimates & Forecast, by Asset Type, 2018–2023
11.2.7.4. Market Estimates & Forecast, by End-User Industry, 2018–2023
11.2.8. Canada
11.2.8.1. Market Estimates & Forecast, by Offering, 2018–2023
11.2.8.2. Market Estimates & Forecast, by Deployment, 2018–2023
11.2.8.3. Market Estimates & Forecast, by Asset Type, 2018–2023
11.2.8.4. Market Estimates & Forecast, by End-User Industry, 2018–2023
11.3. Europe
11.3.1. Market Estimates & Forecast, by Country 2018–2023
11.3.2. Market Estimates & Forecast, by Offering, 2018–2023
11.3.3. Market Estimates & Forecast, by Deployment, 2018–2023
11.3.4. Market Estimates & Forecast, by Asset Type, 2018–2023
11.3.5. Market Estimates & Forecast, by End-User Industry, 2018–2023
11.3.6. Germany
11.3.6.1. Market Estimates & Forecast, by Offering, 2018–2023
11.3.6.2. Market Estimates & Forecast, by Deployment, 2018–2023
11.3.6.3. Market Estimates & Forecast, by Asset Type, 2018–2023
11.3.6.4. Market Estimates & Forecast, by End-User Industry, 2018–2023
11.3.7. France
11.3.7.1. Market Estimates & Forecast, by Offering, 2018–2023
11.3.7.2. Market Estimates & Forecast, by Deployment, 2018–2023
11.3.7.3. Market Estimates & Forecast, by Asset Type, 2018–2023
11.3.7.4. Market Estimates & Forecast, by End-User Industry, 2018–2023
11.3.8. UK
11.3.8.1. Market Estimates & Forecast, by Offering, 2018–2023
11.3.8.2. Market Estimates & Forecast, by Deployment, 2018–2023
11.3.8.3. Market Estimates & Forecast, by Asset Type, 2018–2023
11.3.8.4. Market Estimates & Forecast, by End-User Industry, 2018–2023
11.4. Asia-Pacific
11.4.1. Market Estimates & Forecast, by Country 2018–2023
11.4.2. Market Estimates & Forecast, by Offering, 2018–2023
11.4.3. Market Estimates & Forecast, by Deployment, 2018–2023
11.4.4. Market Estimates & Forecast, by Asset Type, 2018–2023
11.4.5. Market Estimates & Forecast, by End-User Industry, 2018–2023
11.4.6. China
11.4.6.1. Market Estimates & Forecast, by Offering, 2018–2023
11.4.6.2. Market Estimates & Forecast, by Deployment, 2018–2023
11.4.6.3. Market Estimates & Forecast, by Asset Type, 2018–2023
11.4.6.4. Market Estimates & Forecast, by End-User Industry, 2018–2023
11.4.7. India
11.4.7.1. Market Estimates & Forecast, by Offering, 2018–2023
11.4.7.2. Market Estimates & Forecast, by Deployment, 2018–2023
11.4.7.3. Market Estimates & Forecast, by Asset Type, 2018–2023
11.4.7.4. Market Estimates & Forecast, by End-User Industry, 2018–2023
11.4.8. Japan
11.4.8.1. Market Estimates & Forecast, by Offering, 2018–2023
11.4.8.2. Market Estimates & Forecast, by Deployment, 2018–2023
11.4.8.3. Market Estimates & Forecast, by Asset Type, 2018–2023
11.4.8.4. Market Estimates & Forecast, by End-User Industry, 2018–2023
11.4.9. Rest of Asia-Pacific
11.4.9.1. Market Estimates & Forecast, by Offering, 2018–2023
11.4.9.2. Market Estimates & Forecast, by Deployment, 2018–2023
11.4.9.3. Market Estimates & Forecast, by Asset Type, 2018–2023
11.4.9.4. Market Estimates & Forecast, by End-User Industry, 2018–2023
11.5. Rest of the World
11.5.1. Market Estimates & Forecast, by Country 2018–2023
11.5.2. Market Estimates & Forecast, by Offering, 2018–2023
11.5.3. Market Estimates & Forecast, by Deployment, 2018–2023
11.5.4. Market Estimates & Forecast, by Asset Type, 2018–2023
11.5.5. Market Estimates & Forecast, by End-User Industry, 2018–2023
11.5.6. Middle East & Africa
11.5.6.1. Market Estimates & Forecast, by Offering, 2018–2023
11.5.6.2. Market Estimates & Forecast, by Deployment, 2018–2023
11.5.6.3. Market Estimates & Forecast, by Asset Type, 2018–2023
11.5.6.4. Market Estimates & Forecast, by End-User Industry, 2018–2023
11.5.7. Latin Countries
11.5.7.1. Market Estimates & Forecast, by Offering, 2018–2023
11.5.7.2. Market Estimates & Forecast, by Deployment, 2018–2023
11.5.7.3. Market Estimates & Forecast, by Asset Type, 2018–2023
11.5.7.4. Market Estimates & Forecast, by End-User Industry, 2018–2023
12. Company Profiles
12.1. General Electric Co.
12.1.1. Company Overview
12.1.2. Product/Business Segment Overview
12.1.3. Financial Updates
12.1.4. Key Developments
12.2. Endress+Hauser Management AG
12.2.1. Company Overview
12.2.2. Product/Business Segment Overview
12.2.3. Financial Updates
12.2.4. Key Developments
12.3. Rockwell Automation, Inc.
12.3.1. Company Overview
12.3.2. Product/Business Segment Overview
12.3.3. Financial Updates
12.3.4. Key Developments
12.4. Honeywell International, Inc.
12.4.1. Company Overview
12.4.2. Product/Business Segment Overview
12.4.3. Financial Updates
12.4.4. Key Developments
12.5. Siemens AG
12.5.1. Company Overview
12.5.2. Product/Business Segment Overview
12.5.3. Financial Updates
12.5.4. Key Developments
12.6. Yokogawa Electric Corporation
12.6.1. Company Overview
12.6.2. Product/Business Segment Overview
12.6.3. Financial Updates
12.6.4. Key Developments
12.7. Dassault Systèmes
12.7.1. Company Overview
12.7.2. Product/Business Segment Overview
12.7.3. Financial Updates
12.7.4. Key Developments
12.8. Emerson Electric Company
12.8.1. Company Overview
12.8.2. Product/Business Segment Overview
12.8.3. Financial Updates
12.8.4. Key Developments
12.9. IBM Corporation
12.9.1. Company Overview
12.9.2. Product/Business Segment Overview
12.9.3. Financial Updates
12.9.4. Key Developments
12.10. Hitachi Ltd.
12.10.1. Company Overview
12.10.2. Product/Business Segment Overview
12.10.3. Financial Updates
12.10.4. Key Developments
13. Conclusion
LIST OF TABLES
Table1 Global Plant Asset Management Market, By Country, 2018-2023
Table2 North America: Plant Asset Management Market, By Country, 2018–2023
Table3 Europe: Plant Asset Management Market, By Country, 2018–2023
Table4 Asia-Pacific: Plant Asset Management Market, By Country, 2018–2023
Table5 Latin America: Plant Asset Management Market, By Country, 2018–2023
Table6 North America: Plant Asset Management Market, By Country
Table7 North America: Plant Asset Management Market, By Offering
Table8 North America: Plant Asset Management Market, By Deployment
Table9 North America: Plant Asset Management Market, By Asset Type
Table10 North America: Plant Asset Management Market, By End-User Industry
Table11 Europe: Plant Asset Management Market, By Country
Table12 Europe: Plant Asset Management Market, By Offering
Table13 Europe: Plant Asset Management Market, By Deployment
Table14 Europe: Plant Asset Management Market, By Asset Type
Table15 Europe: Plant Asset Management Market, By End-User Industry
Table16 Asia-Pacific: Plant Asset Management Market, By Country
Table17 Asia-Pacific Plant Asset Management Market, By Offering
Table18 Asia-Pacific: Plant Asset Management Market, By Deployment
Table19 Asia-Pacific: Plant Asset Management Market, By Asset Type
Table20 Asia-Pacific Plant Asset Management Market, By End-User Industry
Table21 Middle East & Africa: Plant Asset Management Market, By Country
Table22 Middle East & Africa: Plant Asset Management Market, By Offering
Table23 Middle East & Africa: Plant Asset Management Market, By Deployment
Table24 Middle East & Africa: Plant Asset Management Market, By Asset Type
Table25 Middle East & Africa: Plant Asset Management Market, By End-User Industry
Table26 Latin America: Plant Asset Management Market, By Country
Table27 Latin America: Plant Asset Management Market, By Offering
Table28 Latin America: Plant Asset Management Market, By Deployment
Table29 Latin America: Plant Asset Management Market, By Asset Type
Table30 Latin America: Plant Asset Management Market, By End-User Industry
LIST OF FIGURES
Figure 1 Global Plant Asset Management Market segmentation
Figure 2 Forecast Methodology
Figure 3 Porter’s Five Forces Analysis of Global Plant Asset Management Market
Figure 4 Value Chain of Global Plant Asset Management Market
Figure 5 Share of Plant Asset Management Market in 2018, by country (in %)
Figure 6 Global Plant Asset Management Market, 2018–2023
Figure 7 Share of Global Plant Asset Management Market by Industry, 2018–2023
Figure 8 Global Plant Asset Management Market Size, by Offering, 2018
Figure 9 Share of Global Plant Asset Management Market, by Offering, 2018–2023
Figure 10 Global Plant Asset Management Market Size, by Deployment, 2018
Figure 11 Share of Global Plant Asset Management Market, by Deployment, 2018–2023
Figure 12 Global Plant Asset Management Market Size, by Asset Type, 2018
Figure 13 Share of Global Plant Asset Management Market, by Asset Type, 2018–2023
Figure 14 Global Plant Asset Management Market Size, by End-User Industry, 2018
Figure 15 Share of Global Plant Asset Management Market, by End-User Industry, 2018–2023