• Cat-intel
  • MedIntelliX
  • Resources
  • About Us
  • Hero Background
    English
    Chinese
    French
    Japanese
    Korean
    German
    Spanish

    Used Bike Market Trends

    ID: MRFR/AM/10740-HCR
    128 Pages
    Aarti Dhapte
    October 2025

    Used Bike Market Research Report By Bike Type (Standard, Sport, Cruiser, Touring, Dual-Sport), By Condition (Certified Pre-Owned, Good Condition, Fair Condition, As-Is), By Engine Type (Internal Combustion Engine, Electric, Hybrid), By Price Range (Below $1,000, $1,000 - $5,000, $5,000 - $10,000, Above $10,000) and By Regional (North America, Europe, South America, Asia Pacific, Middle East and...

    Share:
    Download PDF ×

    We do not share your information with anyone. However, we may send you emails based on your report interest from time to time. You may contact us at any time to opt-out.

    Used Bike Market Infographic
    $ 4,950.0
    $ 5,950.0
    $ 7,250.0

    Market Trends

    Key Emerging Trends in the Used Bike Market

    In a used bike market which is characterised by dynamism, companies employ numerous market share positioning strategies which help them to retain and boost their positions within the industry. One of the most widely used strategies is "cost leadership" where businesses aim at being priced lower than their competitors. This can attract customers hunting for a good bargain and later on the company is regarded as a cheap competitor. Nevertheless, being a cost leader generally necessitates lean production along with supplier negotiations and planning the logistics in an economical manner to keep the costs at a minimum.

    The third approach is differentiation, where the used bike companies are trying to establish their bikes with a difference in quality, features or the branding. Marketers highlight the aspects like resilience and design or unique agreements with world-famous brands in order to make the product more appreciated and so its value is higher. This strategy aims at the consumers who may not mind paying a premium for the features they value.

    In the used bike market as well being such as niche segments too plays a big role. Firms could decide to concentrate on a specific kind of bikes, for example, retro bikes, top performance bikes or e-bikes. This is beneficial for them because they can actually satisfy a community that is distinct in its preferences. Positioning one’s brand in the niche provides the base to create a loyal audience and moderating the effects deriving from the competition in wider markets.

    Moreover, geographical or regional placement is a key factor to determine success in the used bike market. Firms may decide to focus their business in locations with particular demographic characteristics, climate or favourable to their product on culture. Knowing the peculiarities of the local region is a necessary step for businesses to adapt their product and marketing approaches to the local inhabitants. Through such a localized commitment, you can foster deeper customer connection, as well as build a real brand loyalty.

    Moreover, some businesses tend to impose a customer-focused policy by furnishing quality services, warranty programs, or customer loyalty benefits. By striving for customer retention, businesses target ongoing connections and loyal customers who come back. The development of positive word-of-mouth, as well as customer reviews that are written in a positive manner become strategic in this plan and create a brand that is attractive to potential buyers.

    The collaborative approach also involves that companies work together through partnerships, joint ventures, or alliances. They would need partners like dealerships, repair shops or online platform so that their customer reach is multifaceted and they are able to provide complete solution to the customer. Such cooperations can help in creating a bigger network, higher visibility, and competitive edge in the small used bikes market niche.

    Market Summary

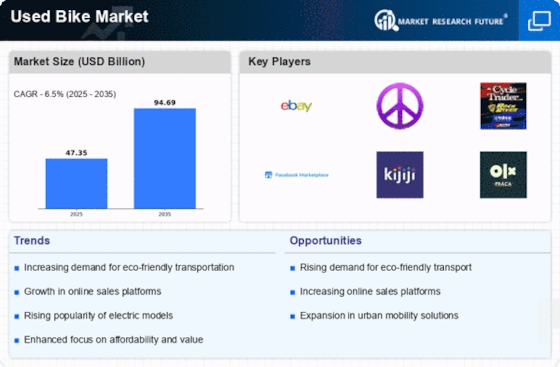
    As per MRFR analysis, the Used Bike Market Size was estimated at 47.35 USD Billion in 2024. The Used Bike industry is projected to grow from 50.43 USD Billion in 2025 to 94.69 USD Billion by 2035, exhibiting a compound annual growth rate (CAGR) of 6.5 during the forecast period 2025 - 2035.

    Key Market Trends & Highlights

    The Used Bike Market is experiencing a dynamic shift driven by evolving consumer preferences and technological advancements.

    • The rise of online marketplaces is transforming how consumers buy and sell used bikes, particularly in North America.
    • Sustainability and eco-consciousness are increasingly influencing consumer choices, especially among younger demographics in the Asia-Pacific region.
    • Diverse consumer preferences are evident, with the Standard segment remaining the largest while the Sport segment is rapidly gaining traction.
    • Economic factors and urbanization are key drivers of demand, as more individuals seek affordable and efficient mobility solutions.

    Market Size & Forecast

    2024 Market Size 47.35 (USD Billion)
    2035 Market Size 94.69 (USD Billion)
    CAGR (2025 - 2035) 6.5%
    Largest Regional Market Share in 2024 North America

    Major Players

    <p>eBay (US), Craigslist (US), Cycle Trader (US), Facebook Marketplace (US), Kijiji (CA), OLX (IN), Bikewale (IN), BikeExchange (AU), AutoTrader (UK), Gumtree (AU)</p>

    Market Trends

    The Used Bike Market is currently experiencing a dynamic evolution, driven by various factors that influence consumer preferences and purchasing behaviors. As urbanization continues to rise, individuals are increasingly seeking cost-effective and environmentally friendly transportation options. This shift in mindset appears to be fostering a growing interest in pre-owned motorcycles, which are perceived as more accessible and economical compared to new models. Additionally, the proliferation of online platforms for buying and selling used bikes is enhancing market visibility, allowing consumers to make informed decisions based on a wider array of choices. Moreover, the increasing focus on sustainability is likely to play a pivotal role in shaping the future of the Used Bike Market. As awareness of environmental issues grows, many consumers are opting for used bikes as a means to reduce their carbon footprint. This trend suggests a potential shift in the demographic of buyers, with younger generations showing a preference for sustainable practices. Consequently, the market may witness a diversification of offerings, catering to a broader audience with varying needs and preferences. Overall, the Used Bike Market is poised for continued growth, driven by evolving consumer attitudes and technological advancements in the buying process.

    Rise of Online Marketplaces

    The emergence of digital platforms for buying and selling used bikes is transforming the market landscape. Consumers now have access to a vast array of options, enabling them to compare prices and features easily. This trend is likely to enhance transparency and foster competition among sellers.

    Sustainability and Eco-Consciousness

    A growing emphasis on environmental sustainability is influencing consumer choices in the Used Bike Market. Many individuals are increasingly aware of their ecological impact and are opting for pre-owned motorcycles as a more sustainable transportation alternative, potentially reshaping buyer demographics.

    Diverse Consumer Preferences

    The Used Bike Market is witnessing a diversification of consumer preferences, with various segments emerging based on lifestyle and usage needs. This trend indicates that sellers may need to adapt their offerings to cater to a wider range of buyers, from casual riders to enthusiasts.

    The Global Used Bike Market appears to be experiencing a robust demand surge, driven by shifting consumer preferences towards sustainable transportation options and economic considerations.

    U.S. Department of Transportation

    Used Bike Market Market Drivers

    Environmental Awareness

    Growing environmental awareness is reshaping consumer attitudes towards transportation, significantly impacting the Used Bike Market. As individuals become more conscious of their carbon footprints, many are opting for used bikes as a sustainable alternative to cars. The environmental benefits of cycling, including reduced emissions and lower resource consumption, resonate with eco-conscious consumers. Data indicates that the used bike segment has seen a notable increase in sales, with a reported 20% rise attributed to sustainability concerns. This trend suggests that as awareness of climate change and environmental issues continues to rise, the demand for used bikes will likely grow, further solidifying their position within the Used Bike Market.

    Technological Advancements

    Technological advancements are significantly impacting the Used Bike Market, as innovations in bike design and manufacturing enhance the appeal of pre-owned models. The introduction of advanced safety features, fuel-efficient engines, and lightweight materials in newer models has created a demand for used bikes that incorporate these technologies. Consumers are increasingly attracted to models that offer modern features at a reduced price. Furthermore, the rise of digital platforms for buying and selling used bikes has streamlined the purchasing process, making it more accessible. Data indicates that online sales of used bikes have surged, with a reported increase of 30% in transactions facilitated through digital marketplaces. This technological evolution is likely to continue shaping consumer preferences within the Used Bike Market.

    Economic Factors Driving Demand

    The Used Bike Market is influenced by various economic factors that drive consumer demand. As disposable incomes fluctuate, individuals often seek cost-effective transportation solutions. In recent years, the average price of new motorcycles has risen, prompting consumers to consider used options as a viable alternative. Additionally, the increasing cost of fuel has led many to explore more economical modes of transport, such as used bikes. According to recent data, the used bike segment has seen a growth rate of approximately 5% annually, indicating a shift in consumer behavior towards more affordable and sustainable transportation. This trend suggests that economic conditions will continue to play a pivotal role in shaping the dynamics of the Used Bike Market.

    Urbanization and Mobility Trends

    Urbanization is a key driver of the Used Bike Market, as more individuals move to urban areas where traditional transportation options may be less practical. The increasing population density in cities has led to a greater demand for compact and efficient modes of transport. Used bikes offer a convenient solution for navigating congested urban environments, appealing to commuters seeking to avoid traffic and reduce travel time. Additionally, the trend towards micro-mobility solutions, such as electric bikes and scooters, has further fueled interest in the used bike segment. Recent statistics suggest that urban areas have experienced a 15% increase in used bike sales, reflecting a shift in transportation preferences among city dwellers. This urban-centric demand is expected to persist, influencing the trajectory of the Used Bike Market.

    Changing Demographics and Lifestyle Choices

    Demographic shifts and evolving lifestyle choices are pivotal factors influencing the Used Bike Market. Younger generations, particularly millennials and Gen Z, are increasingly prioritizing experiences over possessions, leading to a rise in demand for alternative transportation options. This demographic is more inclined to embrace cycling as a lifestyle choice, driven by health, fitness, and environmental considerations. Recent surveys indicate that approximately 40% of young adults express interest in purchasing a used bike, reflecting a cultural shift towards active living. Additionally, the trend of remote work has altered commuting patterns, with many individuals seeking flexible transportation solutions. This changing demographic landscape is likely to continue shaping the dynamics of the Used Bike Market.

    Market Segment Insights

    By Type: Standard (Largest) vs. Sport (Fastest-Growing)

    <p>The used bike market is experiencing notable differentiation in segments, with Standard bikes commanding the largest market share. This segment appeals to a broad range of consumers due to their versatility, comfort, and cost-effectiveness, making them the preferred choice for everyday riding. Conversely, the Sport segment is emerging rapidly, attracting enthusiasts and younger riders looking for performance and agility. Although it captures a smaller share compared to Standard bikes, its appeal is growing thanks to increasing interest in performance-oriented biking, resulting in a spike in sales.</p>

    <p>Standard (Dominant) vs. Sport (Emerging)</p>

    <p>Standard bikes dominate the used bike market due to their adaptability and suitability for various riding conditions. They are popular among new riders and commuters alike, given their comfort and user-friendly nature. In contrast, Sport bikes are rapidly gaining traction, particularly among younger consumers drawn to their high-speed capability and sleek design. The sport segment appeals to those seeking thrilling rides and is increasingly supported by a growing community of enthusiasts and events tailored to performance bikes. As such, the market is witnessing a shift where both segments play significant roles, yet their consumer bases and motivations differ considerably.</p>

    By Condition: Certified Pre-Owned (Largest) vs. Good Condition (Fastest-Growing)

    <p>In the Used Bike Market, the Condition segment showcases a diverse range of offerings, with Certified Pre-Owned bikes holding the largest market share. This segment stands out due to its rigorous inspection and warranty provisions, making it a preferred choice among consumers who prioritize quality assurance. Following closely, Good Condition bikes are gaining traction as consumers become more value-conscious, specifically seeking reliable options at competitive prices. The growth trends in this segment are largely driven by the increasing awareness of sustainability and economic considerations. As consumers look for cost-effective mobility solutions, the demand for Fair Condition and As-Is bikes is also growing, albeit at a slower rate compared to the Certified Pre-Owned and Good Condition segments. This shift is reflective of a broader trend towards responsible purchasing in the used bike market, influenced by environmental concerns and the rising popularity of cycling as a primary mode of transport.</p>

    <p>Certified Pre-Owned (Dominant) vs. Good Condition (Emerging)</p>

    <p>The Certified Pre-Owned segment stands as the dominant force within the Used Bike Market, primarily due to its appeal for quality-conscious buyers. These bikes undergo extensive checks and come with warranties, providing peace of mind and a higher resale value. This category is well-established and attracts customers who seek reliability and performance, hence reinforcing its strong presence in the market. On the other hand, Good Condition bikes cater to a growing demographic that values affordability without compromising too much on quality. Positioned as an emerging segment, they attract budget-conscious consumers and offer a wider range of options, balancing performance and price. As these segments evolve, the interplay between premium offerings and budget choices shapes the market landscape, driving awareness and choice among buyers.</p>

    By Engine Type: Internal Combustion Engine (Largest) vs. Electric (Fastest-Growing)

    <p>The Used Bike Market has seen a diverse distribution in engine types, where Internal Combustion Engine (ICE) bikes hold a substantial market share, reflecting their longstanding appeal among consumers. Electric bikes, on the other hand, are emerging rapidly as a significant segment, especially with the evolving technological advancements and rising environmental concern driving their adoption. As consumers become more environmentally conscious and seek cost-effective alternatives, the market is shifting toward electric solutions, transforming traditional preferences.</p>

    <p>Engine Type: Internal Combustion Engine (Dominant) vs. Electric (Emerging)</p>

    <p>Internal Combustion Engine bikes continue to dominate the used bike market due to a robust infrastructure supporting fuel-based transport and established consumer preferences. These bikes often offer longer ranges and more availability in the secondary market. In contrast, Electric bikes represent an emerging trend fueled by increasing environmental awareness and favorable government policies promoting green transport. As battery technology improves, electric bikes are becoming more efficient and affordable, appealing to a growing segment of eco-conscious consumers. This shift reflects a broader trend towards sustainability in transportation, with electric bikes being recognized for their potential to reduce urban pollution and enhance urban mobility.</p>

    By Price Range: $1,000 - $5,000 (Largest) vs. Below $1,000 (Fastest-Growing)

    <p>In the used bike market, the price range segment exhibits diverse preferences among consumers. The segment priced between $1,000 - $5,000 holds the largest market share, appealing to a wide array of buyers due to a balance of quality and affordability. Meanwhile, the segment below $1,000 is experiencing rapid growth, driven by budget-conscious consumers and a rising interest in affordable transportation solutions. As economic conditions fluctuate, more individuals are seeking cost-effective options, contributing to the increasing popularity of lower-priced bikes. The demand for pre-owned bikes in this category is fostered by the allure of lower entry costs and a growing awareness of sustainability.</p>

    <p>$1,000 - $5,000 (Dominant) vs. Below $1,000 (Emerging)</p>

    <p>The price range of $1,000 - $5,000 in the used bike market stands as the dominant segment, catering to a diverse consumer base that values quality and performance at a mid-range price. Bikes in this category typically offer a blend of reliability and features, attracting both recreational riders and commuters. In contrast, the below $1,000 segment is emerging as a go-to option for budget-conscious buyers, especially first-time cyclists. These bikes generally focus on basic functionality and affordability, appealing to a rapidly expanding demographic that prioritizes cost over brand or premium features. The combination of affordability and increased access to biking trends positions the lower segment for future growth.</p>

    Get more detailed insights about Used Bike Market Research Report – Forecast till 2035

    Regional Insights

    North America : Market Leader in Used Bikes

    The North American used bike market is driven by increasing consumer interest in sustainable transportation and the rising costs of new bikes. The U.S. holds the largest market share at approximately 70%, followed by Canada at 15%. Regulatory support for eco-friendly transportation options further fuels this growth, with various states implementing incentives for bike purchases. Key players like eBay, Craigslist, and Cycle Trader dominate the landscape, providing extensive platforms for buying and selling used bikes. The competitive environment is characterized by a mix of online marketplaces and local dealers, ensuring a diverse range of options for consumers. The presence of social media platforms like Facebook Marketplace also enhances visibility and accessibility for sellers and buyers alike.

    Europe : Emerging Market with Regulations

    Europe's used bike market is experiencing significant growth, driven by increasing urbanization and a shift towards sustainable transport solutions. Germany leads the market with a share of around 30%, followed by the UK at 20%. Regulatory frameworks promoting cycling as a green transport alternative are key growth catalysts, with various EU initiatives aimed at reducing carbon emissions. Countries like the Netherlands and France are also pivotal, with a strong culture of cycling and established platforms like AutoTrader and Gumtree facilitating transactions. The competitive landscape is marked by both online and offline players, with a growing trend towards digital marketplaces. The presence of established brands and local dealers ensures a robust supply chain for used bikes.

    Asia-Pacific : Rapid Growth in Emerging Markets

    The Asia-Pacific region is witnessing a rapid expansion in the used bike market, driven by increasing disposable incomes and urbanization. India holds the largest market share at approximately 40%, followed by Australia at 15%. The growing popularity of cycling for both commuting and leisure activities is a significant demand driver, supported by government initiatives promoting cycling infrastructure. Key players like OLX and Bikewale are leading the market, providing platforms that cater to the diverse needs of consumers. The competitive landscape is characterized by a mix of online marketplaces and local dealers, ensuring a wide range of options for buyers. The increasing focus on eco-friendly transportation solutions further enhances the market's growth potential.

    Middle East and Africa : Untapped Potential in Cycling

    The Middle East and Africa region presents an untapped potential in the used bike market, driven by increasing awareness of cycling as a sustainable transport option. South Africa leads the market with a share of around 25%, followed by Kenya at 10%. The growing interest in outdoor activities and government initiatives promoting cycling infrastructure are key growth drivers in this region. Countries like Kenya and South Africa are witnessing a rise in local platforms for buying and selling used bikes, with a mix of online and offline players emerging. The competitive landscape is still developing, but the presence of key players is gradually increasing, providing consumers with more options and enhancing market accessibility.

    Key Players and Competitive Insights

    The Used Bike Market is currently characterized by a dynamic competitive landscape, driven by increasing consumer demand for affordable transportation options and a growing emphasis on sustainability. Key players such as eBay (US), Facebook Marketplace (US), and Cycle Trader (US) are strategically positioned to leverage their extensive digital platforms to enhance user experience and streamline transactions. eBay (US) has focused on integrating advanced analytics to personalize user interactions, while Facebook Marketplace (US) capitalizes on its vast social network to facilitate peer-to-peer sales. Cycle Trader (US) emphasizes a comprehensive inventory of bikes, catering to both individual sellers and dealerships, thereby shaping a competitive environment that prioritizes accessibility and user engagement.

    The market structure appears moderately fragmented, with numerous local and regional players complementing the larger platforms. Key business tactics include optimizing supply chains and localizing services to meet regional demands. For instance, companies are increasingly adopting localized marketing strategies to resonate with specific demographics, which enhances their competitive edge. This collective influence of major players fosters a competitive atmosphere where innovation and customer service are paramount.

    In August 2025, eBay (US) announced a partnership with a leading logistics provider to enhance its delivery capabilities for used bikes. This strategic move is likely to improve customer satisfaction by reducing delivery times and costs, thereby making eBay a more attractive option for buyers. The integration of logistics solutions not only streamlines operations but also positions eBay to capture a larger market share in the used bike segment.

    In September 2025, Facebook Marketplace (US) introduced a new feature that allows users to filter listings based on environmental impact, promoting sustainable choices among consumers. This initiative reflects a growing trend towards eco-conscious purchasing and aligns with broader societal shifts towards sustainability. By facilitating informed purchasing decisions, Facebook Marketplace (US) enhances its brand image and attracts a demographic increasingly concerned with environmental issues.

    In July 2025, Cycle Trader (US) launched an innovative mobile app designed to simplify the buying and selling process for used bikes. This app incorporates augmented reality features that allow users to visualize bikes in their environment before purchase. Such technological advancements not only enhance user engagement but also signify a shift towards digital transformation in the market, catering to tech-savvy consumers who prioritize convenience and interactivity.

    As of October 2025, the competitive trends in the Used Bike Market are increasingly defined by digitalization, sustainability, and the integration of artificial intelligence. Strategic alliances among key players are shaping the landscape, fostering innovation and enhancing customer experiences. The evolution of competitive differentiation appears to be shifting from traditional price-based competition towards a focus on technological advancements, supply chain reliability, and sustainable practices. This transition suggests that companies that prioritize innovation and customer-centric strategies are likely to thrive in the evolving market.

    Key Companies in the Used Bike Market market include

    Industry Developments

    • Q2 2025: Latest data from SSI shows bright spot on used market as new unit sales fall In April 2025, used powersports vehicle sales in North America increased by 2.04% year-over-year, with notable gains in UTVs, dual sports, touring, and motocross bikes, highlighting ongoing consumer demand for pre-owned units.

    Future Outlook

    Used Bike Market Future Outlook

    <p>The Used Bike Market is projected to grow at a 6.5% CAGR from 2024 to 2035, driven by increasing urbanization, sustainability trends, and rising fuel prices.</p>

    New opportunities lie in:

    • <p>Expansion of online marketplaces for used bikes</p>
    • <p>Development of subscription-based bike services</p>
    • <p>Integration of smart technology in used bikes</p>

    <p>By 2035, the Used Bike Market is expected to be robust, reflecting evolving consumer preferences and innovative business models.</p>

    Market Segmentation

    Used Bike Market Type Outlook

    • Standard
    • Sport
    • Cruiser
    • Touring
    • Dual-Sport

    Used Bike Market Condition Outlook

    • Certified Pre-Owned
    • Good Condition
    • Fair Condition
    • As-Is

    Used Bike Market Engine Type Outlook

    • Internal Combustion Engine
    • Electric
    • Hybrid

    Used Bike Market Price Range Outlook

    • Below $1,000
    • $1,000 - $5,000
    • $5,000 - $10,000
    • Above $10,000

    Report Scope

    MARKET SIZE 202447.35(USD Billion)
    MARKET SIZE 202550.43(USD Billion)
    MARKET SIZE 203594.69(USD Billion)
    COMPOUND ANNUAL GROWTH RATE (CAGR)6.5% (2024 - 2035)
    REPORT COVERAGERevenue Forecast, Competitive Landscape, Growth Factors, and Trends
    BASE YEAR2024
    Market Forecast Period2025 - 2035
    Historical Data2019 - 2024
    Market Forecast UnitsUSD Billion
    Key Companies ProfiledMarket analysis in progress
    Segments CoveredMarket segmentation analysis in progress
    Key Market OpportunitiesGrowing demand for eco-friendly transportation options drives expansion in the Used Bike Market.
    Key Market DynamicsRising consumer preference for sustainable transportation fuels demand for used bikes amid shifting mobility trends.
    Countries CoveredNorth America, Europe, APAC, South America, MEA

    Market Highlights

    Author

    Aarti Dhapte
    Team Lead - Research

    She holds an experience of about 6+ years in market research and business consulting, working under the spectrum of information communication technology, telecommunications and semiconductor domains. aarti conceptualizes and implements a scalable business strategy and provides strategic leadership to the clients. her expertise lies in market estimation, competitive intelligence, pipeline analysis, customer assessment, etc.

    Leave a Comment

    Latest Comments

    John Doe
    john@example.com

    This is a great article! Really helped me understand the topic better.

    Posted on July 23, 2025, 10:15 AM
    Jane Smith
    jane@domain.com

    Thanks for sharing this. I’ve bookmarked it for later reference.

    Posted on July 22, 2025, 7:45 PM

    FAQs

    What is the current valuation of the Used Bike Market as of 2024?

    The Used Bike Market was valued at 47.35 USD Billion in 2024.

    What is the projected market size for the Used Bike Market by 2035?

    The market is projected to reach 94.69 USD Billion by 2035.

    What is the expected CAGR for the Used Bike Market during the forecast period 2025 - 2035?

    The expected CAGR for the Used Bike Market during 2025 - 2035 is 6.5%.

    Which segment of the Used Bike Market had the highest valuation in 2024?

    In 2024, the 'Good Condition' segment had the highest valuation at 15.0 USD Billion.

    What are the projected valuations for the Standard bike segment by 2035?

    The Standard bike segment is projected to reach 18.94 USD Billion by 2035.

    How does the valuation of Electric bikes compare to Internal Combustion Engine bikes in 2024?

    In 2024, Internal Combustion Engine bikes were valued at 30.0 USD Billion, while Electric bikes were valued at 10.0 USD Billion.

    What is the price range segment that is expected to grow the most by 2035?

    The '$5,000 - $10,000' price range segment is expected to grow significantly, reaching 35.0 USD Billion by 2035.

    Which key players dominate the Used Bike Market?

    Key players in the Used Bike Market include eBay, Craigslist, and Cycle Trader, among others.

    What is the valuation of the Certified Pre-Owned segment in 2024?

    The Certified Pre-Owned segment was valued at 7.1 USD Billion in 2024.

    What is the projected valuation for the Dual-Sport segment by 2035?

    The Dual-Sport segment is projected to reach 10.22 USD Billion by 2035.

    1. \r\n6. USED BIKE MARKET, BY BIKE TYPE (USD BILLION)
      1. \r\n6.1. Standard \r\n6.2. Sport
      2. \r\n6.3. Cruiser \r\n6.4.
      3. Touring \r\n6.5. Dual-Sport \r\n7.
    2. USED BIKE MARKET, BY CONDITION (USD BILLION) \r\n7.1. Certified
      1. Pre-Owned \r\n7.2. Good Condition \r\n7.3.
      2. Fair Condition \r\n7.4. As-Is
    3. \r\n8. USED BIKE MARKET, BY ENGINE TYPE (USD BILLION)
      1. \r\n8.1. Internal Combustion Engine \r\n8.2.
      2. Electric \r\n8.3. Hybrid \r\n9.
    4. USED BIKE MARKET, BY PRICE RANGE (USD BILLION) \r\n9.1. Below
      1. $1,000 \r\n9.2. $1,000 - $5,000 \r\n9.3.
      2. $5,000 - $10,000 \r\n9.4. Above $10,000
    5. \r\n10. USED BIKE MARKET, BY REGIONAL (USD BILLION)
      1. \r\n10.1. North America \r\n10.1.1. US
      2. \r\n10.1.2. Canada
      3. \r\n10.2. Europe \r\n10.2.1. Germany
      4. \r\n10.2.2. UK
      5. \r\n10.2.3. France \r\n10.2.4.
      6. Russia \r\n10.2.5. Italy
      7. \r\n10.2.6. Spain \r\n10.2.7.
      8. Rest of Europe \r\n10.3. APAC
      9. \r\n10.3.1. China \r\n10.3.2.
      10. India \r\n10.3.3. Japan
      11. \r\n10.3.4. South Korea
      12. \r\n10.3.5. Malaysia \r\n10.3.6.
      13. Thailand \r\n10.3.7. Indonesia
      14. \r\n10.3.8. Rest of APAC
      15. \r\n10.4. South America \r\n10.4.1.
      16. Brazil \r\n10.4.2. Mexico
      17. \r\n10.4.3. Argentina
      18. \r\n10.4.4. Rest of South America
      19. \r\n10.5. MEA \r\n10.5.1. GCC Countries
      20. \r\n10.5.2. South Africa
      21. \r\n10.5.3. Rest of MEA
      22. \r\n \r\n \r\n
      23. \r\n11. COMPETITIVE LANDSCAPE \r\n11.1.
      24. Overview \r\n11.2. Competitive Analysis
      25. \r\n11.3. Market share Analysis \r\n11.4.
      26. Major Growth Strategy in the Used Bike Market \r\n11.5.
      27. Competitive Benchmarking \r\n11.6. Leading Players
      28. in Terms of Number of Developments in the Used Bike Market \r\n11.7.
      29. Key developments and growth strategies \r\n11.7.1. New Product
      30. Launch/Service Deployment \r\n11.7.2.
      31. Merger & Acquisitions \r\n11.7.3.
      32. Joint Ventures \r\n11.8. Major
      33. Players Financial Matrix \r\n11.8.1. Sales and Operating
      34. Income \r\n11.8.2. Major Players R&D
      35. Expenditure. 2023 \r\n12.
      36. COMPANY PROFILES \r\n12.1. Craigslist \r\n12.1.1.
      37. Financial Overview \r\n12.1.2. Products
      38. Offered \r\n12.1.3. Key Developments
      39. \r\n12.1.4. SWOT Analysis
      40. \r\n12.1.5. Key Strategies
      41. \r\n12.2. Cycle Trader \r\n12.2.1. Financial
      42. Overview \r\n12.2.2. Products Offered
      43. \r\n12.2.3. Key Developments
      44. \r\n12.2.4. SWOT Analysis
      45. \r\n12.2.5. Key Strategies \r\n12.3.
      46. AutoTrader \r\n12.3.1. Financial Overview
      47. \r\n12.3.2. Products Offered
      48. \r\n12.3.3. Key Developments \r\n12.3.4.
      49. SWOT Analysis \r\n12.3.5. Key Strategies
      50. \r\n12.4. Yamaha \r\n12.4.1.
      51. Financial Overview \r\n12.4.2. Products
      52. Offered \r\n12.4.3. Key Developments
      53. \r\n12.4.4. SWOT Analysis
      54. \r\n12.4.5. Key Strategies
      55. \r\n12.5. Motorcycle.com \r\n12.5.1. Financial
      56. Overview \r\n12.5.2. Products Offered
      57. \r\n12.5.3. Key Developments
      58. \r\n12.5.4. SWOT Analysis
      59. \r\n12.5.5. Key Strategies \r\n12.6.
      60. eBay \r\n12.6.1. Financial Overview
      61. \r\n12.6.2. Products Offered \r\n12.6.3.
      62. Key Developments \r\n12.6.4. SWOT Analysis
      63. \r\n12.6.5. Key Strategies
      64. \r\n12.7. Ducati \r\n12.7.1.
      65. Financial Overview \r\n12.7.2. Products
      66. Offered \r\n12.7.3. Key Developments
      67. \r\n12.7.4. SWOT Analysis
      68. \r\n12.7.5. Key Strategies
      69. \r\n12.8. Kelley Blue Book \r\n12.8.1. Financial
      70. Overview \r\n12.8.2. Products Offered
      71. \r\n12.8.3. Key Developments
      72. \r\n12.8.4. SWOT Analysis
      73. \r\n12.8.5. Key Strategies \r\n12.9.
      74. Kawasaki \r\n12.9.1. Financial Overview
      75. \r\n12.9.2. Products Offered
      76. \r\n12.9.3. Key Developments \r\n12.9.4.
      77. SWOT Analysis \r\n12.9.5. Key Strategies
      78. \r\n12.10. Honda \r\n12.10.1.
      79. Financial Overview \r\n12.10.2. Products
      80. Offered \r\n12.10.3. Key Developments
      81. \r\n12.10.4. SWOT Analysis
      82. \r\n12.10.5. Key Strategies
      83. \r\n12.11. HarleyDavidson \r\n12.11.1. Financial
      84. Overview \r\n12.11.2. Products Offered
      85. \r\n12.11.3. Key Developments
      86. \r\n12.11.4. SWOT Analysis
      87. \r\n12.11.5. Key Strategies \r\n12.12.
      88. Facebook Marketplace \r\n12.12.1. Financial Overview
      89. \r\n12.12.2. Products Offered
      90. \r\n12.12.3. Key Developments
      91. \r\n12.12.4. SWOT Analysis \r\n12.12.5.
      92. Key Strategies \r\n12.13. Suzuki
      93. \r\n12.13.1. Financial Overview \r\n12.13.2.
      94. Products Offered \r\n12.13.3. Key Developments
      95. \r\n12.13.4. SWOT Analysis
      96. \r\n12.13.5. Key Strategies
      97. \r\n12.14. Bikesure \r\n12.14.1. Financial
      98. Overview \r\n12.14.2. Products Offered
      99. \r\n12.14.3. Key Developments
      100. \r\n12.14.4. SWOT Analysis
      101. \r\n12.14.5. Key Strategies \r\n12.15.
      102. BMW Motorrad \r\n12.15.1. Financial Overview
      103. \r\n12.15.2. Products Offered
      104. \r\n12.15.3. Key Developments
      105. \r\n12.15.4. SWOT Analysis \r\n12.15.5.
      106. Key Strategies \r\n13.
      107. APPENDIX \r\n13.1. References \r\n13.2.
      108. Related Reports \r\nLIST OF TABLES\r\n \r\nTABLE
    6. LIST OF ASSUMPTIONS \r\nTABLE 2. NORTH AMERICA USED BIKE
    7. MARKET SIZE ESTIMATES & FORECAST, BY BIKE TYPE, 2019-2035 (USD BILLIONS)
      1. \r\nTABLE 3. NORTH AMERICA USED BIKE MARKET SIZE ESTIMATES &
      2. FORECAST, BY CONDITION, 2019-2035 (USD BILLIONS) \r\nTABLE
    8. NORTH AMERICA USED BIKE MARKET SIZE ESTIMATES & FORECAST, BY ENGINE TYPE,
    9. BIKE MARKET SIZE ESTIMATES & FORECAST, BY PRICE RANGE, 2019-2035 (USD BILLIONS)
      1. \r\nTABLE 6. NORTH AMERICA USED BIKE MARKET SIZE ESTIMATES &
      2. FORECAST, BY REGIONAL, 2019-2035 (USD BILLIONS) \r\nTABLE
    10. US USED BIKE MARKET SIZE ESTIMATES & FORECAST, BY BIKE TYPE, 2019-2035 (USD
      1. BILLIONS) \r\nTABLE 8. US USED BIKE MARKET SIZE ESTIMATES
      2. & FORECAST, BY CONDITION, 2019-2035 (USD BILLIONS) \r\nTABLE
    11. US USED BIKE MARKET SIZE ESTIMATES & FORECAST, BY ENGINE TYPE, 2019-2035
      1. (USD BILLIONS) \r\nTABLE 10. US USED BIKE MARKET SIZE ESTIMATES
      2. & FORECAST, BY PRICE RANGE, 2019-2035 (USD BILLIONS) \r\nTABLE
    12. US USED BIKE MARKET SIZE ESTIMATES & FORECAST, BY REGIONAL, 2019-2035 (USD
      1. BILLIONS) \r\nTABLE 12. CANADA USED BIKE MARKET SIZE ESTIMATES
      2. & FORECAST, BY BIKE TYPE, 2019-2035 (USD BILLIONS) \r\nTABLE
    13. CANADA USED BIKE MARKET SIZE ESTIMATES & FORECAST, BY CONDITION, 2019-2035
      1. (USD BILLIONS) \r\nTABLE 14. CANADA USED BIKE MARKET SIZE
      2. ESTIMATES & FORECAST, BY ENGINE TYPE, 2019-2035 (USD BILLIONS) \r\nTABLE
    14. CANADA USED BIKE MARKET SIZE ESTIMATES & FORECAST, BY PRICE RANGE, 2019-2035
      1. (USD BILLIONS) \r\nTABLE 16. CANADA USED BIKE MARKET SIZE
      2. ESTIMATES & FORECAST, BY REGIONAL, 2019-2035 (USD BILLIONS) \r\nTABLE
    15. EUROPE USED BIKE MARKET SIZE ESTIMATES & FORECAST, BY BIKE TYPE, 2019-2035
      1. (USD BILLIONS) \r\nTABLE 18. EUROPE USED BIKE MARKET SIZE
      2. ESTIMATES & FORECAST, BY CONDITION, 2019-2035 (USD BILLIONS) \r\nTABLE
    16. EUROPE USED BIKE MARKET SIZE ESTIMATES & FORECAST, BY ENGINE TYPE, 2019-2035
      1. (USD BILLIONS) \r\nTABLE 20. EUROPE USED BIKE MARKET SIZE
      2. ESTIMATES & FORECAST, BY PRICE RANGE, 2019-2035 (USD BILLIONS) \r\nTABLE
    17. EUROPE USED BIKE MARKET SIZE ESTIMATES & FORECAST, BY REGIONAL, 2019-2035
      1. (USD BILLIONS) \r\nTABLE 22. GERMANY USED BIKE MARKET SIZE
      2. ESTIMATES & FORECAST, BY BIKE TYPE, 2019-2035 (USD BILLIONS) \r\nTABLE
    18. GERMANY USED BIKE MARKET SIZE ESTIMATES & FORECAST, BY CONDITION, 2019-2035
      1. (USD BILLIONS) \r\nTABLE 24. GERMANY USED BIKE MARKET SIZE
      2. ESTIMATES & FORECAST, BY ENGINE TYPE, 2019-2035 (USD BILLIONS) \r\nTABLE
    19. GERMANY USED BIKE MARKET SIZE ESTIMATES & FORECAST, BY PRICE RANGE, 2019-2035
      1. (USD BILLIONS) \r\nTABLE 26. GERMANY USED BIKE MARKET SIZE
      2. ESTIMATES & FORECAST, BY REGIONAL, 2019-2035 (USD BILLIONS) \r\nTABLE
    20. UK USED BIKE MARKET SIZE ESTIMATES & FORECAST, BY BIKE TYPE, 2019-2035 (USD
      1. BILLIONS) \r\nTABLE 28. UK USED BIKE MARKET SIZE ESTIMATES
      2. & FORECAST, BY CONDITION, 2019-2035 (USD BILLIONS) \r\nTABLE
    21. UK USED BIKE MARKET SIZE ESTIMATES & FORECAST, BY ENGINE TYPE, 2019-2035
      1. (USD BILLIONS) \r\nTABLE 30. UK USED BIKE MARKET SIZE ESTIMATES
      2. & FORECAST, BY PRICE RANGE, 2019-2035 (USD BILLIONS) \r\nTABLE
    22. UK USED BIKE MARKET SIZE ESTIMATES & FORECAST, BY REGIONAL, 2019-2035 (USD
      1. BILLIONS) \r\nTABLE 32. FRANCE USED BIKE MARKET SIZE ESTIMATES
      2. & FORECAST, BY BIKE TYPE, 2019-2035 (USD BILLIONS) \r\nTABLE
    23. FRANCE USED BIKE MARKET SIZE ESTIMATES & FORECAST, BY CONDITION, 2019-2035
      1. (USD BILLIONS) \r\nTABLE 34. FRANCE USED BIKE MARKET SIZE
      2. ESTIMATES & FORECAST, BY ENGINE TYPE, 2019-2035 (USD BILLIONS) \r\nTABLE
    24. FRANCE USED BIKE MARKET SIZE ESTIMATES & FORECAST, BY PRICE RANGE, 2019-2035
      1. (USD BILLIONS) \r\nTABLE 36. FRANCE USED BIKE MARKET SIZE
      2. ESTIMATES & FORECAST, BY REGIONAL, 2019-2035 (USD BILLIONS) \r\nTABLE
    25. RUSSIA USED BIKE MARKET SIZE ESTIMATES & FORECAST, BY BIKE TYPE, 2019-2035
      1. (USD BILLIONS) \r\nTABLE 38. RUSSIA USED BIKE MARKET SIZE
      2. ESTIMATES & FORECAST, BY CONDITION, 2019-2035 (USD BILLIONS) \r\nTABLE
    26. RUSSIA USED BIKE MARKET SIZE ESTIMATES & FORECAST, BY ENGINE TYPE, 2019-2035
      1. (USD BILLIONS) \r\nTABLE 40. RUSSIA USED BIKE MARKET SIZE
      2. ESTIMATES & FORECAST, BY PRICE RANGE, 2019-2035 (USD BILLIONS) \r\nTABLE
    27. RUSSIA USED BIKE MARKET SIZE ESTIMATES & FORECAST, BY REGIONAL, 2019-2035
      1. (USD BILLIONS) \r\nTABLE 42. ITALY USED BIKE MARKET SIZE
      2. ESTIMATES & FORECAST, BY BIKE TYPE, 2019-2035 (USD BILLIONS) \r\nTABLE
    28. ITALY USED BIKE MARKET SIZE ESTIMATES & FORECAST, BY CONDITION, 2019-2035
      1. (USD BILLIONS) \r\nTABLE 44. ITALY USED BIKE MARKET SIZE
      2. ESTIMATES & FORECAST, BY ENGINE TYPE, 2019-2035 (USD BILLIONS) \r\nTABLE
    29. ITALY USED BIKE MARKET SIZE ESTIMATES & FORECAST, BY PRICE RANGE, 2019-2035
      1. (USD BILLIONS) \r\nTABLE 46. ITALY USED BIKE MARKET SIZE
      2. ESTIMATES & FORECAST, BY REGIONAL, 2019-2035 (USD BILLIONS) \r\nTABLE
    30. SPAIN USED BIKE MARKET SIZE ESTIMATES & FORECAST, BY BIKE TYPE, 2019-2035
      1. (USD BILLIONS) \r\nTABLE 48. SPAIN USED BIKE MARKET SIZE
      2. ESTIMATES & FORECAST, BY CONDITION, 2019-2035 (USD BILLIONS) \r\nTABLE
    31. SPAIN USED BIKE MARKET SIZE ESTIMATES & FORECAST, BY ENGINE TYPE, 2019-2035
      1. (USD BILLIONS) \r\nTABLE 50. SPAIN USED BIKE MARKET SIZE
      2. ESTIMATES & FORECAST, BY PRICE RANGE, 2019-2035 (USD BILLIONS) \r\nTABLE
    32. SPAIN USED BIKE MARKET SIZE ESTIMATES & FORECAST, BY REGIONAL, 2019-2035
      1. (USD BILLIONS) \r\nTABLE 52. REST OF EUROPE USED BIKE MARKET
      2. SIZE ESTIMATES & FORECAST, BY BIKE TYPE, 2019-2035 (USD BILLIONS) \r\nTABLE
    33. REST OF EUROPE USED BIKE MARKET SIZE ESTIMATES & FORECAST, BY CONDITION,
    34. BIKE MARKET SIZE ESTIMATES & FORECAST, BY ENGINE TYPE, 2019-2035 (USD BILLIONS)
      1. \r\nTABLE 55. REST OF EUROPE USED BIKE MARKET SIZE ESTIMATES &
      2. FORECAST, BY PRICE RANGE, 2019-2035 (USD BILLIONS) \r\nTABLE
    35. REST OF EUROPE USED BIKE MARKET SIZE ESTIMATES & FORECAST, BY REGIONAL,
      1. SIZE ESTIMATES & FORECAST, BY BIKE TYPE, 2019-2035 (USD BILLIONS) \r\nTABLE
    36. APAC USED BIKE MARKET SIZE ESTIMATES & FORECAST, BY CONDITION, 2019-2035
      1. (USD BILLIONS) \r\nTABLE 59. APAC USED BIKE MARKET SIZE ESTIMATES
      2. & FORECAST, BY ENGINE TYPE, 2019-2035 (USD BILLIONS) \r\nTABLE
    37. APAC USED BIKE MARKET SIZE ESTIMATES & FORECAST, BY PRICE RANGE, 2019-2035
      1. (USD BILLIONS) \r\nTABLE 61. APAC USED BIKE MARKET SIZE ESTIMATES
      2. & FORECAST, BY REGIONAL, 2019-2035 (USD BILLIONS) \r\nTABLE
    38. CHINA USED BIKE MARKET SIZE ESTIMATES & FORECAST, BY BIKE TYPE, 2019-2035
      1. (USD BILLIONS) \r\nTABLE 63. CHINA USED BIKE MARKET SIZE
      2. ESTIMATES & FORECAST, BY CONDITION, 2019-2035 (USD BILLIONS) \r\nTABLE
    39. CHINA USED BIKE MARKET SIZE ESTIMATES & FORECAST, BY ENGINE TYPE, 2019-2035
      1. (USD BILLIONS) \r\nTABLE 65. CHINA USED BIKE MARKET SIZE
      2. ESTIMATES & FORECAST, BY PRICE RANGE, 2019-2035 (USD BILLIONS) \r\nTABLE
    40. CHINA USED BIKE MARKET SIZE ESTIMATES & FORECAST, BY REGIONAL, 2019-2035
      1. (USD BILLIONS) \r\nTABLE 67. INDIA USED BIKE MARKET SIZE
      2. ESTIMATES & FORECAST, BY BIKE TYPE, 2019-2035 (USD BILLIONS) \r\nTABLE
    41. INDIA USED BIKE MARKET SIZE ESTIMATES & FORECAST, BY CONDITION, 2019-2035
      1. (USD BILLIONS) \r\nTABLE 69. INDIA USED BIKE MARKET SIZE
      2. ESTIMATES & FORECAST, BY ENGINE TYPE, 2019-2035 (USD BILLIONS) \r\nTABLE
    42. INDIA USED BIKE MARKET SIZE ESTIMATES & FORECAST, BY PRICE RANGE, 2019-2035
      1. (USD BILLIONS) \r\nTABLE 71. INDIA USED BIKE MARKET SIZE
      2. ESTIMATES & FORECAST, BY REGIONAL, 2019-2035 (USD BILLIONS) \r\nTABLE
    43. JAPAN USED BIKE MARKET SIZE ESTIMATES & FORECAST, BY BIKE TYPE, 2019-2035
      1. (USD BILLIONS) \r\nTABLE 73. JAPAN USED BIKE MARKET SIZE
      2. ESTIMATES & FORECAST, BY CONDITION, 2019-2035 (USD BILLIONS) \r\nTABLE
    44. JAPAN USED BIKE MARKET SIZE ESTIMATES & FORECAST, BY ENGINE TYPE, 2019-2035
      1. (USD BILLIONS) \r\nTABLE 75. JAPAN USED BIKE MARKET SIZE
      2. ESTIMATES & FORECAST, BY PRICE RANGE, 2019-2035 (USD BILLIONS) \r\nTABLE
    45. JAPAN USED BIKE MARKET SIZE ESTIMATES & FORECAST, BY REGIONAL, 2019-2035
      1. (USD BILLIONS) \r\nTABLE 77. SOUTH KOREA USED BIKE MARKET
      2. SIZE ESTIMATES & FORECAST, BY BIKE TYPE, 2019-2035 (USD BILLIONS) \r\nTABLE
    46. SOUTH KOREA USED BIKE MARKET SIZE ESTIMATES & FORECAST, BY CONDITION, 2019-2035
      1. (USD BILLIONS) \r\nTABLE 79. SOUTH KOREA USED BIKE MARKET
      2. SIZE ESTIMATES & FORECAST, BY ENGINE TYPE, 2019-2035 (USD BILLIONS) \r\nTABLE
    47. SOUTH KOREA USED BIKE MARKET SIZE ESTIMATES & FORECAST, BY PRICE RANGE,
    48. MARKET SIZE ESTIMATES & FORECAST, BY REGIONAL, 2019-2035 (USD BILLIONS)
      1. \r\nTABLE 82. MALAYSIA USED BIKE MARKET SIZE ESTIMATES & FORECAST,
      2. BY BIKE TYPE, 2019-2035 (USD BILLIONS) \r\nTABLE 83. MALAYSIA
    49. USED BIKE MARKET SIZE ESTIMATES & FORECAST, BY CONDITION, 2019-2035 (USD BILLIONS)
      1. \r\nTABLE 84. MALAYSIA USED BIKE MARKET SIZE ESTIMATES & FORECAST,
      2. BY ENGINE TYPE, 2019-2035 (USD BILLIONS) \r\nTABLE 85. MALAYSIA
    50. USED BIKE MARKET SIZE ESTIMATES & FORECAST, BY PRICE RANGE, 2019-2035 (USD BILLIONS)
      1. \r\nTABLE 86. MALAYSIA USED BIKE MARKET SIZE ESTIMATES & FORECAST,
      2. BY REGIONAL, 2019-2035 (USD BILLIONS) \r\nTABLE 87. THAILAND
    51. USED BIKE MARKET SIZE ESTIMATES & FORECAST, BY BIKE TYPE, 2019-2035 (USD BILLIONS)
      1. \r\nTABLE 88. THAILAND USED BIKE MARKET SIZE ESTIMATES & FORECAST,
      2. BY CONDITION, 2019-2035 (USD BILLIONS) \r\nTABLE 89. THAILAND
    52. USED BIKE MARKET SIZE ESTIMATES & FORECAST, BY ENGINE TYPE, 2019-2035 (USD BILLIONS)
      1. \r\nTABLE 90. THAILAND USED BIKE MARKET SIZE ESTIMATES & FORECAST,
      2. BY PRICE RANGE, 2019-2035 (USD BILLIONS) \r\nTABLE 91. THAILAND
    53. USED BIKE MARKET SIZE ESTIMATES & FORECAST, BY REGIONAL, 2019-2035 (USD BILLIONS)
      1. \r\nTABLE 92. INDONESIA USED BIKE MARKET SIZE ESTIMATES & FORECAST,
      2. BY BIKE TYPE, 2019-2035 (USD BILLIONS) \r\nTABLE 93. INDONESIA
    54. USED BIKE MARKET SIZE ESTIMATES & FORECAST, BY CONDITION, 2019-2035 (USD BILLIONS)
      1. \r\nTABLE 94. INDONESIA USED BIKE MARKET SIZE ESTIMATES & FORECAST,
      2. BY ENGINE TYPE, 2019-2035 (USD BILLIONS) \r\nTABLE 95. INDONESIA
    55. USED BIKE MARKET SIZE ESTIMATES & FORECAST, BY PRICE RANGE, 2019-2035 (USD BILLIONS)
      1. \r\nTABLE 96. INDONESIA USED BIKE MARKET SIZE ESTIMATES & FORECAST,
      2. BY REGIONAL, 2019-2035 (USD BILLIONS) \r\nTABLE 97. REST
    56. OF APAC USED BIKE MARKET SIZE ESTIMATES & FORECAST, BY BIKE TYPE, 2019-2035
      1. (USD BILLIONS) \r\nTABLE 98. REST OF APAC USED BIKE MARKET
      2. SIZE ESTIMATES & FORECAST, BY CONDITION, 2019-2035 (USD BILLIONS) \r\nTABLE
    57. REST OF APAC USED BIKE MARKET SIZE ESTIMATES & FORECAST, BY ENGINE TYPE,
    58. BIKE MARKET SIZE ESTIMATES & FORECAST, BY PRICE RANGE, 2019-2035 (USD BILLIONS)
      1. \r\nTABLE 101. REST OF APAC USED BIKE MARKET SIZE ESTIMATES &
      2. FORECAST, BY REGIONAL, 2019-2035 (USD BILLIONS) \r\nTABLE
    59. SOUTH AMERICA USED BIKE MARKET SIZE ESTIMATES & FORECAST, BY BIKE TYPE,
    60. BIKE MARKET SIZE ESTIMATES & FORECAST, BY CONDITION, 2019-2035 (USD BILLIONS)
      1. \r\nTABLE 104. SOUTH AMERICA USED BIKE MARKET SIZE ESTIMATES &
      2. FORECAST, BY ENGINE TYPE, 2019-2035 (USD BILLIONS) \r\nTABLE
    61. SOUTH AMERICA USED BIKE MARKET SIZE ESTIMATES & FORECAST, BY PRICE RANGE,
    62. BIKE MARKET SIZE ESTIMATES & FORECAST, BY REGIONAL, 2019-2035 (USD BILLIONS)
      1. \r\nTABLE 107. BRAZIL USED BIKE MARKET SIZE ESTIMATES & FORECAST,
      2. BY BIKE TYPE, 2019-2035 (USD BILLIONS) \r\nTABLE 108. BRAZIL
    63. USED BIKE MARKET SIZE ESTIMATES & FORECAST, BY CONDITION, 2019-2035 (USD BILLIONS)
      1. \r\nTABLE 109. BRAZIL USED BIKE MARKET SIZE ESTIMATES & FORECAST,
      2. BY ENGINE TYPE, 2019-2035 (USD BILLIONS) \r\nTABLE 110. BRAZIL
    64. USED BIKE MARKET SIZE ESTIMATES & FORECAST, BY PRICE RANGE, 2019-2035 (USD BILLIONS)
      1. \r\nTABLE 111. BRAZIL USED BIKE MARKET SIZE ESTIMATES & FORECAST,
      2. BY REGIONAL, 2019-2035 (USD BILLIONS) \r\nTABLE 112. MEXICO
    65. USED BIKE MARKET SIZE ESTIMATES & FORECAST, BY BIKE TYPE, 2019-2035 (USD BILLIONS)
      1. \r\nTABLE 113. MEXICO USED BIKE MARKET SIZE ESTIMATES & FORECAST,
      2. BY CONDITION, 2019-2035 (USD BILLIONS) \r\nTABLE 114. MEXICO
    66. USED BIKE MARKET SIZE ESTIMATES & FORECAST, BY ENGINE TYPE, 2019-2035 (USD BILLIONS)
      1. \r\nTABLE 115. MEXICO USED BIKE MARKET SIZE ESTIMATES & FORECAST,
      2. BY PRICE RANGE, 2019-2035 (USD BILLIONS) \r\nTABLE 116. MEXICO
    67. USED BIKE MARKET SIZE ESTIMATES & FORECAST, BY REGIONAL, 2019-2035 (USD BILLIONS)
      1. \r\nTABLE 117. ARGENTINA USED BIKE MARKET SIZE ESTIMATES &
      2. FORECAST, BY BIKE TYPE, 2019-2035 (USD BILLIONS) \r\nTABLE
    68. ARGENTINA USED BIKE MARKET SIZE ESTIMATES & FORECAST, BY CONDITION, 2019-2035
      1. (USD BILLIONS) \r\nTABLE 119. ARGENTINA USED BIKE MARKET
      2. SIZE ESTIMATES & FORECAST, BY ENGINE TYPE, 2019-2035 (USD BILLIONS) \r\nTABLE
    69. ARGENTINA USED BIKE MARKET SIZE ESTIMATES & FORECAST, BY PRICE RANGE, 2019-2035
      1. (USD BILLIONS) \r\nTABLE 121. ARGENTINA USED BIKE MARKET
      2. SIZE ESTIMATES & FORECAST, BY REGIONAL, 2019-2035 (USD BILLIONS) \r\nTABLE
    70. REST OF SOUTH AMERICA USED BIKE MARKET SIZE ESTIMATES & FORECAST, BY BIKE
      1. TYPE, 2019-2035 (USD BILLIONS) \r\nTABLE 123. REST OF SOUTH
    71. AMERICA USED BIKE MARKET SIZE ESTIMATES & FORECAST, BY CONDITION, 2019-2035
      1. (USD BILLIONS) \r\nTABLE 124. REST OF SOUTH AMERICA USED
    72. BIKE MARKET SIZE ESTIMATES & FORECAST, BY ENGINE TYPE, 2019-2035 (USD BILLIONS)
      1. \r\nTABLE 125. REST OF SOUTH AMERICA USED BIKE MARKET SIZE ESTIMATES
      2. & FORECAST, BY PRICE RANGE, 2019-2035 (USD BILLIONS) \r\nTABLE
    73. REST OF SOUTH AMERICA USED BIKE MARKET SIZE ESTIMATES & FORECAST, BY REGIONAL,
      1. SIZE ESTIMATES & FORECAST, BY BIKE TYPE, 2019-2035 (USD BILLIONS) \r\nTABLE
    74. MEA USED BIKE MARKET SIZE ESTIMATES & FORECAST, BY CONDITION, 2019-2035
      1. (USD BILLIONS) \r\nTABLE 129. MEA USED BIKE MARKET SIZE ESTIMATES
      2. & FORECAST, BY ENGINE TYPE, 2019-2035 (USD BILLIONS) \r\nTABLE
    75. MEA USED BIKE MARKET SIZE ESTIMATES & FORECAST, BY PRICE RANGE, 2019-2035
      1. (USD BILLIONS) \r\nTABLE 131. MEA USED BIKE MARKET SIZE ESTIMATES
      2. & FORECAST, BY REGIONAL, 2019-2035 (USD BILLIONS) \r\nTABLE
    76. GCC COUNTRIES USED BIKE MARKET SIZE ESTIMATES & FORECAST, BY BIKE TYPE,
    77. BIKE MARKET SIZE ESTIMATES & FORECAST, BY CONDITION, 2019-2035 (USD BILLIONS)
      1. \r\nTABLE 134. GCC COUNTRIES USED BIKE MARKET SIZE ESTIMATES &
      2. FORECAST, BY ENGINE TYPE, 2019-2035 (USD BILLIONS) \r\nTABLE
    78. GCC COUNTRIES USED BIKE MARKET SIZE ESTIMATES & FORECAST, BY PRICE RANGE,
    79. BIKE MARKET SIZE ESTIMATES & FORECAST, BY REGIONAL, 2019-2035 (USD BILLIONS)
      1. \r\nTABLE 137. SOUTH AFRICA USED BIKE MARKET SIZE ESTIMATES &
      2. FORECAST, BY BIKE TYPE, 2019-2035 (USD BILLIONS) \r\nTABLE
    80. SOUTH AFRICA USED BIKE MARKET SIZE ESTIMATES & FORECAST, BY CONDITION,
    81. BIKE MARKET SIZE ESTIMATES & FORECAST, BY ENGINE TYPE, 2019-2035 (USD BILLIONS)
      1. \r\nTABLE 140. SOUTH AFRICA USED BIKE MARKET SIZE ESTIMATES &
      2. FORECAST, BY PRICE RANGE, 2019-2035 (USD BILLIONS) \r\nTABLE
    82. SOUTH AFRICA USED BIKE MARKET SIZE ESTIMATES & FORECAST, BY REGIONAL, 2019-2035
      1. (USD BILLIONS) \r\nTABLE 142. REST OF MEA USED BIKE MARKET
      2. SIZE ESTIMATES & FORECAST, BY BIKE TYPE, 2019-2035 (USD BILLIONS) \r\nTABLE
    83. REST OF MEA USED BIKE MARKET SIZE ESTIMATES & FORECAST, BY CONDITION, 2019-2035
      1. (USD BILLIONS) \r\nTABLE 144. REST OF MEA USED BIKE MARKET
      2. SIZE ESTIMATES & FORECAST, BY ENGINE TYPE, 2019-2035 (USD BILLIONS) \r\nTABLE
    84. REST OF MEA USED BIKE MARKET SIZE ESTIMATES & FORECAST, BY PRICE RANGE,
    85. BIKE MARKET SIZE ESTIMATES & FORECAST, BY REGIONAL, 2019-2035 (USD BILLIONS)
      1. \r\nTABLE 147. PRODUCT LAUNCH/PRODUCT DEVELOPMENT/APPROVAL
      2. \r\nTABLE 148. ACQUISITION/PARTNERSHIP \r\n \r\n \r\n \r\n \r\n \r\n \r\n \r\n \r\n \r\n \r\n \r\n \r\n \r\n \r\n \r\n \r\n \r\n \r\n \r\n \r\n \r\n \r\n \r\n \r\n \r\n \r\n \r\n \r\n \r\nLIST
      3. OF FIGURES\r\n \r\nFIGURE 1. MARKET SYNOPSIS \r\nFIGURE
    86. NORTH AMERICA USED BIKE MARKET ANALYSIS \r\nFIGURE 3. US USED
      1. BIKE MARKET ANALYSIS BY BIKE TYPE \r\nFIGURE 4. US USED BIKE MARKET
      2. ANALYSIS BY CONDITION \r\nFIGURE 5. US USED BIKE MARKET ANALYSIS
      3. BY ENGINE TYPE \r\nFIGURE 6. US USED BIKE MARKET ANALYSIS BY PRICE
      4. RANGE \r\nFIGURE 7. US USED BIKE MARKET ANALYSIS BY REGIONAL \r\nFIGURE
    87. CANADA USED BIKE MARKET ANALYSIS BY BIKE TYPE \r\nFIGURE 9. CANADA
      1. USED BIKE MARKET ANALYSIS BY CONDITION \r\nFIGURE 10. CANADA USED
      2. BIKE MARKET ANALYSIS BY ENGINE TYPE \r\nFIGURE 11. CANADA USED BIKE
      3. MARKET ANALYSIS BY PRICE RANGE \r\nFIGURE 12. CANADA USED BIKE MARKET
      4. ANALYSIS BY REGIONAL \r\nFIGURE 13. EUROPE USED BIKE MARKET ANALYSIS \r\nFIGURE
    88. GERMANY USED BIKE MARKET ANALYSIS BY BIKE TYPE \r\nFIGURE 15.
      1. GERMANY USED BIKE MARKET ANALYSIS BY CONDITION \r\nFIGURE 16. GERMANY
      2. USED BIKE MARKET ANALYSIS BY ENGINE TYPE \r\nFIGURE 17. GERMANY
      3. USED BIKE MARKET ANALYSIS BY PRICE RANGE \r\nFIGURE 18. GERMANY
      4. USED BIKE MARKET ANALYSIS BY REGIONAL \r\nFIGURE 19. UK USED BIKE
      5. MARKET ANALYSIS BY BIKE TYPE \r\nFIGURE 20. UK USED BIKE MARKET
      6. ANALYSIS BY CONDITION \r\nFIGURE 21. UK USED BIKE MARKET ANALYSIS
      7. BY ENGINE TYPE \r\nFIGURE 22. UK USED BIKE MARKET ANALYSIS BY PRICE
      8. RANGE \r\nFIGURE 23. UK USED BIKE MARKET ANALYSIS BY REGIONAL \r\nFIGURE
    89. FRANCE USED BIKE MARKET ANALYSIS BY BIKE TYPE \r\nFIGURE 25.
      1. FRANCE USED BIKE MARKET ANALYSIS BY CONDITION \r\nFIGURE 26. FRANCE
      2. USED BIKE MARKET ANALYSIS BY ENGINE TYPE \r\nFIGURE 27. FRANCE USED
      3. BIKE MARKET ANALYSIS BY PRICE RANGE \r\nFIGURE 28. FRANCE USED BIKE
      4. MARKET ANALYSIS BY REGIONAL \r\nFIGURE 29. RUSSIA USED BIKE MARKET
      5. ANALYSIS BY BIKE TYPE \r\nFIGURE 30. RUSSIA USED BIKE MARKET ANALYSIS
      6. BY CONDITION \r\nFIGURE 31. RUSSIA USED BIKE MARKET ANALYSIS BY
      7. ENGINE TYPE \r\nFIGURE 32. RUSSIA USED BIKE MARKET ANALYSIS BY PRICE
      8. RANGE \r\nFIGURE 33. RUSSIA USED BIKE MARKET ANALYSIS BY REGIONAL \r\nFIGURE
    90. ITALY USED BIKE MARKET ANALYSIS BY BIKE TYPE \r\nFIGURE 35.
      1. ITALY USED BIKE MARKET ANALYSIS BY CONDITION \r\nFIGURE 36. ITALY
      2. USED BIKE MARKET ANALYSIS BY ENGINE TYPE \r\nFIGURE 37. ITALY USED
      3. BIKE MARKET ANALYSIS BY PRICE RANGE \r\nFIGURE 38. ITALY USED BIKE
      4. MARKET ANALYSIS BY REGIONAL \r\nFIGURE 39. SPAIN USED BIKE MARKET
      5. ANALYSIS BY BIKE TYPE \r\nFIGURE 40. SPAIN USED BIKE MARKET ANALYSIS
      6. BY CONDITION \r\nFIGURE 41. SPAIN USED BIKE MARKET ANALYSIS BY ENGINE
      7. TYPE \r\nFIGURE 42. SPAIN USED BIKE MARKET ANALYSIS BY PRICE RANGE \r\nFIGURE
    91. SPAIN USED BIKE MARKET ANALYSIS BY REGIONAL \r\nFIGURE 44. REST
      1. OF EUROPE USED BIKE MARKET ANALYSIS BY BIKE TYPE \r\nFIGURE 45.
      2. REST OF EUROPE USED BIKE MARKET ANALYSIS BY CONDITION \r\nFIGURE
    92. REST OF EUROPE USED BIKE MARKET ANALYSIS BY ENGINE TYPE \r\nFIGURE
    93. REST OF EUROPE USED BIKE MARKET ANALYSIS BY PRICE RANGE \r\nFIGURE
    94. REST OF EUROPE USED BIKE MARKET ANALYSIS BY REGIONAL \r\nFIGURE
    95. APAC USED BIKE MARKET ANALYSIS \r\nFIGURE 50. CHINA USED BIKE
      1. MARKET ANALYSIS BY BIKE TYPE \r\nFIGURE 51. CHINA USED BIKE MARKET
      2. ANALYSIS BY CONDITION \r\nFIGURE 52. CHINA USED BIKE MARKET ANALYSIS
      3. BY ENGINE TYPE \r\nFIGURE 53. CHINA USED BIKE MARKET ANALYSIS BY
      4. PRICE RANGE \r\nFIGURE 54. CHINA USED BIKE MARKET ANALYSIS BY REGIONAL \r\nFIGURE
    96. INDIA USED BIKE MARKET ANALYSIS BY BIKE TYPE \r\nFIGURE 56.
      1. INDIA USED BIKE MARKET ANALYSIS BY CONDITION \r\nFIGURE 57. INDIA
      2. USED BIKE MARKET ANALYSIS BY ENGINE TYPE \r\nFIGURE 58. INDIA USED
      3. BIKE MARKET ANALYSIS BY PRICE RANGE \r\nFIGURE 59. INDIA USED BIKE
      4. MARKET ANALYSIS BY REGIONAL \r\nFIGURE 60. JAPAN USED BIKE MARKET
      5. ANALYSIS BY BIKE TYPE \r\nFIGURE 61. JAPAN USED BIKE MARKET ANALYSIS
      6. BY CONDITION \r\nFIGURE 62. JAPAN USED BIKE MARKET ANALYSIS BY ENGINE
      7. TYPE \r\nFIGURE 63. JAPAN USED BIKE MARKET ANALYSIS BY PRICE RANGE \r\nFIGURE
    97. JAPAN USED BIKE MARKET ANALYSIS BY REGIONAL \r\nFIGURE 65. SOUTH
      1. KOREA USED BIKE MARKET ANALYSIS BY BIKE TYPE \r\nFIGURE 66. SOUTH
      2. KOREA USED BIKE MARKET ANALYSIS BY CONDITION \r\nFIGURE 67. SOUTH
      3. KOREA USED BIKE MARKET ANALYSIS BY ENGINE TYPE \r\nFIGURE 68. SOUTH
      4. KOREA USED BIKE MARKET ANALYSIS BY PRICE RANGE \r\nFIGURE 69. SOUTH
      5. KOREA USED BIKE MARKET ANALYSIS BY REGIONAL \r\nFIGURE 70. MALAYSIA
      6. USED BIKE MARKET ANALYSIS BY BIKE TYPE \r\nFIGURE 71. MALAYSIA USED
      7. BIKE MARKET ANALYSIS BY CONDITION \r\nFIGURE 72. MALAYSIA USED BIKE
      8. MARKET ANALYSIS BY ENGINE TYPE \r\nFIGURE 73. MALAYSIA USED BIKE
      9. MARKET ANALYSIS BY PRICE RANGE \r\nFIGURE 74. MALAYSIA USED BIKE
      10. MARKET ANALYSIS BY REGIONAL \r\nFIGURE 75. THAILAND USED BIKE MARKET
      11. ANALYSIS BY BIKE TYPE \r\nFIGURE 76. THAILAND USED BIKE MARKET ANALYSIS
      12. BY CONDITION \r\nFIGURE 77. THAILAND USED BIKE MARKET ANALYSIS BY
      13. ENGINE TYPE \r\nFIGURE 78. THAILAND USED BIKE MARKET ANALYSIS BY
      14. PRICE RANGE \r\nFIGURE 79. THAILAND USED BIKE MARKET ANALYSIS BY
      15. REGIONAL \r\nFIGURE 80. INDONESIA USED BIKE MARKET ANALYSIS BY BIKE
      16. TYPE \r\nFIGURE 81. INDONESIA USED BIKE MARKET ANALYSIS BY CONDITION \r\nFIGURE
    98. INDONESIA USED BIKE MARKET ANALYSIS BY ENGINE TYPE \r\nFIGURE
    99. INDONESIA USED BIKE MARKET ANALYSIS BY PRICE RANGE \r\nFIGURE
    100. INDONESIA USED BIKE MARKET ANALYSIS BY REGIONAL \r\nFIGURE 85.
      1. REST OF APAC USED BIKE MARKET ANALYSIS BY BIKE TYPE \r\nFIGURE 86.
      2. REST OF APAC USED BIKE MARKET ANALYSIS BY CONDITION \r\nFIGURE 87.
      3. REST OF APAC USED BIKE MARKET ANALYSIS BY ENGINE TYPE \r\nFIGURE
    101. REST OF APAC USED BIKE MARKET ANALYSIS BY PRICE RANGE \r\nFIGURE
    102. REST OF APAC USED BIKE MARKET ANALYSIS BY REGIONAL \r\nFIGURE
    103. SOUTH AMERICA USED BIKE MARKET ANALYSIS \r\nFIGURE 91. BRAZIL
      1. USED BIKE MARKET ANALYSIS BY BIKE TYPE \r\nFIGURE 92. BRAZIL USED
      2. BIKE MARKET ANALYSIS BY CONDITION \r\nFIGURE 93. BRAZIL USED BIKE
      3. MARKET ANALYSIS BY ENGINE TYPE \r\nFIGURE 94. BRAZIL USED BIKE MARKET
      4. ANALYSIS BY PRICE RANGE \r\nFIGURE 95. BRAZIL USED BIKE MARKET ANALYSIS
      5. BY REGIONAL \r\nFIGURE 96. MEXICO USED BIKE MARKET ANALYSIS BY BIKE
      6. TYPE \r\nFIGURE 97. MEXICO USED BIKE MARKET ANALYSIS BY CONDITION \r\nFIGURE
    104. MEXICO USED BIKE MARKET ANALYSIS BY ENGINE TYPE \r\nFIGURE 99.
      1. MEXICO USED BIKE MARKET ANALYSIS BY PRICE RANGE \r\nFIGURE 100.
      2. MEXICO USED BIKE MARKET ANALYSIS BY REGIONAL \r\nFIGURE 101. ARGENTINA
      3. USED BIKE MARKET ANALYSIS BY BIKE TYPE \r\nFIGURE 102. ARGENTINA
      4. USED BIKE MARKET ANALYSIS BY CONDITION \r\nFIGURE 103. ARGENTINA
      5. USED BIKE MARKET ANALYSIS BY ENGINE TYPE \r\nFIGURE 104. ARGENTINA
      6. USED BIKE MARKET ANALYSIS BY PRICE RANGE \r\nFIGURE 105. ARGENTINA
      7. USED BIKE MARKET ANALYSIS BY REGIONAL \r\nFIGURE 106. REST OF SOUTH
      8. AMERICA USED BIKE MARKET ANALYSIS BY BIKE TYPE \r\nFIGURE 107. REST
      9. OF SOUTH AMERICA USED BIKE MARKET ANALYSIS BY CONDITION \r\nFIGURE
    105. REST OF SOUTH AMERICA USED BIKE MARKET ANALYSIS BY ENGINE TYPE \r\nFIGURE
    106. REST OF SOUTH AMERICA USED BIKE MARKET ANALYSIS BY PRICE RANGE \r\nFIGURE
    107. REST OF SOUTH AMERICA USED BIKE MARKET ANALYSIS BY REGIONAL \r\nFIGURE
    108. MEA USED BIKE MARKET ANALYSIS \r\nFIGURE 112. GCC COUNTRIES
      1. USED BIKE MARKET ANALYSIS BY BIKE TYPE \r\nFIGURE 113. GCC COUNTRIES
      2. USED BIKE MARKET ANALYSIS BY CONDITION \r\nFIGURE 114. GCC COUNTRIES
      3. USED BIKE MARKET ANALYSIS BY ENGINE TYPE \r\nFIGURE 115. GCC COUNTRIES
      4. USED BIKE MARKET ANALYSIS BY PRICE RANGE \r\nFIGURE 116. GCC COUNTRIES
      5. USED BIKE MARKET ANALYSIS BY REGIONAL \r\nFIGURE 117. SOUTH AFRICA
      6. USED BIKE MARKET ANALYSIS BY BIKE TYPE \r\nFIGURE 118. SOUTH AFRICA
      7. USED BIKE MARKET ANALYSIS BY CONDITION \r\nFIGURE 119. SOUTH AFRICA
      8. USED BIKE MARKET ANALYSIS BY ENGINE TYPE \r\nFIGURE 120. SOUTH AFRICA
      9. USED BIKE MARKET ANALYSIS BY PRICE RANGE \r\nFIGURE 121. SOUTH AFRICA
      10. USED BIKE MARKET ANALYSIS BY REGIONAL \r\nFIGURE 122. REST OF MEA
      11. USED BIKE MARKET ANALYSIS BY BIKE TYPE \r\nFIGURE 123. REST OF MEA
      12. USED BIKE MARKET ANALYSIS BY CONDITION \r\nFIGURE 124. REST OF MEA
      13. USED BIKE MARKET ANALYSIS BY ENGINE TYPE \r\nFIGURE 125. REST OF
      14. MEA USED BIKE MARKET ANALYSIS BY PRICE RANGE \r\nFIGURE 126. REST
      15. OF MEA USED BIKE MARKET ANALYSIS BY REGIONAL \r\nFIGURE 127. KEY
      16. BUYING CRITERIA OF USED BIKE MARKET \r\nFIGURE 128. RESEARCH PROCESS
      17. OF MRFR \r\nFIGURE 129. DRO ANALYSIS OF USED BIKE MARKET \r\nFIGURE
    109. DRIVERS IMPACT ANALYSIS: USED BIKE MARKET \r\nFIGURE 131. RESTRAINTS
      1. IMPACT ANALYSIS: USED BIKE MARKET \r\nFIGURE 132. SUPPLY / VALUE
    110. CHAIN: USED BIKE MARKET \r\nFIGURE 133. USED BIKE MARKET, BY BIKE
    111. TYPE, 2025 (% SHARE) \r\nFIGURE 134. USED BIKE MARKET, BY BIKE TYPE,
    112. CONDITION, 2025 (% SHARE) \r\nFIGURE 136. USED BIKE MARKET, BY CONDITION,
      1. ENGINE TYPE, 2025 (% SHARE) \r\nFIGURE 138. USED BIKE MARKET, BY
      2. ENGINE TYPE, 2019 TO 2035 (USD Billions) \r\nFIGURE 139. USED BIKE
    113. MARKET, BY PRICE RANGE, 2025 (% SHARE) \r\nFIGURE 140. USED BIKE
    114. MARKET, BY PRICE RANGE, 2019 TO 2035 (USD Billions) \r\nFIGURE 141.
    115. USED BIKE MARKET, BY REGIONAL, 2025 (% SHARE) \r\nFIGURE 142. USED
    116. BIKE MARKET, BY REGIONAL, 2019 TO 2035 (USD Billions) \r\nFIGURE
    117. BENCHMARKING OF MAJOR COMPETITORS \r\n

    Used Bike Market Segmentation

    • Used Bike Market By Bike Type (USD Billion, 2019-2035)

      • Standard

      • Sport

      • Cruiser

      • Touring

      • Dual-Sport

    • Used Bike Market By Condition (USD Billion, 2019-2035)

      • Certified Pre-Owned

      • Good Condition

      • Fair Condition

      • As-Is

    • Used Bike Market By Engine Type (USD Billion, 2019-2035)

      • Internal Combustion Engine

      • Electric

      • Hybrid

    • Used Bike Market By Price Range (USD Billion, 2019-2035)

      • Below $1,000

      • $1,000 - $5,000

      • $5,000 - $10,000

      • Above $10,000

    • Used Bike Market By Regional (USD Billion, 2019-2035)

      • North America

      • Europe

      • South America

      • Asia Pacific

      • Middle East and Africa

    Used Bike Market Regional Outlook (USD Billion, 2019-2035)

    • North America Outlook (USD Billion, 2019-2035)

      • North America Used Bike Market by Bike Type

        • Standard

        • Sport

        • Cruiser

        • Touring

        • Dual-Sport

      • North America Used Bike Market by Condition Type

        • Certified Pre-Owned

        • Good Condition

        • Fair Condition

        • As-Is

      • North America Used Bike Market by Engine Type

        • Internal Combustion Engine

        • Electric

        • Hybrid

      • North America Used Bike Market by Price Range Type

        • Below $1,000

        • $1,000 - $5,000

        • $5,000 - $10,000

        • Above $10,000

      • North America Used Bike Market by Regional Type

        • US

        • Canada

      • US Outlook (USD Billion, 2019-2035)

      • US Used Bike Market by Bike Type

        • Standard

        • Sport

        • Cruiser

        • Touring

        • Dual-Sport

      • US Used Bike Market by Condition Type

        • Certified Pre-Owned

        • Good Condition

        • Fair Condition

        • As-Is

      • US Used Bike Market by Engine Type

        • Internal Combustion Engine

        • Electric

        • Hybrid

      • US Used Bike Market by Price Range Type

        • Below $1,000

        • $1,000 - $5,000

        • $5,000 - $10,000

        • Above $10,000

      • CANADA Outlook (USD Billion, 2019-2035)

      • CANADA Used Bike Market by Bike Type

        • Standard

        • Sport

        • Cruiser

        • Touring

        • Dual-Sport

      • CANADA Used Bike Market by Condition Type

        • Certified Pre-Owned

        • Good Condition

        • Fair Condition

        • As-Is

      • CANADA Used Bike Market by Engine Type

        • Internal Combustion Engine

        • Electric

        • Hybrid

      • CANADA Used Bike Market by Price Range Type

        • Below $1,000

        • $1,000 - $5,000

        • $5,000 - $10,000

        • Above $10,000

    • Europe Outlook (USD Billion, 2019-2035)

      • Europe Used Bike Market by Bike Type

        • Standard

        • Sport

        • Cruiser

        • Touring

        • Dual-Sport

      • Europe Used Bike Market by Condition Type

        • Certified Pre-Owned

        • Good Condition

        • Fair Condition

        • As-Is

      • Europe Used Bike Market by Engine Type

        • Internal Combustion Engine

        • Electric

        • Hybrid

      • Europe Used Bike Market by Price Range Type

        • Below $1,000

        • $1,000 - $5,000

        • $5,000 - $10,000

        • Above $10,000

      • Europe Used Bike Market by Regional Type

        • Germany

        • UK

        • France

        • Russia

        • Italy

        • Spain

        • Rest of Europe

      • GERMANY Outlook (USD Billion, 2019-2035)

      • GERMANY Used Bike Market by Bike Type

        • Standard

        • Sport

        • Cruiser

        • Touring

        • Dual-Sport

      • GERMANY Used Bike Market by Condition Type

        • Certified Pre-Owned

        • Good Condition

        • Fair Condition

        • As-Is

      • GERMANY Used Bike Market by Engine Type

        • Internal Combustion Engine

        • Electric

        • Hybrid

      • GERMANY Used Bike Market by Price Range Type

        • Below $1,000

        • $1,000 - $5,000

        • $5,000 - $10,000

        • Above $10,000

      • UK Outlook (USD Billion, 2019-2035)

      • UK Used Bike Market by Bike Type

        • Standard

        • Sport

        • Cruiser

        • Touring

        • Dual-Sport

      • UK Used Bike Market by Condition Type

        • Certified Pre-Owned

        • Good Condition

        • Fair Condition

        • As-Is

      • UK Used Bike Market by Engine Type

        • Internal Combustion Engine

        • Electric

        • Hybrid

      • UK Used Bike Market by Price Range Type

        • Below $1,000

        • $1,000 - $5,000

        • $5,000 - $10,000

        • Above $10,000

      • FRANCE Outlook (USD Billion, 2019-2035)

      • FRANCE Used Bike Market by Bike Type

        • Standard

        • Sport

        • Cruiser

        • Touring

        • Dual-Sport

      • FRANCE Used Bike Market by Condition Type

        • Certified Pre-Owned

        • Good Condition

        • Fair Condition

        • As-Is

      • FRANCE Used Bike Market by Engine Type

        • Internal Combustion Engine

        • Electric

        • Hybrid

      • FRANCE Used Bike Market by Price Range Type

        • Below $1,000

        • $1,000 - $5,000

        • $5,000 - $10,000

        • Above $10,000

      • RUSSIA Outlook (USD Billion, 2019-2035)

      • RUSSIA Used Bike Market by Bike Type

        • Standard

        • Sport

        • Cruiser

        • Touring

        • Dual-Sport

      • RUSSIA Used Bike Market by Condition Type

        • Certified Pre-Owned

        • Good Condition

        • Fair Condition

        • As-Is

      • RUSSIA Used Bike Market by Engine Type

        • Internal Combustion Engine

        • Electric

        • Hybrid

      • RUSSIA Used Bike Market by Price Range Type

        • Below $1,000

        • $1,000 - $5,000

        • $5,000 - $10,000

        • Above $10,000

      • ITALY Outlook (USD Billion, 2019-2035)

      • ITALY Used Bike Market by Bike Type

        • Standard

        • Sport

        • Cruiser

        • Touring

        • Dual-Sport

      • ITALY Used Bike Market by Condition Type

        • Certified Pre-Owned

        • Good Condition

        • Fair Condition

        • As-Is

      • ITALY Used Bike Market by Engine Type

        • Internal Combustion Engine

        • Electric

        • Hybrid

      • ITALY Used Bike Market by Price Range Type

        • Below $1,000

        • $1,000 - $5,000

        • $5,000 - $10,000

        • Above $10,000

      • SPAIN Outlook (USD Billion, 2019-2035)

      • SPAIN Used Bike Market by Bike Type

        • Standard

        • Sport

        • Cruiser

        • Touring

        • Dual-Sport

      • SPAIN Used Bike Market by Condition Type

        • Certified Pre-Owned

        • Good Condition

        • Fair Condition

        • As-Is

      • SPAIN Used Bike Market by Engine Type

        • Internal Combustion Engine

        • Electric

        • Hybrid

      • SPAIN Used Bike Market by Price Range Type

        • Below $1,000

        • $1,000 - $5,000

        • $5,000 - $10,000

        • Above $10,000

      • REST OF EUROPE Outlook (USD Billion, 2019-2035)

      • REST OF EUROPE Used Bike Market by Bike Type

        • Standard

        • Sport

        • Cruiser

        • Touring

        • Dual-Sport

      • REST OF EUROPE Used Bike Market by Condition Type

        • Certified Pre-Owned

        • Good Condition

        • Fair Condition

        • As-Is

      • REST OF EUROPE Used Bike Market by Engine Type

        • Internal Combustion Engine

        • Electric

        • Hybrid

      • REST OF EUROPE Used Bike Market by Price Range Type

        • Below $1,000

        • $1,000 - $5,000

        • $5,000 - $10,000

        • Above $10,000

    • APAC Outlook (USD Billion, 2019-2035)

      • APAC Used Bike Market by Bike Type

        • Standard

        • Sport

        • Cruiser

        • Touring

        • Dual-Sport

      • APAC Used Bike Market by Condition Type

        • Certified Pre-Owned

        • Good Condition

        • Fair Condition

        • As-Is

      • APAC Used Bike Market by Engine Type

        • Internal Combustion Engine

        • Electric

        • Hybrid

      • APAC Used Bike Market by Price Range Type

        • Below $1,000

        • $1,000 - $5,000

        • $5,000 - $10,000

        • Above $10,000

      • APAC Used Bike Market by Regional Type

        • China

        • India

        • Japan

        • South Korea

        • Malaysia

        • Thailand

        • Indonesia

        • Rest of APAC

      • CHINA Outlook (USD Billion, 2019-2035)

      • CHINA Used Bike Market by Bike Type

        • Standard

        • Sport

        • Cruiser

        • Touring

        • Dual-Sport

      • CHINA Used Bike Market by Condition Type

        • Certified Pre-Owned

        • Good Condition

        • Fair Condition

        • As-Is

      • CHINA Used Bike Market by Engine Type

        • Internal Combustion Engine

        • Electric

        • Hybrid

      • CHINA Used Bike Market by Price Range Type

        • Below $1,000

        • $1,000 - $5,000

        • $5,000 - $10,000

        • Above $10,000

      • INDIA Outlook (USD Billion, 2019-2035)

      • INDIA Used Bike Market by Bike Type

        • Standard

        • Sport

        • Cruiser

        • Touring

        • Dual-Sport

      • INDIA Used Bike Market by Condition Type

        • Certified Pre-Owned

        • Good Condition

        • Fair Condition

        • As-Is

      • INDIA Used Bike Market by Engine Type

        • Internal Combustion Engine

        • Electric

        • Hybrid

      • INDIA Used Bike Market by Price Range Type

        • Below $1,000

        • $1,000 - $5,000

        • $5,000 - $10,000

        • Above $10,000

      • JAPAN Outlook (USD Billion, 2019-2035)

      • JAPAN Used Bike Market by Bike Type

        • Standard

        • Sport

        • Cruiser

        • Touring

        • Dual-Sport

      • JAPAN Used Bike Market by Condition Type

        • Certified Pre-Owned

        • Good Condition

        • Fair Condition

        • As-Is

      • JAPAN Used Bike Market by Engine Type

        • Internal Combustion Engine

        • Electric

        • Hybrid

      • JAPAN Used Bike Market by Price Range Type

        • Below $1,000

        • $1,000 - $5,000

        • $5,000 - $10,000

        • Above $10,000

      • SOUTH KOREA Outlook (USD Billion, 2019-2035)

      • SOUTH KOREA Used Bike Market by Bike Type

        • Standard

        • Sport

        • Cruiser

        • Touring

        • Dual-Sport

      • SOUTH KOREA Used Bike Market by Condition Type

        • Certified Pre-Owned

        • Good Condition

        • Fair Condition

        • As-Is

      • SOUTH KOREA Used Bike Market by Engine Type

        • Internal Combustion Engine

        • Electric

        • Hybrid

      • SOUTH KOREA Used Bike Market by Price Range Type

        • Below $1,000

        • $1,000 - $5,000

        • $5,000 - $10,000

        • Above $10,000

      • MALAYSIA Outlook (USD Billion, 2019-2035)

      • MALAYSIA Used Bike Market by Bike Type

        • Standard

        • Sport

        • Cruiser

        • Touring

        • Dual-Sport

      • MALAYSIA Used Bike Market by Condition Type

        • Certified Pre-Owned

        • Good Condition

        • Fair Condition

        • As-Is

      • MALAYSIA Used Bike Market by Engine Type

        • Internal Combustion Engine

        • Electric

        • Hybrid

      • MALAYSIA Used Bike Market by Price Range Type

        • Below $1,000

        • $1,000 - $5,000

        • $5,000 - $10,000

        • Above $10,000

      • THAILAND Outlook (USD Billion, 2019-2035)

      • THAILAND Used Bike Market by Bike Type

        • Standard

        • Sport

        • Cruiser

        • Touring

        • Dual-Sport

      • THAILAND Used Bike Market by Condition Type

        • Certified Pre-Owned

        • Good Condition

        • Fair Condition

        • As-Is

      • THAILAND Used Bike Market by Engine Type

        • Internal Combustion Engine

        • Electric

        • Hybrid

      • THAILAND Used Bike Market by Price Range Type

        • Below $1,000

        • $1,000 - $5,000

        • $5,000 - $10,000

        • Above $10,000

      • INDONESIA Outlook (USD Billion, 2019-2035)

      • INDONESIA Used Bike Market by Bike Type

        • Standard

        • Sport

        • Cruiser

        • Touring

        • Dual-Sport

      • INDONESIA Used Bike Market by Condition Type

        • Certified Pre-Owned

        • Good Condition

        • Fair Condition

        • As-Is

      • INDONESIA Used Bike Market by Engine Type

        • Internal Combustion Engine

        • Electric

        • Hybrid

      • INDONESIA Used Bike Market by Price Range Type

        • Below $1,000

        • $1,000 - $5,000

        • $5,000 - $10,000

        • Above $10,000

      • REST OF APAC Outlook (USD Billion, 2019-2035)

      • REST OF APAC Used Bike Market by Bike Type

        • Standard

        • Sport

        • Cruiser

        • Touring

        • Dual-Sport

      • REST OF APAC Used Bike Market by Condition Type

        • Certified Pre-Owned

        • Good Condition

        • Fair Condition

        • As-Is

      • REST OF APAC Used Bike Market by Engine Type

        • Internal Combustion Engine

        • Electric

        • Hybrid

      • REST OF APAC Used Bike Market by Price Range Type

        • Below $1,000

        • $1,000 - $5,000

        • $5,000 - $10,000

        • Above $10,000

    • South America Outlook (USD Billion, 2019-2035)

      • South America Used Bike Market by Bike Type

        • Standard

        • Sport

        • Cruiser

        • Touring

        • Dual-Sport

      • South America Used Bike Market by Condition Type

        • Certified Pre-Owned

        • Good Condition

        • Fair Condition

        • As-Is

      • South America Used Bike Market by Engine Type

        • Internal Combustion Engine

        • Electric

        • Hybrid

      • South America Used Bike Market by Price Range Type

        • Below $1,000

        • $1,000 - $5,000

        • $5,000 - $10,000

        • Above $10,000

      • South America Used Bike Market by Regional Type

        • Brazil

        • Mexico

        • Argentina

        • Rest of South America

      • BRAZIL Outlook (USD Billion, 2019-2035)

      • BRAZIL Used Bike Market by Bike Type

        • Standard

        • Sport

        • Cruiser

        • Touring

        • Dual-Sport

      • BRAZIL Used Bike Market by Condition Type

        • Certified Pre-Owned

        • Good Condition

        • Fair Condition

        • As-Is

      • BRAZIL Used Bike Market by Engine Type

        • Internal Combustion Engine

        • Electric

        • Hybrid

      • BRAZIL Used Bike Market by Price Range Type

        • Below $1,000

        • $1,000 - $5,000

        • $5,000 - $10,000

        • Above $10,000

      • MEXICO Outlook (USD Billion, 2019-2035)

      • MEXICO Used Bike Market by Bike Type

        • Standard

        • Sport

        • Cruiser

        • Touring

        • Dual-Sport

      • MEXICO Used Bike Market by Condition Type

        • Certified Pre-Owned

        • Good Condition

        • Fair Condition

        • As-Is

      • MEXICO Used Bike Market by Engine Type

        • Internal Combustion Engine

        • Electric

        • Hybrid

      • MEXICO Used Bike Market by Price Range Type

        • Below $1,000

        • $1,000 - $5,000

        • $5,000 - $10,000

        • Above $10,000

      • ARGENTINA Outlook (USD Billion, 2019-2035)

      • ARGENTINA Used Bike Market by Bike Type

        • Standard

        • Sport

        • Cruiser

        • Touring

        • Dual-Sport

      • ARGENTINA Used Bike Market by Condition Type

        • Certified Pre-Owned

        • Good Condition

        • Fair Condition

        • As-Is

      • ARGENTINA Used Bike Market by Engine Type

        • Internal Combustion Engine

        • Electric

        • Hybrid

      • ARGENTINA Used Bike Market by Price Range Type

        • Below $1,000

        • $1,000 - $5,000

        • $5,000 - $10,000

        • Above $10,000

      • REST OF SOUTH AMERICA Outlook (USD Billion, 2019-2035)

      • REST OF SOUTH AMERICA Used Bike Market by Bike Type

        • Standard

        • Sport

        • Cruiser

        • Touring

        • Dual-Sport

      • REST OF SOUTH AMERICA Used Bike Market by Condition Type

        • Certified Pre-Owned

        • Good Condition

        • Fair Condition

        • As-Is

      • REST OF SOUTH AMERICA Used Bike Market by Engine Type

        • Internal Combustion Engine

        • Electric

        • Hybrid

      • REST OF SOUTH AMERICA Used Bike Market by Price Range Type

        • Below $1,000

        • $1,000 - $5,000

        • $5,000 - $10,000

        • Above $10,000

    • MEA Outlook (USD Billion, 2019-2035)

      • MEA Used Bike Market by Bike Type

        • Standard

        • Sport

        • Cruiser

        • Touring

        • Dual-Sport

      • MEA Used Bike Market by Condition Type

        • Certified Pre-Owned

        • Good Condition

        • Fair Condition

        • As-Is

      • MEA Used Bike Market by Engine Type

        • Internal Combustion Engine

        • Electric

        • Hybrid

      • MEA Used Bike Market by Price Range Type

        • Below $1,000

        • $1,000 - $5,000

        • $5,000 - $10,000

        • Above $10,000

      • MEA Used Bike Market by Regional Type

        • GCC Countries

        • South Africa

        • Rest of MEA

      • GCC COUNTRIES Outlook (USD Billion, 2019-2035)

      • GCC COUNTRIES Used Bike Market by Bike Type

        • Standard

        • Sport

        • Cruiser

        • Touring

        • Dual-Sport

      • GCC COUNTRIES Used Bike Market by Condition Type

        • Certified Pre-Owned

        • Good Condition

        • Fair Condition

        • As-Is

      • GCC COUNTRIES Used Bike Market by Engine Type

        • Internal Combustion Engine

        • Electric

        • Hybrid

      • GCC COUNTRIES Used Bike Market by Price Range Type

        • Below $1,000

        • $1,000 - $5,000

        • $5,000 - $10,000

        • Above $10,000

      • SOUTH AFRICA Outlook (USD Billion, 2019-2035)

      • SOUTH AFRICA Used Bike Market by Bike Type

        • Standard

        • Sport

        • Cruiser

        • Touring

        • Dual-Sport

      • SOUTH AFRICA Used Bike Market by Condition Type

        • Certified Pre-Owned

        • Good Condition

        • Fair Condition

        • As-Is

      • SOUTH AFRICA Used Bike Market by Engine Type

        • Internal Combustion Engine

        • Electric

        • Hybrid

      • SOUTH AFRICA Used Bike Market by Price Range Type

        • Below $1,000

        • $1,000 - $5,000

        • $5,000 - $10,000

        • Above $10,000

      • REST OF MEA Outlook (USD Billion, 2019-2035)

      • REST OF MEA Used Bike Market by Bike Type

        • Standard

        • Sport

        • Cruiser

        • Touring

        • Dual-Sport

      • REST OF MEA Used Bike Market by Condition Type

        • Certified Pre-Owned

        • Good Condition

        • Fair Condition

        • As-Is

      • REST OF MEA Used Bike Market by Engine Type

        • Internal Combustion Engine

        • Electric

        • Hybrid

      • REST OF MEA Used Bike Market by Price Range Type

        • Below $1,000

        • $1,000 - $5,000

        • $5,000 - $10,000

        • Above $10,000

    Infographic

    Free Sample Request

    Kindly complete the form below to receive a free sample of this Report

    Get Free Sample

    Customer Strories

    “I am very pleased with how market segments have been defined in a relevant way for my purposes (such as "Portable Freezers & refrigerators" and "last-mile"). In general the report is well structured. Thanks very much for your efforts.”

    Victoria Milne

    Founder
    Case Study
    Chemicals and Materials