Used Bike Market Summary
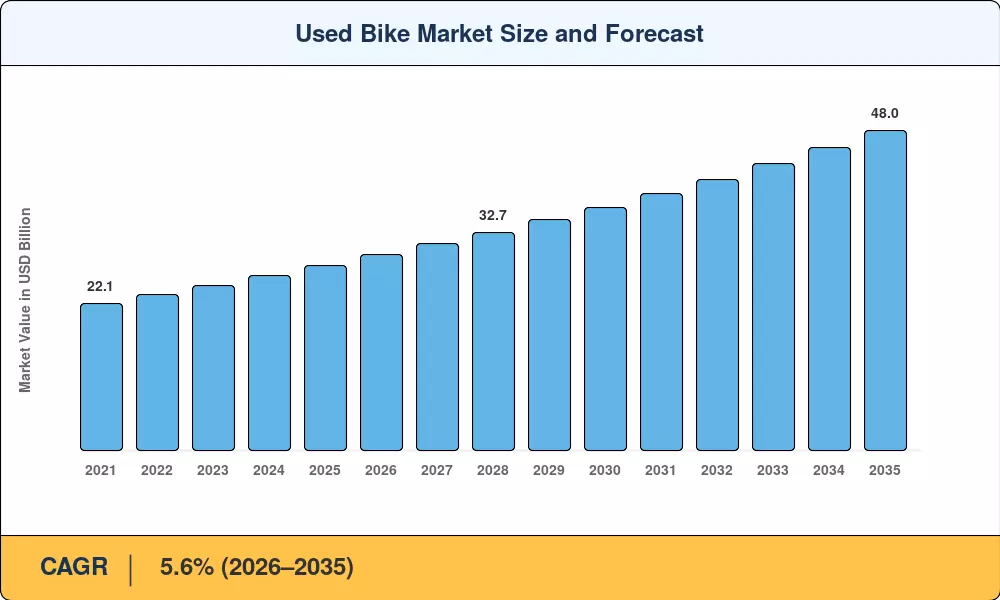
The Used Bike Market reached an estimated USD 27.8 billion in 2025 and is projected to grow from USD 29.4 billion in 2026 to USD 48.0 billion by 2035, registering a compound annual growth rate of 5.6% during 2026–2035. Two forces are accelerating this trajectory: rising new-vehicle costs that push cost-conscious riders toward pre-owned alternatives, and government-backed scrappage and trade-in programs across India, Southeast Asia, and the European Union that formalize used two-wheeler transactions [1]. The affordability argument alone would be sufficient, but structured policy incentives are turning the Used Bike Market from an informal bazaar into a regulated, transparent ecosystem.
A technology shift is reshaping how pre-owned motorcycles and scooters change hands. Legacy dealer-lot transactions — often opaque on pricing and vehicle history — are giving way to digital platforms that integrate AI-powered condition grading, blockchain-backed ownership records, and real-time pricing algorithms. India's Ministry of Road Transport & Highways mandated digital vehicle transfer documentation in 2024, a move that funneled an additional 1.2 million annual transactions into organized channels [2]. Similar digital-first mandates in Vietnam and Indonesia are compressing the informal-to-formal transition timeline across emerging Asia.
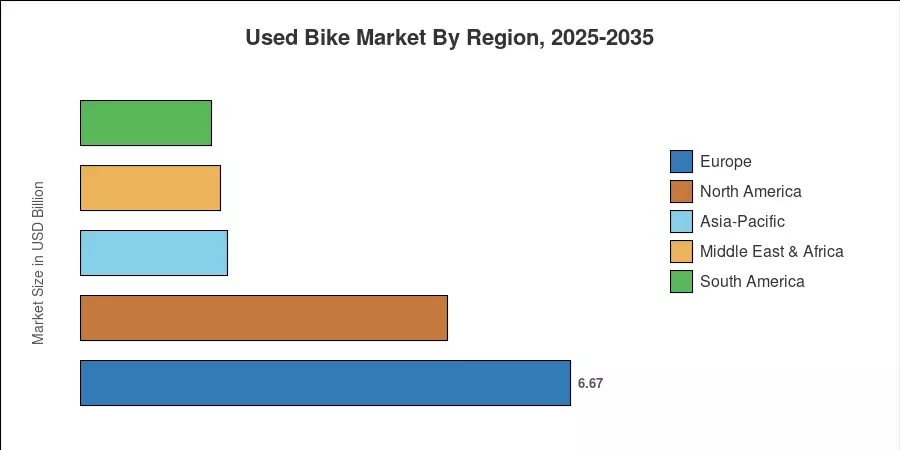
Asia-Pacific dominates the Used Bike Market with approximately 42% of global revenue, driven by massive two-wheeler populations in India, China, and ASEAN nations. The region is also the fastest-growing at a projected 7.2% CAGR through 2035. Europe holds the second-largest share at roughly 24%, supported by stringent Euro 5 emission norms that accelerate fleet turnover. North America accounts for about 18%, anchored by a strong recreational and cruiser resale culture. As digital transaction infrastructure matures across South America and the Middle East, new pockets of organized demand will reshape the competitive map of the Used Bike Market over the coming decade.
Key Report Takeaways
• By Vehicle Type
- Standard and commuter motorcycles command the largest share of the Used Bike Market at approximately 38% of global revenue, reflecting mass-market affordability demand.
- Sport bikes are the fastest-growing type segment with a projected 6.8% CAGR, fueled by aspirational buyers entering the segment at lower price points.
• By Sales Channel
- Offline dealerships still account for roughly 55% of used two-wheeler transactions globally, though their share is declining year-on-year.
- Online platforms are expanding at a 9.1% CAGR, the highest among all channel segments in the Used Bike Market.
• By Region
- Asia-Pacific generates approximately USD 11.7 billion in annual Used Bike Market revenue, more than double that of any other single region.
- Europe holds a 24% global share, with Germany and the United Kingdom collectively representing over half of regional demand.
- South America is projected to grow at a 6.4% CAGR, led by Brazil's expanding middle-class two-wheeler adoption.
Market Size and Forecast (2021–2035)
Data in this section combines primary dealer surveys across 14 countries, OEM trade-in program disclosures, and digital-platform transaction data triangulated against government vehicle registration databases. Historical figures (2021–2024) reflect audited actuals; the base year 2025 is estimated; forecast years 2026–2035 apply a constant CAGR adjusted for anticipated regulatory and macroeconomic events [3].