Used Bike Market

ID: MRFR/AT/10740-HCR
128 Pages
Shubham Munde
Last Updated: June 17, 2026
Used Bike Market Size, Share & Growth Analysis Report By Vehicle Type (Standard / Commuter, Sport, Cruiser, Scooter / Moped, Adventure / Touring), By Sales Channel (Offline Dealerships, Online Platforms, Peer-to-Peer), By Engine Capacity (Up to 150 cc, 151–500 cc, 501–1,000 cc, Above 1,000 cc), and By Regional (North America, Europe, South America, Asia Pacific, Middle East and Africa) - Industry Growth & Forecast to 2035
Download PDF ×

We do not share your information with anyone. However, we may send you emails based on your report interest from time to time. You may contact us at any time to opt-out.

  1. 1 Market Overview |
    1. 1.1 Study Assumptions & Market Definition |
    2. 1.2 Scope of the Study |
    3. 1.3 Research Methodology
  2. 2 Market Summary & Key Takeaways
  3. 3 Market Dynamics |
    1. 3.1 Market Drivers Analysis | |
      1. 3.1.1 Rising New-Bike Prices | |
      2. 3.1.2 Digital Platform Proliferation | |
      3. 3.1.3 Government Scrappage and Trade-In Incentives | |
      4. 3.1.4 Urbanization and Commuter Demand | |
      5. 3.1.5 Expanding Financing Options for Pre-Owned Vehicles | |
      6. 3.1.6 Growing Recreational Riding Culture | |
      7. 3.1.7 Sustainability and Circular-Economy Awareness |
    2. 3.2 Market Restraints Analysis | |
      1. 3.2.1 Lack of Standardized Inspection Frameworks | |
      2. 3.2.2 Depreciation Uncertainty for Electric Two-Wheelers | |
      3. 3.2.3 Fragmented Regulatory Environments | |
      4. 3.2.4 Consumer Trust Deficit in Informal Channels | |
      5. 3.2.5 Insurance and Warranty Limitations |
    3. 3.3 Market Opportunity Analysis | |
      1. 3.3.1 Certified Pre-Owned Programs by OEMs | |
      2. 3.3.2 Digital Ecosystem Integration | |
      3. 3.3.3 Emerging-Market Formalization | |
      4. 3.3.4 Data Monetization and Analytics Services | |
      5. 3.3.5 Electric Two-Wheeler Resale Infrastructure |
    4. 3.4 Industry Value Chain Analysis |
    5. 3.5 Porter's Five Forces Analysis
  4. 4 Global Used Bike Market Size & Forecast (2021–2035) |
    1. 4.1 Historical Market Size (2021–2025) |
    2. 4.2 Current & Forecast Market Size (2026–2035) |
    3. 4.3 Market Size by Revenue (USD Billion) |
    4. 4.4 Year-over-Year Growth Analysis
  5. 5 Segmentation Analysis |
    1. 5.1 By Vehicle Type | |
      1. 5.1.1 Standard / Commuter | |
      2. 5.1.2 Sport | |
      3. 5.1.3 Cruiser | |
      4. 5.1.4 Scooter / Moped | |
      5. 5.1.5 Adventure / Touring |
    2. 5.2 By Sales Channel | |
      1. 5.2.1 Offline Dealerships | |
      2. 5.2.2 Online Platforms | |
      3. 5.2.3 Peer-to-Peer |
    3. 5.3 By Engine Capacity | |
      1. 5.3.1 Up to 150 cc | |
      2. 5.3.2 151–500 cc | |
      3. 5.3.3 501–1,000 cc | |
      4. 5.3.4 Above 1,000 cc
  6. 6 Regional Analysis |
    1. 6.1 Asia-Pacific | |
      1. 6.1.1 India | |
      2. 6.1.2 China | |
      3. 6.1.3 Indonesia | |
      4. 6.1.4 Vietnam | |
      5. 6.1.5 Rest of Asia-Pacific |
    2. 6.2 Europe | |
      1. 6.2.1 Germany | |
      2. 6.2.2 United Kingdom | |
      3. 6.2.3 France | |
      4. 6.2.4 Italy | |
      5. 6.2.5 Rest of Europe |
    3. 6.3 North America | |
      1. 6.3.1 United States | |
      2. 6.3.2 Canada | |
      3. 6.3.3 Mexico |
    4. 6.4 South America | |
      1. 6.4.1 Brazil | |
      2. 6.4.2 Colombia | |
      3. 6.4.3 Rest of South America |
    5. 6.5 Middle East & Africa | |
      1. 6.5.1 Nigeria | |
      2. 6.5.2 Kenya | |
      3. 6.5.3 South Africa | |
      4. 6.5.4 Rest of MEA
  7. 7 Competitive Landscape |
    1. 7.1 Market Share Analysis (2025) |
    2. 7.2 Competitive Benchmarking Matrix |
    3. 7.3 Company Profiles | |
      1. 7.3.1 CredR | |
      2. 7.3.2 Droom | |
      3. 7.3.3 BikeWale (CarWale) | |
      4. 7.3.4 RumbleOn | |
      5. 7.3.5 Cycle Trader (Trader Interactive) | |
      6. 7.3.6 AutoScout24 | |
      7. 7.3.7 Hero MotoCorp (Hero Sure) | |
      8. 7.3.8 Honda 2-Wheelers India (H-Promise) | |
      9. 7.3.9 OLX Autos | |
      10. 7.3.10 MAX
  8. 8 Future Outlook & Strategic Recommendations (2026–2035) |
    1. 8.1 AI-Powered Pricing and Condition Assessment |
    2. 8.2 Platform Consolidation and Network Effects |
    3. 8.3 Electrification and the Secondary Battery Economy |
    4. 8.4 Sustainability Reporting and Circular-Economy Mandates
  9. 9 Recent Developments & News
  10. 10 Frequently Asked Questions (FAQs)
  11. 11 Report Scope & Methodology |
    1. 11.1 Study Period & Base Year |
    2. 11.2 Data Sources & Citations |
    3. 11.3 Abbreviations
  12. 12 LIST OF TABLES |
  13. TABLE 1 Global Used Bike Market Size & Forecast, by Revenue (USD Billion), 2021–2035 |
  14. TABLE 2 Global Used Bike Market — Year-over-Year Growth Analysis, 2021–2035 |
  15. TABLE 3 Global Used Bike Market — Driver Impact Analysis |
  16. TABLE 4 Global Used Bike Market — Restraint Impact Analysis |
  17. TABLE 5 Global Used Bike Market Size, by Vehicle Type, 2021–2035 (USD Billion) |
  18. TABLE 6 Global Used Bike Market Size, by Sales Channel, 2021–2035 (USD Billion) |
  19. TABLE 7 Global Used Bike Market Size, by Engine Capacity, 2021–2035 (USD Billion) |
  20. TABLE 8 Global Used Bike Market Size, by Region, 2021–2035 (USD Billion) |
  21. TABLE 9 Asia-Pacific Used Bike Market Size, by Country, 2021–2035 (USD Billion) |
  22. TABLE 10 Europe Used Bike Market Size, by Country, 2021–2035 (USD Billion) |
  23. TABLE 11 North America Used Bike Market Size, by Country, 2021–2035 (USD Billion) |
  24. TABLE 12 South America Used Bike Market Size, by Country, 2021–2035 (USD Billion) |
  25. TABLE 13 Middle East & Africa Used Bike Market Size, by Country, 2021–2035 (USD Billion) |
  26. TABLE 14 Competitive Benchmarking Matrix — Global Used Bike Market, 2025 |
  27. TABLE 15 Company Profiles — Key Players, Global Used Bike Market |
  28. TABLE 16 Recent Developments & Strategic Announcements, 2023–2025 |
  29. TABLE 17 Report Scope & Methodology Summary |
  30. TABLE 18 Detailed Sources and Citations |
  31. TABLE 19 Asia-Pacific Used Bike Market Size, by Vehicle Type, 2021–2035 (USD Billion) |
  32. TABLE 20 Asia-Pacific Used Bike Market Size, by Sales Channel, 2021–2035 (USD Billion) |
  33. TABLE 21 Asia-Pacific Used Bike Market Size, by Engine Capacity, 2021–2035 (USD Billion) |
  34. TABLE 22 Europe Used Bike Market Size, by Vehicle Type, 2021–2035 (USD Billion) |
  35. TABLE 23 Europe Used Bike Market Size, by Sales Channel, 2021–2035 (USD Billion) |
  36. TABLE 24 Europe Used Bike Market Size, by Engine Capacity, 2021–2035 (USD Billion) |
  37. TABLE 25 North America Used Bike Market Size, by Vehicle Type, 2021–2035 (USD Billion) |
  38. TABLE 26 North America Used Bike Market Size, by Sales Channel, 2021–2035 (USD Billion) |
  39. TABLE 27 North America Used Bike Market Size, by Engine Capacity, 2021–2035 (USD Billion) |
  40. TABLE 28 South America Used Bike Market Size, by Vehicle Type, 2021–2035 (USD Billion) |
  41. TABLE 29 South America Used Bike Market Size, by Sales Channel, 2021–2035 (USD Billion) |
  42. TABLE 30 South America Used Bike Market Size, by Engine Capacity, 2021–2035 (USD Billion) |
  43. TABLE 31 Middle East & Africa Used Bike Market Size, by Vehicle Type, 2021–2035 (USD Billion) |
  44. TABLE 32 Middle East & Africa Used Bike Market Size, by Sales Channel, 2021–2035 (USD Billion) |
  45. TABLE 33 Middle East & Africa Used Bike Market Size, by Engine Capacity, 2021–2035 (USD Billion) |
  46. TABLE 34 India Used Bike Market Size, by Vehicle Type, 2021–2035 (USD Billion) |
  47. TABLE 35 India Used Bike Market Size, by Sales Channel, 2021–2035 (USD Billion) |
  48. TABLE 36 India Used Bike Market Size, by Engine Capacity, 2021–2035 (USD Billion) |
  49. TABLE 37 China Used Bike Market Size, by Vehicle Type, 2021–2035 (USD Billion) |
  50. TABLE 38 China Used Bike Market Size, by Sales Channel, 2021–2035 (USD Billion) |
  51. TABLE 39 China Used Bike Market Size, by Engine Capacity, 2021–2035 (USD Billion) |
  52. TABLE 40 Indonesia Used Bike Market Size, by Vehicle Type, 2021–2035 (USD Billion) |
  53. TABLE 41 Indonesia Used Bike Market Size, by Sales Channel, 2021–2035 (USD Billion) |
  54. TABLE 42 Indonesia Used Bike Market Size, by Engine Capacity, 2021–2035 (USD Billion) |
  55. TABLE 43 Germany Used Bike Market Size, by Vehicle Type, 2021–2035 (USD Billion) |
  56. TABLE 44 Germany Used Bike Market Size, by Sales Channel, 2021–2035 (USD Billion) |
  57. TABLE 45 Germany Used Bike Market Size, by Engine Capacity, 2021–2035 (USD Billion) |
  58. TABLE 46 United Kingdom Used Bike Market Size, by Vehicle Type, 2021–2035 (USD Billion) |
  59. TABLE 47 United Kingdom Used Bike Market Size, by Sales Channel, 2021–2035 (USD Billion) |
  60. TABLE 48 United Kingdom Used Bike Market Size, by Engine Capacity, 2021–2035 (USD Billion) |
  61. TABLE 49 United States Used Bike Market Size, by Vehicle Type, 2021–2035 (USD Billion) |
  62. TABLE 50 United States Used Bike Market Size, by Sales Channel, 2021–2035 (USD Billion) |
  63. TABLE 51 United States Used Bike Market Size, by Engine Capacity, 2021–2035 (USD Billion) |
  64. TABLE 52 Brazil Used Bike Market Size, by Vehicle Type, 2021–2035 (USD Billion) |
  65. TABLE 53 Brazil Used Bike Market Size, by Sales Channel, 2021–2035 (USD Billion) |
  66. TABLE 54 Brazil Used Bike Market Size, by Engine Capacity, 2021–2035 (USD Billion) |
  67. TABLE 55 Nigeria Used Bike Market Size, by Vehicle Type, 2021–2035 (USD Billion) |
  68. TABLE 56 Nigeria Used Bike Market Size, by Sales Channel, 2021–2035 (USD Billion) |
  69. TABLE 57 Nigeria Used Bike Market Size, by Engine Capacity, 2021–2035 (USD Billion)
  70. 13 LIST OF FIGURES |
  71. FIGURE 1 Used Bike Market — Market Dynamics Overview |
  72. FIGURE 2 Used Bike Market — Value Chain Analysis |
  73. FIGURE 3 Used Bike Market — Porter's Five Forces Analysis |
  74. FIGURE 4 Global Used Bike Market Size & Forecast Trend (USD Billion), 2021–2035 |
  75. FIGURE 5 Global Used Bike Market Share, by Vehicle Type (%), 2025 |
  76. FIGURE 6 Global Used Bike Market Share, by Sales Channel (%), 2025 |
  77. FIGURE 7 Global Used Bike Market Share, by Engine Capacity (%), 2025 |
  78. FIGURE 8 Global Used Bike Market Share, by Region (%), 2025 |
  79. FIGURE 9 Asia-Pacific Used Bike Market Size Trend (USD Billion), 2021–2035 |
  80. FIGURE 10 Europe Used Bike Market Size Trend (USD Billion), 2021–2035 |
  81. FIGURE 11 North America Used Bike Market Size Trend (USD Billion), 2021–2035 |
  82. FIGURE 12 South America Used Bike Market Size Trend (USD Billion), 2021–2035 |
  83. FIGURE 13 Middle East & Africa Used Bike Market Size Trend (USD Billion), 2021–2035 |
  84. FIGURE 14 Competitive Landscape — Market Share Distribution (%), 2025 |
  85. FIGURE 15 Competitive Positioning Matrix — Key Players, 2025

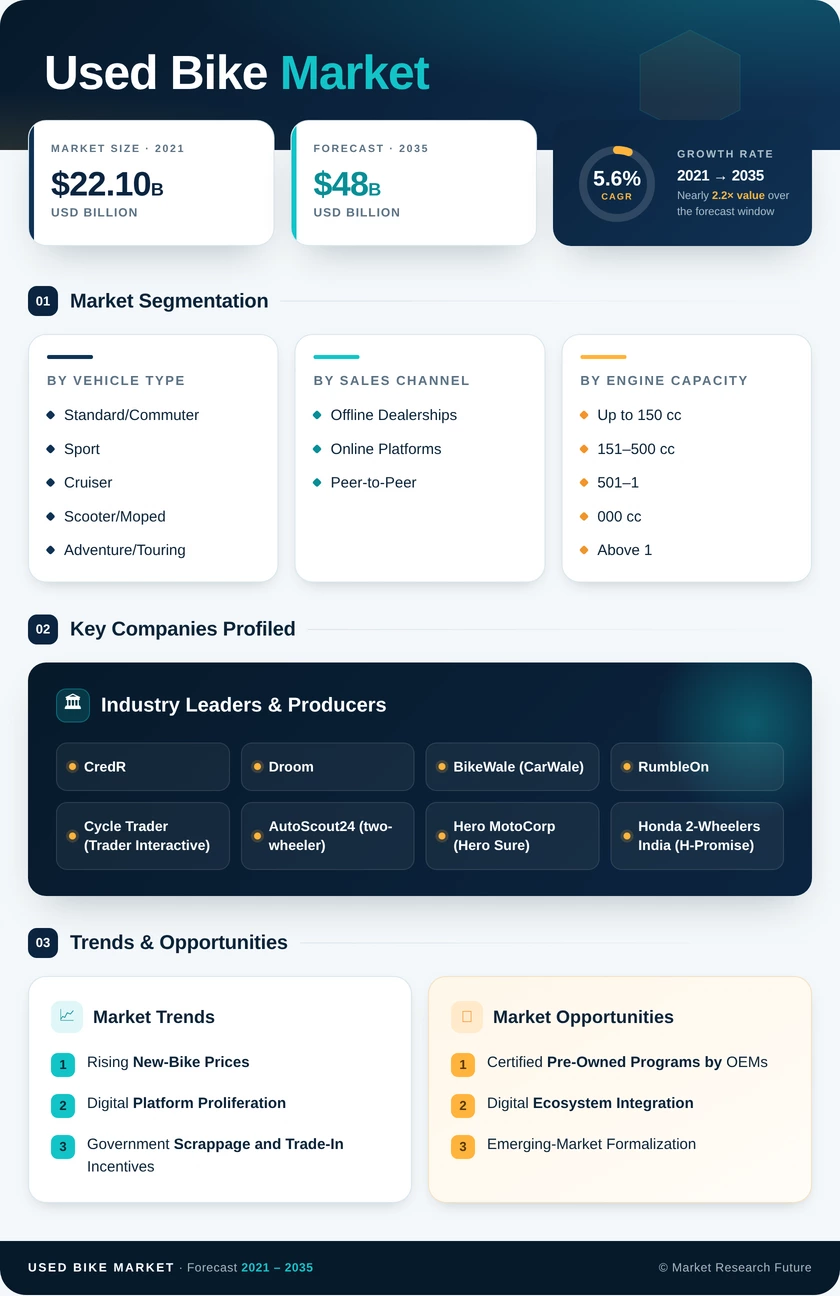
Segmentation Quick Reference

DimensionSub-SegmentsDominant SegmentFastest Growing Segment
By Vehicle TypeStandard/Commuter, Sport, Cruiser, Scooter/Moped, Adventure/TouringStandard / Commuter (~38% share)Sport (6.8% CAGR)
By Sales ChannelOffline Dealerships, Online Platforms, Peer-to-PeerOffline Dealerships (~55% share)Online Platforms (9.1% CAGR)
By Engine CapacityUp to 150 cc, 151–500 cc, 501–1,000 cc, Above 1,000 ccUp to 150 cc (~35% share)151–500 cc (5.9% CAGR)


Market Segmentation Overview

By Vehicle Type

Sub-SegmentKey Trend
Standard / CommuterLargest volume segment driven by daily mobility needs in price-sensitive markets
SportFastest-growing type as aspirational buyers access performance at steep discounts to new
CruiserStrong resale values anchored by brand loyalty in North America and Europe
Scooter / MopedExpanding in urban cores where congestion and parking constraints favor compact formats
Adventure / TouringRising recreational demand and long-distance touring culture are fueling secondary turnover


Standard and commuter motorcycles dominate the Used Bike Market by unit volume, reflecting the global base of everyday riders who prioritize affordability and fuel efficiency. Sport bikes are gaining ground as younger demographics enter the performance segment through the pre-owned channel rather than buying new.

By Sales Channel

Sub-SegmentKey Trend
Offline DealershipsRetaining the majority share through physical inspection, trust, and trade-in convenience
Online PlatformsRapidly growing through AI pricing, integrated financing, and logistics services
Peer-to-PeerSignificant in informal economies but gradually yielding to organized digital channels


Offline dealerships continue to process the majority of transactions, but online platforms are compressing the experience from weeks to days through end-to-end digital journeys that bundle pricing, financing, and delivery.

By Engine Capacity

Sub-SegmentKey Trend
Up to 150 ccThe highest volume segment is driven by entry-level commuting across Asia and South America
151–500 ccFastest-growing capacity band as riders seek versatile mid-displacement motorcycles
501–1,000 ccPremium performance segment with strong resale retention in mature markets
Above 1,000 ccNiche but high-value segment anchored by touring and classic motorcycle enthusiasts


The sub-150 cc category accounts for the largest share of used two-wheeler transactions globally. Mid-displacement motorcycles in the 151–500 cc range are growing fastest as they serve both commuting and recreational use cases, attracting buyers who are upgrading from entry-level models.