Request Free Sample ×

Kindly complete the form below to receive a free sample of this Report

* Please use a valid business email

Leading companies partner with us for data-driven Insights

clients tt-cursor
Hero Background

US Tonsil Cancer Market

ID: MRFR/Pharma/18514-HCR
100 Pages
Satyendra Maurya
Last Updated: April 06, 2026

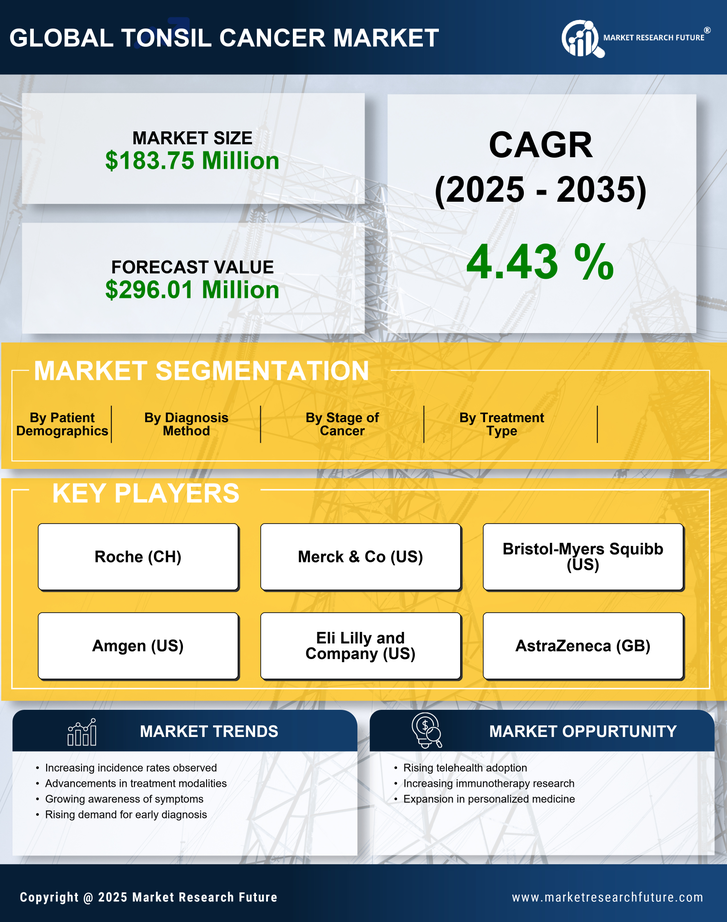
US Tonsil Cancer Market Research Report By Type (squamous cell carcinoma, salivary gland cancer, lymphoma, mucosal melanoma, sarcomas, malignant fibrous histiocytoma, Peripheral Neuroectodermal Tumor (PNET), others, chondrosarcoma, liposarcoma, synovial sarcoma), By Diagnosis (physical exam, imaging tests, removing a sample of tissue for testing, Computerized Tomography (CT), Magnetic Resonance Imaging (MRI), Positron Emission Tomography (PET), others), By Treatments (surgery, radiation therapy, chemotherapy, rehabilitation, transoral surgery, transoral robotic surgery, open surgery, reconstructive surgery, external beam radiation therapy, internal radiation therapy, alkylating agents, plant alkaloids, antitumor antibiotics, antimetabolites, topoisomerase inhibitors, miscellaneous antineoplastics, others) and By End User (hospitals & clinics, medical research centers, academic institutes, others) - Growth & Industry Forecast 2025 To 2035

Share:
Download PDF ×

We do not share your information with anyone. However, we may send you emails based on your report interest from time to time. You may contact us at any time to opt-out.

  1. 1 SECTION I: EXECUTIVE SUMMARY AND KEY HIGHLIGHTS
    1. 1.1 EXECUTIVE SUMMARY
      1. 1.1.1 Market Overview
      2. 1.1.2 Key Findings
      3. 1.1.3 Market Segmentation
      4. 1.1.4 Competitive Landscape
      5. 1.1.5 Challenges and Opportunities
      6. 1.1.6 Future Outlook
  2. 2 SECTION II: SCOPING, METHODOLOGY AND MARKET STRUCTURE
    1. 2.1 MARKET INTRODUCTION
      1. 2.1.1 Definition
      2. 2.1.2 Scope of the study
        1. 2.1.2.1 Research Objective
        2. 2.1.2.2 Assumption
        3. 2.1.2.3 Limitations
    2. 2.2 RESEARCH METHODOLOGY
      1. 2.2.1 Overview
      2. 2.2.2 Data Mining
      3. 2.2.3 Secondary Research
      4. 2.2.4 Primary Research
        1. 2.2.4.1 Primary Interviews and Information Gathering Process
        2. 2.2.4.2 Breakdown of Primary Respondents
      5. 2.2.5 Forecasting Model
      6. 2.2.6 Market Size Estimation
        1. 2.2.6.1 Bottom-Up Approach
        2. 2.2.6.2 Top-Down Approach
      7. 2.2.7 Data Triangulation
      8. 2.2.8 Validation
  3. 3 SECTION III: QUALITATIVE ANALYSIS
    1. 3.1 MARKET DYNAMICS
      1. 3.1.1 Overview
      2. 3.1.2 Drivers
      3. 3.1.3 Restraints
      4. 3.1.4 Opportunities
    2. 3.2 MARKET FACTOR ANALYSIS
      1. 3.2.1 Value chain Analysis
      2. 3.2.2 Porter's Five Forces Analysis
        1. 3.2.2.1 Bargaining Power of Suppliers
        2. 3.2.2.2 Bargaining Power of Buyers
        3. 3.2.2.3 Threat of New Entrants
        4. 3.2.2.4 Threat of Substitutes
        5. 3.2.2.5 Intensity of Rivalry
      3. 3.2.3 COVID-19 Impact Analysis
        1. 3.2.3.1 Market Impact Analysis
        2. 3.2.3.2 Regional Impact
        3. 3.2.3.3 Opportunity and Threat Analysis
  4. 4 SECTION IV: QUANTITATIVE ANALYSIS
    1. 4.1 Pharmaceutical, BY Diagnosis Method (USD Million)
      1. 4.1.1 Imaging Techniques
      2. 4.1.2 Biopsy
      3. 4.1.3 Blood Tests
      4. 4.1.4 Endoscopy
    2. 4.2 Pharmaceutical, BY Treatment Type (USD Million)
      1. 4.2.1 Surgery
      2. 4.2.2 Radiation Therapy
      3. 4.2.3 Chemotherapy
      4. 4.2.4 Immunotherapy
    3. 4.3 Pharmaceutical, BY Stage of Cancer (USD Million)
      1. 4.3.1 Localized
      2. 4.3.2 Regional
      3. 4.3.3 Distant
    4. 4.4 Pharmaceutical, BY Patient Demographics (USD Million)
      1. 4.4.1 Age Group
      2. 4.4.2 Gender
      3. 4.4.3 Socioeconomic Status
  5. 5 SECTION V: COMPETITIVE ANALYSIS
    1. 5.1 Competitive Landscape
      1. 5.1.1 Overview
      2. 5.1.2 Competitive Analysis
      3. 5.1.3 Market share Analysis
      4. 5.1.4 Major Growth Strategy in the Pharmaceutical
      5. 5.1.5 Competitive Benchmarking
      6. 5.1.6 Leading Players in Terms of Number of Developments in the Pharmaceutical
      7. 5.1.7 Key developments and growth strategies
        1. 5.1.7.1 New Product Launch/Service Deployment
        2. 5.1.7.2 Merger & Acquisitions
        3. 5.1.7.3 Joint Ventures
      8. 5.1.8 Major Players Financial Matrix
        1. 5.1.8.1 Sales and Operating Income
        2. 5.1.8.2 Major Players R&D Expenditure. 2023
    2. 5.2 Company Profiles
      1. 5.2.1 Roche (CH)
        1. 5.2.1.1 Financial Overview
        2. 5.2.1.2 Products Offered
        3. 5.2.1.3 Key Developments
        4. 5.2.1.4 SWOT Analysis
        5. 5.2.1.5 Key Strategies
      2. 5.2.2 Merck & Co (US)
        1. 5.2.2.1 Financial Overview
        2. 5.2.2.2 Products Offered
        3. 5.2.2.3 Key Developments
        4. 5.2.2.4 SWOT Analysis
        5. 5.2.2.5 Key Strategies
      3. 5.2.3 Bristol-Myers Squibb (US)
        1. 5.2.3.1 Financial Overview
        2. 5.2.3.2 Products Offered
        3. 5.2.3.3 Key Developments
        4. 5.2.3.4 SWOT Analysis
        5. 5.2.3.5 Key Strategies
      4. 5.2.4 Amgen (US)
        1. 5.2.4.1 Financial Overview
        2. 5.2.4.2 Products Offered
        3. 5.2.4.3 Key Developments
        4. 5.2.4.4 SWOT Analysis
        5. 5.2.4.5 Key Strategies
      5. 5.2.5 Eli Lilly and Company (US)
        1. 5.2.5.1 Financial Overview
        2. 5.2.5.2 Products Offered
        3. 5.2.5.3 Key Developments
        4. 5.2.5.4 SWOT Analysis
        5. 5.2.5.5 Key Strategies
      6. 5.2.6 AstraZeneca (GB)
        1. 5.2.6.1 Financial Overview
        2. 5.2.6.2 Products Offered
        3. 5.2.6.3 Key Developments
        4. 5.2.6.4 SWOT Analysis
        5. 5.2.6.5 Key Strategies
      7. 5.2.7 Novartis (CH)
        1. 5.2.7.1 Financial Overview
        2. 5.2.7.2 Products Offered
        3. 5.2.7.3 Key Developments
        4. 5.2.7.4 SWOT Analysis
        5. 5.2.7.5 Key Strategies
      8. 5.2.8 Pfizer (US)
        1. 5.2.8.1 Financial Overview
        2. 5.2.8.2 Products Offered
        3. 5.2.8.3 Key Developments
        4. 5.2.8.4 SWOT Analysis
        5. 5.2.8.5 Key Strategies
      9. 5.2.9 GSK (GB)
        1. 5.2.9.1 Financial Overview
        2. 5.2.9.2 Products Offered
        3. 5.2.9.3 Key Developments
        4. 5.2.9.4 SWOT Analysis
        5. 5.2.9.5 Key Strategies
    3. 5.3 Appendix
      1. 5.3.1 References
      2. 5.3.2 Related Reports
  6. 6 LIST OF FIGURES
    1. 6.1 MARKET SYNOPSIS
    2. 6.2 US MARKET ANALYSIS BY DIAGNOSIS METHOD
    3. 6.3 US MARKET ANALYSIS BY TREATMENT TYPE
    4. 6.4 US MARKET ANALYSIS BY STAGE OF CANCER
    5. 6.5 US MARKET ANALYSIS BY PATIENT DEMOGRAPHICS
    6. 6.6 KEY BUYING CRITERIA OF PHARMACEUTICAL
    7. 6.7 RESEARCH PROCESS OF MRFR
    8. 6.8 DRO ANALYSIS OF PHARMACEUTICAL
    9. 6.9 DRIVERS IMPACT ANALYSIS: PHARMACEUTICAL
    10. 6.10 RESTRAINTS IMPACT ANALYSIS: PHARMACEUTICAL
    11. 6.11 SUPPLY / VALUE CHAIN: PHARMACEUTICAL
    12. 6.12 PHARMACEUTICAL, BY DIAGNOSIS METHOD, 2024 (% SHARE)
    13. 6.13 PHARMACEUTICAL, BY DIAGNOSIS METHOD, 2024 TO 2035 (USD Million)
    14. 6.14 PHARMACEUTICAL, BY TREATMENT TYPE, 2024 (% SHARE)
    15. 6.15 PHARMACEUTICAL, BY TREATMENT TYPE, 2024 TO 2035 (USD Million)
    16. 6.16 PHARMACEUTICAL, BY STAGE OF CANCER, 2024 (% SHARE)
    17. 6.17 PHARMACEUTICAL, BY STAGE OF CANCER, 2024 TO 2035 (USD Million)
    18. 6.18 PHARMACEUTICAL, BY PATIENT DEMOGRAPHICS, 2024 (% SHARE)
    19. 6.19 PHARMACEUTICAL, BY PATIENT DEMOGRAPHICS, 2024 TO 2035 (USD Million)
    20. 6.20 BENCHMARKING OF MAJOR COMPETITORS
  7. 7 LIST OF TABLES
    1. 7.1 LIST OF ASSUMPTIONS
  8. 7.1.1
    1. 7.2 US MARKET SIZE ESTIMATES; FORECAST
      1. 7.2.1 BY DIAGNOSIS METHOD, 2025-2035 (USD Million)
      2. 7.2.2 BY TREATMENT TYPE, 2025-2035 (USD Million)
      3. 7.2.3 BY STAGE OF CANCER, 2025-2035 (USD Million)
      4. 7.2.4 BY PATIENT DEMOGRAPHICS, 2025-2035 (USD Million)
    2. 7.3 PRODUCT LAUNCH/PRODUCT DEVELOPMENT/APPROVAL
  9. 7.3.1
    1. 7.4 ACQUISITION/PARTNERSHIP
  10. 7.4.1

US Pharmaceutical Market Segmentation

Pharmaceutical By Diagnosis Method (USD Million, 2025-2035)

  • Imaging Techniques
  • Biopsy
  • Blood Tests
  • Endoscopy

Pharmaceutical By Treatment Type (USD Million, 2025-2035)

  • Surgery
  • Radiation Therapy
  • Chemotherapy
  • Immunotherapy

Pharmaceutical By Stage of Cancer (USD Million, 2025-2035)

  • Localized
  • Regional
  • Distant

Pharmaceutical By Patient Demographics (USD Million, 2025-2035)

  • Age Group
  • Gender
  • Socioeconomic Status

Compare Licence

×
Features License Type
Single User Multiuser License Enterprise User
Price $4,950 $5,950 $7,250
Maximum User Access Limit 1 User Upto 10 Users Unrestricted Access Throughout the Organization
Free Customization
Direct Access to Analyst
Deliverable Format
Platform Access
Discount on Next Purchase 10% 15% 15%
Printable Versions