

US Food, Beverages & Nutrition Market Segmentation
Food, Beverages & Nutrition By Type (USD Million, 2025-2035)
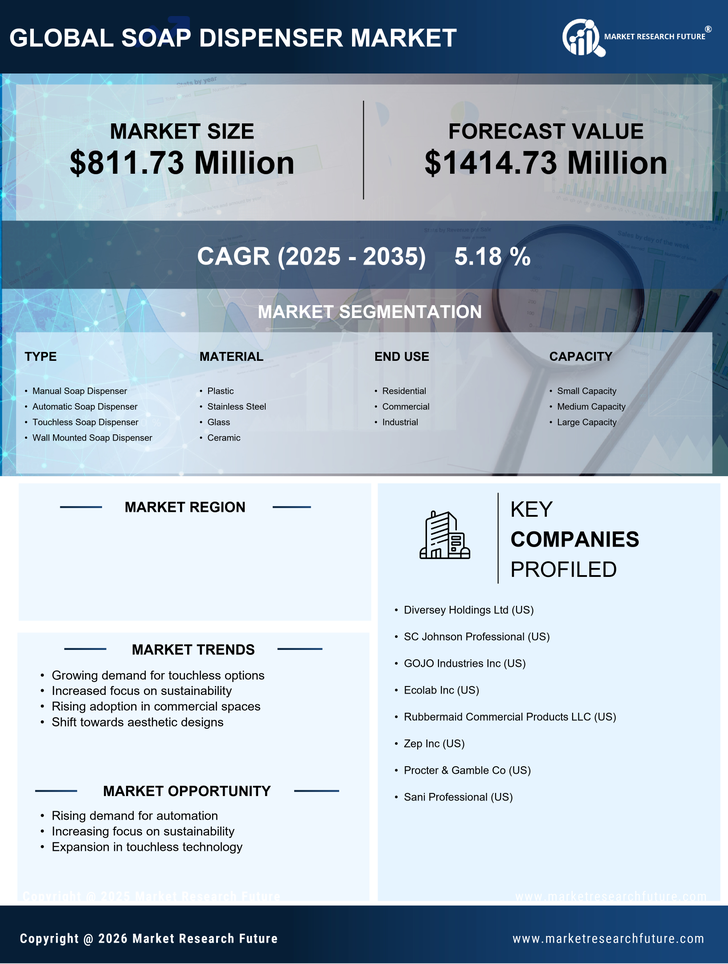
- Manual Soap Dispenser
- Automatic Soap Dispenser
- Touchless Soap Dispenser
- Wall Mounted Soap Dispenser
Food, Beverages & Nutrition By Material (USD Million, 2025-2035)
- Plastic
- Stainless Steel
- Glass
- Ceramic
Food, Beverages & Nutrition By End Use (USD Million, 2025-2035)
- Residential
- Commercial
- Industrial
Food, Beverages & Nutrition By Capacity (USD Million, 2025-2035)
- Small Capacity
- Medium Capacity
- Large Capacity


