Request Free Sample ×

Kindly complete the form below to receive a free sample of this Report

* Please use a valid business email

Leading companies partner with us for data-driven Insights

clients tt-cursor
Hero Background

US Malaria Diagnostics Market

ID: MRFR/LS/13113-HCR
100 Pages
Rahul Gotadki
Last Updated: April 06, 2026

US Malaria Diagnostics Market Research Report: Size, Share, Trend Analysis By Technology (Rapid Diagnostic Tests, Microscopy, Polymerase Chain Reaction, Serology Tests, Loop-Mediated Isothermal Amplification), By End Users (Hospitals, Diagnostic Laboratories, Research Institutes, Home Care Settings), By Product Type (Test Kits, Reagents, Instruments) and By Applications (Clinical Diagnosis, Epidemiological Studies, Drug Efficacy Studies) - Growth Outlook & Industry Forecast 2025 To 2035

Share:
Download PDF ×

We do not share your information with anyone. However, we may send you emails based on your report interest from time to time. You may contact us at any time to opt-out.

US Malaria Diagnostics Market Infographic
Purchase Options
  1. 1 SECTION I: EXECUTIVE SUMMARY AND KEY HIGHLIGHTS
  2.   1.1 EXECUTIVE SUMMARY
  3.     1.1.1 Market Overview
  4.     1.1.2 Key Findings
  5.     1.1.3 Market Segmentation
  6.     1.1.4 Competitive Landscape
  7.     1.1.5 Challenges and Opportunities
  8.     1.1.6 Future Outlook
  9. 2 SECTION II: SCOPING, METHODOLOGY AND MARKET STRUCTURE
  10.   2.1 MARKET INTRODUCTION
  11.     2.1.1 Definition
  12.     2.1.2 Scope of the study
  13.       2.1.2.1 Research Objective
  14.       2.1.2.2 Assumption
  15.       2.1.2.3 Limitations
  16.   2.2 RESEARCH METHODOLOGY
  17.     2.2.1 Overview
  18.     2.2.2 Data Mining
  19.     2.2.3 Secondary Research
  20.     2.2.4 Primary Research
  21.       2.2.4.1 Primary Interviews and Information Gathering Process
  22.       2.2.4.2 Breakdown of Primary Respondents
  23.     2.2.5 Forecasting Model
  24.     2.2.6 Market Size Estimation
  25.       2.2.6.1 Bottom-Up Approach
  26.       2.2.6.2 Top-Down Approach
  27.     2.2.7 Data Triangulation
  28.     2.2.8 Validation
  29. 3 SECTION III: QUALITATIVE ANALYSIS
  30.   3.1 MARKET DYNAMICS
  31.     3.1.1 Overview
  32.     3.1.2 Drivers
  33.     3.1.3 Restraints
  34.     3.1.4 Opportunities
  35.   3.2 MARKET FACTOR ANALYSIS
  36.     3.2.1 Value chain Analysis
  37.     3.2.2 Porter's Five Forces Analysis
  38.       3.2.2.1 Bargaining Power of Suppliers
  39.       3.2.2.2 Bargaining Power of Buyers
  40.       3.2.2.3 Threat of New Entrants
  41.       3.2.2.4 Threat of Substitutes
  42.       3.2.2.5 Intensity of Rivalry
  43.     3.2.3 COVID-19 Impact Analysis
  44.       3.2.3.1 Market Impact Analysis
  45.       3.2.3.2 Regional Impact
  46.       3.2.3.3 Opportunity and Threat Analysis
  47. 4 SECTION IV: QUANTITATIVE ANALYSIS
  48.   4.1 Chemicals and Materials, BY Technology (USD Million)
  49.     4.1.1 Rapid Diagnostic Tests
  50.     4.1.2 Microscopy
  51.     4.1.3 Polymerase Chain Reaction
  52.     4.1.4 Serology Tests
  53.     4.1.5 Loop-Mediated Isothermal Amplification
  54.   4.2 Chemicals and Materials, BY End User (USD Million)
  55.     4.2.1 Hospitals
  56.     4.2.2 Diagnostic Laboratories
  57.     4.2.3 Research Institutes
  58.     4.2.4 Home Care Settings
  59.   4.3 Chemicals and Materials, BY Product Type (USD Million)
  60.     4.3.1 Test Kits
  61.     4.3.2 Reagents
  62.     4.3.3 Instruments
  63.   4.4 Chemicals and Materials, BY Application (USD Million)
  64.     4.4.1 Clinical Diagnosis
  65.     4.4.2 Epidemiological Studies
  66.     4.4.3 Drug Efficacy Studies
  67. 5 SECTION V: COMPETITIVE ANALYSIS
  68.   5.1 Competitive Landscape
  69.     5.1.1 Overview
  70.     5.1.2 Competitive Analysis
  71.     5.1.3 Market share Analysis
  72.     5.1.4 Major Growth Strategy in the Chemicals and Materials
  73.     5.1.5 Competitive Benchmarking
  74.     5.1.6 Leading Players in Terms of Number of Developments in the Chemicals and Materials
  75.     5.1.7 Key developments and growth strategies
  76.       5.1.7.1 New Product Launch/Service Deployment
  77.       5.1.7.2 Merger & Acquisitions
  78.       5.1.7.3 Joint Ventures
  79.     5.1.8 Major Players Financial Matrix
  80.       5.1.8.1 Sales and Operating Income
  81.       5.1.8.2 Major Players R&D Expenditure. 2023
  82.   5.2 Company Profiles
  83.     5.2.1 Roche (CH)
  84.       5.2.1.1 Financial Overview
  85.       5.2.1.2 Products Offered
  86.       5.2.1.3 Key Developments
  87.       5.2.1.4 SWOT Analysis
  88.       5.2.1.5 Key Strategies
  89.     5.2.2 Abbott (US)
  90.       5.2.2.1 Financial Overview
  91.       5.2.2.2 Products Offered
  92.       5.2.2.3 Key Developments
  93.       5.2.2.4 SWOT Analysis
  94.       5.2.2.5 Key Strategies
  95.     5.2.3 Siemens Healthineers (DE)
  96.       5.2.3.1 Financial Overview
  97.       5.2.3.2 Products Offered
  98.       5.2.3.3 Key Developments
  99.       5.2.3.4 SWOT Analysis
  100.       5.2.3.5 Key Strategies
  101.     5.2.4 BD (US)
  102.       5.2.4.1 Financial Overview
  103.       5.2.4.2 Products Offered
  104.       5.2.4.3 Key Developments
  105.       5.2.4.4 SWOT Analysis
  106.       5.2.4.5 Key Strategies
  107.     5.2.5 Cepheid (US)
  108.       5.2.5.1 Financial Overview
  109.       5.2.5.2 Products Offered
  110.       5.2.5.3 Key Developments
  111.       5.2.5.4 SWOT Analysis
  112.       5.2.5.5 Key Strategies
  113.     5.2.6 Hologic (US)
  114.       5.2.6.1 Financial Overview
  115.       5.2.6.2 Products Offered
  116.       5.2.6.3 Key Developments
  117.       5.2.6.4 SWOT Analysis
  118.       5.2.6.5 Key Strategies
  119.     5.2.7 Thermo Fisher Scientific (US)
  120.       5.2.7.1 Financial Overview
  121.       5.2.7.2 Products Offered
  122.       5.2.7.3 Key Developments
  123.       5.2.7.4 SWOT Analysis
  124.       5.2.7.5 Key Strategies
  125.     5.2.8 Diatheva (IT)
  126.       5.2.8.1 Financial Overview
  127.       5.2.8.2 Products Offered
  128.       5.2.8.3 Key Developments
  129.       5.2.8.4 SWOT Analysis
  130.       5.2.8.5 Key Strategies
  131.   5.3 Appendix
  132.     5.3.1 References
  133.     5.3.2 Related Reports
  134. 6 LIST OF FIGURES
  135.   6.1 MARKET SYNOPSIS
  136.   6.2 US MARKET ANALYSIS BY TECHNOLOGY
  137.   6.3 US MARKET ANALYSIS BY END USER
  138.   6.4 US MARKET ANALYSIS BY PRODUCT TYPE
  139.   6.5 US MARKET ANALYSIS BY APPLICATION
  140.   6.6 KEY BUYING CRITERIA OF CHEMICALS AND MATERIALS
  141.   6.7 RESEARCH PROCESS OF MRFR
  142.   6.8 DRO ANALYSIS OF CHEMICALS AND MATERIALS
  143.   6.9 DRIVERS IMPACT ANALYSIS: CHEMICALS AND MATERIALS
  144.   6.10 RESTRAINTS IMPACT ANALYSIS: CHEMICALS AND MATERIALS
  145.   6.11 SUPPLY / VALUE CHAIN: CHEMICALS AND MATERIALS
  146.   6.12 CHEMICALS AND MATERIALS, BY TECHNOLOGY, 2024 (% SHARE)
  147.   6.13 CHEMICALS AND MATERIALS, BY TECHNOLOGY, 2024 TO 2035 (USD Million)
  148.   6.14 CHEMICALS AND MATERIALS, BY END USER, 2024 (% SHARE)
  149.   6.15 CHEMICALS AND MATERIALS, BY END USER, 2024 TO 2035 (USD Million)
  150.   6.16 CHEMICALS AND MATERIALS, BY PRODUCT TYPE, 2024 (% SHARE)
  151.   6.17 CHEMICALS AND MATERIALS, BY PRODUCT TYPE, 2024 TO 2035 (USD Million)
  152.   6.18 CHEMICALS AND MATERIALS, BY APPLICATION, 2024 (% SHARE)
  153.   6.19 CHEMICALS AND MATERIALS, BY APPLICATION, 2024 TO 2035 (USD Million)
  154.   6.20 BENCHMARKING OF MAJOR COMPETITORS
  155. 7 LIST OF TABLES
  156.   7.1 LIST OF ASSUMPTIONS
  157.     7.1.1
  158.   7.2 US MARKET SIZE ESTIMATES; FORECAST
  159.     7.2.1 BY TECHNOLOGY, 2025-2035 (USD Million)
  160.     7.2.2 BY END USER, 2025-2035 (USD Million)
  161.     7.2.3 BY PRODUCT TYPE, 2025-2035 (USD Million)
  162.     7.2.4 BY APPLICATION, 2025-2035 (USD Million)
  163.   7.3 PRODUCT LAUNCH/PRODUCT DEVELOPMENT/APPROVAL
  164.     7.3.1
  165.   7.4 ACQUISITION/PARTNERSHIP
  166.     7.4.1

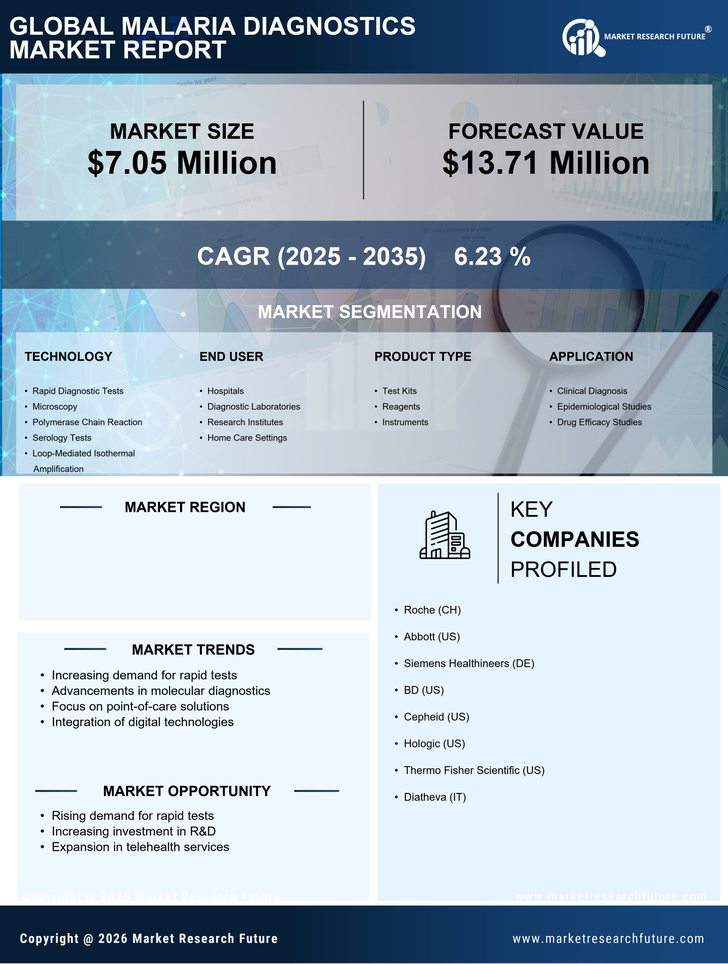
US Chemicals and Materials Market Segmentation

Chemicals and Materials By Technology (USD Million, 2025-2035)

  • Rapid Diagnostic Tests
  • Microscopy
  • Polymerase Chain Reaction
  • Serology Tests
  • Loop-Mediated Isothermal Amplification

Chemicals and Materials By End User (USD Million, 2025-2035)

  • Hospitals
  • Diagnostic Laboratories
  • Research Institutes
  • Home Care Settings

Chemicals and Materials By Product Type (USD Million, 2025-2035)

  • Test Kits
  • Reagents
  • Instruments

Chemicals and Materials By Application (USD Million, 2025-2035)

  • Clinical Diagnosis
  • Epidemiological Studies
  • Drug Efficacy Studies

Compare Licence

×
Features License Type
Single User Multiuser License Enterprise User
Price $4,950 $5,950 $7,250
Maximum User Access Limit 1 User Upto 10 Users Unrestricted Access Throughout the Organization
Free Customization
Direct Access to Analyst
Deliverable Format
Platform Access
Discount on Next Purchase 10% 15% 15%
Printable Versions