Request Free Sample ×

Kindly complete the form below to receive a free sample of this Report

* Please use a valid business email

Leading companies partner with us for data-driven Insights

clients tt-cursor
Hero Background

US Hyperglycemia Treatment Market

ID: MRFR/Pharma/17487-HCR
100 Pages
Vikita Thakur
Last Updated: April 24, 2026

US Hyperglycemia Treatment Market Research Report: Size, Share, Trend Analysis By Drug Type (Insulin, Oral Antidiabetic Drugs, GLP-1 Receptor Agonists, DPP-4 Inhibitors), By Administration Route (Injectable, Oral, Inhalation), By Patient Type (Type 1 Diabetes, Type 2 Diabetes, Gestational Diabetes) and By Distribution Channel (Hospitals, Retail Pharmacies, Online Pharmacies) - Growth Outlook & Industry Forecast 2025 To 2035

Share:
Download PDF ×

We do not share your information with anyone. However, we may send you emails based on your report interest from time to time. You may contact us at any time to opt-out.

US Hyperglycemia Treatment Market Infographic
Purchase Options
  1. 1 SECTION I: EXECUTIVE SUMMARY AND KEY HIGHLIGHTS
  2.   1.1 EXECUTIVE SUMMARY
  3.     1.1.1 Market Overview
  4.     1.1.2 Key Findings
  5.     1.1.3 Market Segmentation
  6.     1.1.4 Competitive Landscape
  7.     1.1.5 Challenges and Opportunities
  8.     1.1.6 Future Outlook
  9. 2 SECTION II: SCOPING, METHODOLOGY AND MARKET STRUCTURE
  10.   2.1 MARKET INTRODUCTION
  11.     2.1.1 Definition
  12.     2.1.2 Scope of the study
  13.       2.1.2.1 Research Objective
  14.       2.1.2.2 Assumption
  15.       2.1.2.3 Limitations
  16.   2.2 RESEARCH METHODOLOGY
  17.     2.2.1 Overview
  18.     2.2.2 Data Mining
  19.     2.2.3 Secondary Research
  20.     2.2.4 Primary Research
  21.       2.2.4.1 Primary Interviews and Information Gathering Process
  22.       2.2.4.2 Breakdown of Primary Respondents
  23.     2.2.5 Forecasting Model
  24.     2.2.6 Market Size Estimation
  25.       2.2.6.1 Bottom-Up Approach
  26.       2.2.6.2 Top-Down Approach
  27.     2.2.7 Data Triangulation
  28.     2.2.8 Validation
  29. 3 SECTION III: QUALITATIVE ANALYSIS
  30.   3.1 MARKET DYNAMICS
  31.     3.1.1 Overview
  32.     3.1.2 Drivers
  33.     3.1.3 Restraints
  34.     3.1.4 Opportunities
  35.   3.2 MARKET FACTOR ANALYSIS
  36.     3.2.1 Value chain Analysis
  37.     3.2.2 Porter's Five Forces Analysis
  38.       3.2.2.1 Bargaining Power of Suppliers
  39.       3.2.2.2 Bargaining Power of Buyers
  40.       3.2.2.3 Threat of New Entrants
  41.       3.2.2.4 Threat of Substitutes
  42.       3.2.2.5 Intensity of Rivalry
  43.     3.2.3 COVID-19 Impact Analysis
  44.       3.2.3.1 Market Impact Analysis
  45.       3.2.3.2 Regional Impact
  46.       3.2.3.3 Opportunity and Threat Analysis
  47. 4 SECTION IV: QUANTITATIVE ANALYSIS
  48.   4.1 Security, Access Control and Robotics, BY Drug Type (USD Million)
  49.     4.1.1 Insulin
  50.     4.1.2 Oral Antidiabetic Drugs
  51.     4.1.3 GLP-1 Receptor Agonists
  52.     4.1.4 DPP-4 Inhibitors
  53.   4.2 Security, Access Control and Robotics, BY Administration Route (USD Million)
  54.     4.2.1 Injectable
  55.     4.2.2 Oral
  56.     4.2.3 Inhalation
  57.   4.3 Security, Access Control and Robotics, BY Patient Type (USD Million)
  58.     4.3.1 Type 1 Diabetes
  59.     4.3.2 Type 2 Diabetes
  60.     4.3.3 Gestational Diabetes
  61.   4.4 Security, Access Control and Robotics, BY Distribution Channel (USD Million)
  62.     4.4.1 Hospitals
  63.     4.4.2 Retail Pharmacies
  64.     4.4.3 Online Pharmacies
  65. 5 SECTION V: COMPETITIVE ANALYSIS
  66.   5.1 Competitive Landscape
  67.     5.1.1 Overview
  68.     5.1.2 Competitive Analysis
  69.     5.1.3 Market share Analysis
  70.     5.1.4 Major Growth Strategy in the Security, Access Control and Robotics
  71.     5.1.5 Competitive Benchmarking
  72.     5.1.6 Leading Players in Terms of Number of Developments in the Security, Access Control and Robotics
  73.     5.1.7 Key developments and growth strategies
  74.       5.1.7.1 New Product Launch/Service Deployment
  75.       5.1.7.2 Merger & Acquisitions
  76.       5.1.7.3 Joint Ventures
  77.     5.1.8 Major Players Financial Matrix
  78.       5.1.8.1 Sales and Operating Income
  79.       5.1.8.2 Major Players R&D Expenditure. 2023
  80.   5.2 Company Profiles
  81.     5.2.1 Novo Nordisk (DK)
  82.       5.2.1.1 Financial Overview
  83.       5.2.1.2 Products Offered
  84.       5.2.1.3 Key Developments
  85.       5.2.1.4 SWOT Analysis
  86.       5.2.1.5 Key Strategies
  87.     5.2.2 Sanofi (FR)
  88.       5.2.2.1 Financial Overview
  89.       5.2.2.2 Products Offered
  90.       5.2.2.3 Key Developments
  91.       5.2.2.4 SWOT Analysis
  92.       5.2.2.5 Key Strategies
  93.     5.2.3 Boehringer Ingelheim (DE)
  94.       5.2.3.1 Financial Overview
  95.       5.2.3.2 Products Offered
  96.       5.2.3.3 Key Developments
  97.       5.2.3.4 SWOT Analysis
  98.       5.2.3.5 Key Strategies
  99.     5.2.4 Merck & Co. (US)
  100.       5.2.4.1 Financial Overview
  101.       5.2.4.2 Products Offered
  102.       5.2.4.3 Key Developments
  103.       5.2.4.4 SWOT Analysis
  104.       5.2.4.5 Key Strategies
  105.     5.2.5 AstraZeneca (GB)
  106.       5.2.5.1 Financial Overview
  107.       5.2.5.2 Products Offered
  108.       5.2.5.3 Key Developments
  109.       5.2.5.4 SWOT Analysis
  110.       5.2.5.5 Key Strategies
  111.     5.2.6 Eli Lilly and Company (US)
  112.       5.2.6.1 Financial Overview
  113.       5.2.6.2 Products Offered
  114.       5.2.6.3 Key Developments
  115.       5.2.6.4 SWOT Analysis
  116.       5.2.6.5 Key Strategies
  117.     5.2.7 Johnson & Johnson (US)
  118.       5.2.7.1 Financial Overview
  119.       5.2.7.2 Products Offered
  120.       5.2.7.3 Key Developments
  121.       5.2.7.4 SWOT Analysis
  122.       5.2.7.5 Key Strategies
  123.     5.2.8 AbbVie (US)
  124.       5.2.8.1 Financial Overview
  125.       5.2.8.2 Products Offered
  126.       5.2.8.3 Key Developments
  127.       5.2.8.4 SWOT Analysis
  128.       5.2.8.5 Key Strategies
  129.   5.3 Appendix
  130.     5.3.1 References
  131.     5.3.2 Related Reports
  132. 6 LIST OF FIGURES
  133.   6.1 MARKET SYNOPSIS
  134.   6.2 US MARKET ANALYSIS BY DRUG TYPE
  135.   6.3 US MARKET ANALYSIS BY ADMINISTRATION ROUTE
  136.   6.4 US MARKET ANALYSIS BY PATIENT TYPE
  137.   6.5 US MARKET ANALYSIS BY DISTRIBUTION CHANNEL
  138.   6.6 KEY BUYING CRITERIA OF SECURITY, ACCESS CONTROL AND ROBOTICS
  139.   6.7 RESEARCH PROCESS OF MRFR
  140.   6.8 DRO ANALYSIS OF SECURITY, ACCESS CONTROL AND ROBOTICS
  141.   6.9 DRIVERS IMPACT ANALYSIS: SECURITY, ACCESS CONTROL AND ROBOTICS
  142.   6.10 RESTRAINTS IMPACT ANALYSIS: SECURITY, ACCESS CONTROL AND ROBOTICS
  143.   6.11 SUPPLY / VALUE CHAIN: SECURITY, ACCESS CONTROL AND ROBOTICS
  144.   6.12 SECURITY, ACCESS CONTROL AND ROBOTICS, BY DRUG TYPE, 2024 (% SHARE)
  145.   6.13 SECURITY, ACCESS CONTROL AND ROBOTICS, BY DRUG TYPE, 2024 TO 2035 (USD Million)
  146.   6.14 SECURITY, ACCESS CONTROL AND ROBOTICS, BY ADMINISTRATION ROUTE, 2024 (% SHARE)
  147.   6.15 SECURITY, ACCESS CONTROL AND ROBOTICS, BY ADMINISTRATION ROUTE, 2024 TO 2035 (USD Million)
  148.   6.16 SECURITY, ACCESS CONTROL AND ROBOTICS, BY PATIENT TYPE, 2024 (% SHARE)
  149.   6.17 SECURITY, ACCESS CONTROL AND ROBOTICS, BY PATIENT TYPE, 2024 TO 2035 (USD Million)
  150.   6.18 SECURITY, ACCESS CONTROL AND ROBOTICS, BY DISTRIBUTION CHANNEL, 2024 (% SHARE)
  151.   6.19 SECURITY, ACCESS CONTROL AND ROBOTICS, BY DISTRIBUTION CHANNEL, 2024 TO 2035 (USD Million)
  152.   6.20 BENCHMARKING OF MAJOR COMPETITORS
  153. 7 LIST OF TABLES
  154.   7.1 LIST OF ASSUMPTIONS
  155.     7.1.1
  156.   7.2 US MARKET SIZE ESTIMATES; FORECAST
  157.     7.2.1 BY DRUG TYPE, 2025-2035 (USD Million)
  158.     7.2.2 BY ADMINISTRATION ROUTE, 2025-2035 (USD Million)
  159.     7.2.3 BY PATIENT TYPE, 2025-2035 (USD Million)
  160.     7.2.4 BY DISTRIBUTION CHANNEL, 2025-2035 (USD Million)
  161.   7.3 PRODUCT LAUNCH/PRODUCT DEVELOPMENT/APPROVAL
  162.     7.3.1
  163.   7.4 ACQUISITION/PARTNERSHIP
  164.     7.4.1

US Security, Access Control and Robotics Market Segmentation

Security, Access Control and Robotics By Drug Type (USD Million, 2025-2035)
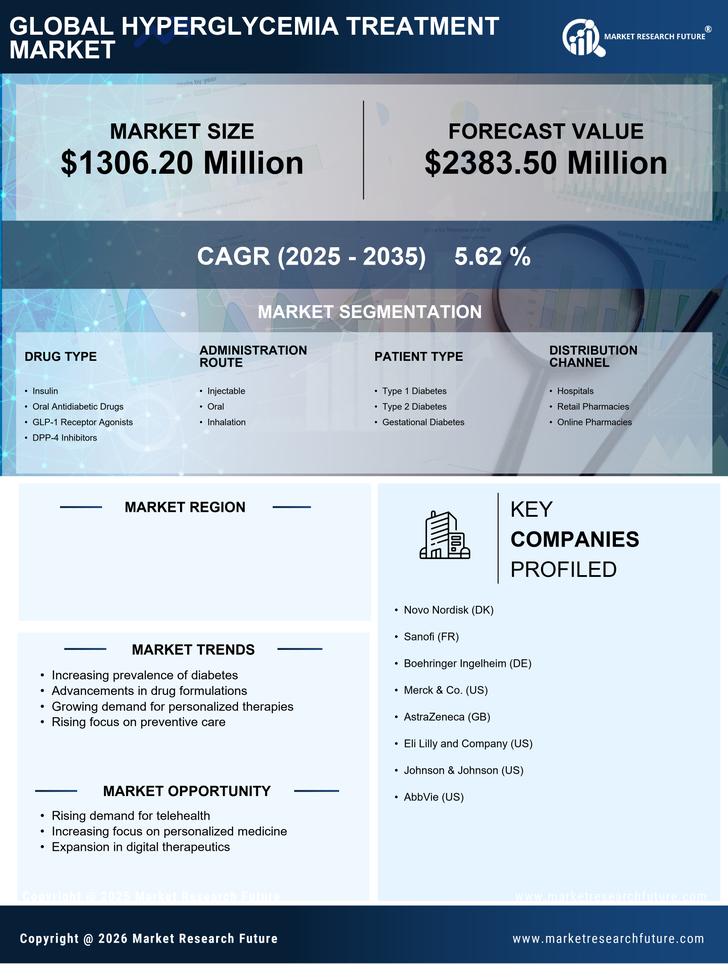
  • Insulin
  • Oral Antidiabetic Drugs
  • GLP-1 Receptor Agonists
  • DPP-4 Inhibitors

Security, Access Control and Robotics By Administration Route (USD Million, 2025-2035)

  • Injectable
  • Oral
  • Inhalation

Security, Access Control and Robotics By Patient Type (USD Million, 2025-2035)

  • Type 1 Diabetes
  • Type 2 Diabetes
  • Gestational Diabetes

Security, Access Control and Robotics By Distribution Channel (USD Million, 2025-2035)

  • Hospitals
  • Retail Pharmacies
  • Online Pharmacies

Compare Licence

×
Features License Type
Single User Multiuser License Enterprise User
Price $4,950 $5,950 $7,250
Maximum User Access Limit 1 User Upto 10 Users Unrestricted Access Throughout the Organization
Free Customization
Direct Access to Analyst
Deliverable Format
Platform Access
Discount on Next Purchase 10% 15% 15%
Printable Versions