

US Industrial Automation & Equipment Market Segmentation
Industrial Automation & Equipment By Disease Type (USD Million, 2025-2035)
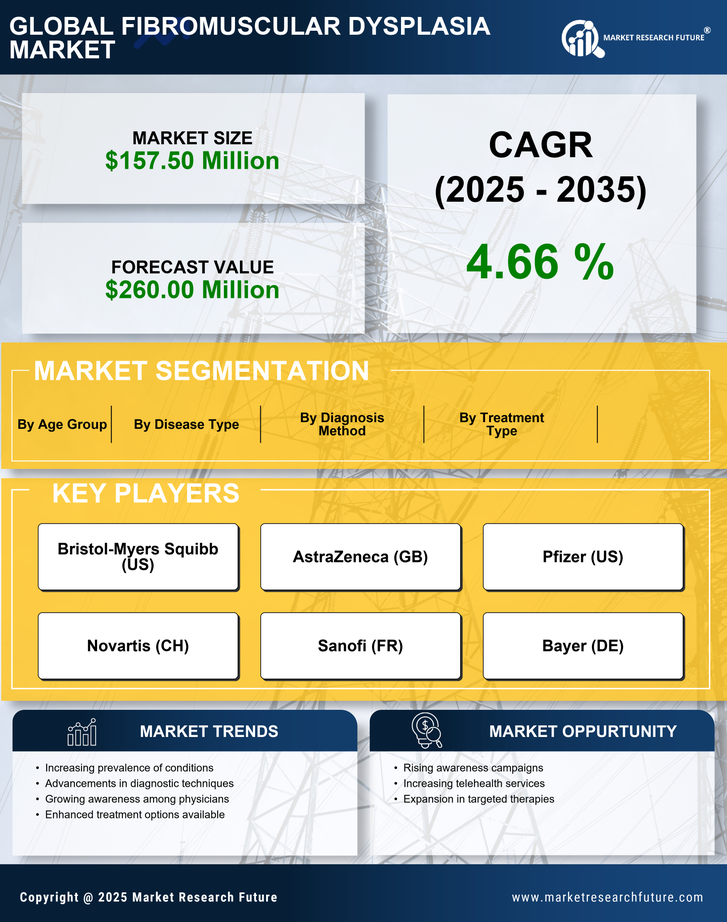
- Renal Fibromuscular Dysplasia
- Cervical Fibromuscular Dysplasia
- Carotid Fibromuscular Dysplasia
- Pulmonary Fibromuscular Dysplasia
Industrial Automation & Equipment By Treatment Type (USD Million, 2025-2035)
- Medications
- Surgical Interventions
- Radiological Interventions
- Endovascular Interventions
Industrial Automation & Equipment By Diagnosis Method (USD Million, 2025-2035)
- Ultrasound
- Magnetic Resonance Angiography
- Computed Tomography Angiography
- Conventional Angiography
Industrial Automation & Equipment By Age Group (USD Million, 2025-2035)
- Pediatric
- Adult
- Geriatric


