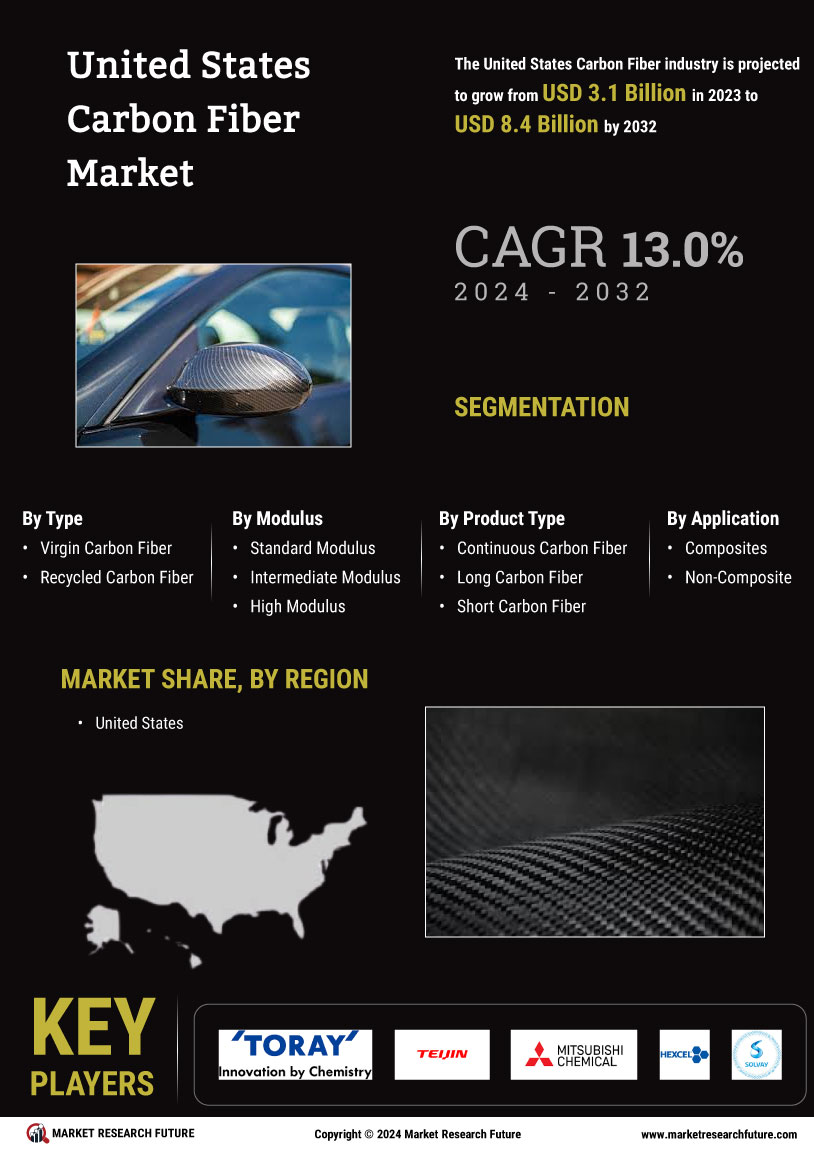
Request Free Sample ×

Kindly complete the form below to receive a free sample of this Report

* Please use a valid business email

Leading companies partner with us for data-driven Insights

clients tt-cursor
Hero Background

US Carbon Fiber Market

ID: MRFR/CnM/18905-HCR
128 Pages
Chitranshi Jaiswal
Last Updated: April 06, 2026

United States Carbon Fiber Market Research Report Information by Material Type (PAN-based Carbon Fiber and Pitch-based Carbon Fiber), by Type (Virgin Carbon Fiber and Recycled Carbon Fiber), by Modulus (Standard, Intermediate and High Modulus), by Product Type (Continuous, Long, and Short Carbon Fiber), by Application (Composites, and Non-Composite), by End Use Industry (Aerospace & Defense, Wind Energy, Automotive, Pipes, Sporting Goods, Medical & Healthcare, Construction & Infrastructure, Pressure Vessels) – US Market Forecast Till 2035

Share:
Download PDF ×

We do not share your information with anyone. However, we may send you emails based on your report interest from time to time. You may contact us at any time to opt-out.

  1. 1 SECTION I: EXECUTIVE SUMMARY AND KEY HIGHLIGHTS
    1. 1.1 EXECUTIVE SUMMARY
      1. 1.1.1 Market Overview
      2. 1.1.2 Key Findings
      3. 1.1.3 Market Segmentation
      4. 1.1.4 Competitive Landscape
      5. 1.1.5 Challenges and Opportunities
      6. 1.1.6 Future Outlook
  2. 2 SECTION II: SCOPING, METHODOLOGY AND MARKET STRUCTURE
    1. 2.1 MARKET INTRODUCTION
      1. 2.1.1 Definition
      2. 2.1.2 Scope of the study
        1. 2.1.2.1 Research Objective
        2. 2.1.2.2 Assumption
        3. 2.1.2.3 Limitations
    2. 2.2 RESEARCH METHODOLOGY
      1. 2.2.1 Overview
      2. 2.2.2 Data Mining
      3. 2.2.3 Secondary Research
      4. 2.2.4 Primary Research
        1. 2.2.4.1 Primary Interviews and Information Gathering Process
        2. 2.2.4.2 Breakdown of Primary Respondents
      5. 2.2.5 Forecasting Model
      6. 2.2.6 Market Size Estimation
        1. 2.2.6.1 Bottom-Up Approach
        2. 2.2.6.2 Top-Down Approach
      7. 2.2.7 Data Triangulation
      8. 2.2.8 Validation
  3. 3 SECTION III: QUALITATIVE ANALYSIS
    1. 3.1 MARKET DYNAMICS
      1. 3.1.1 Overview
      2. 3.1.2 Drivers
      3. 3.1.3 Restraints
      4. 3.1.4 Opportunities
    2. 3.2 MARKET FACTOR ANALYSIS
      1. 3.2.1 Value chain Analysis
      2. 3.2.2 Porter's Five Forces Analysis
        1. 3.2.2.1 Bargaining Power of Suppliers
        2. 3.2.2.2 Bargaining Power of Buyers
        3. 3.2.2.3 Threat of New Entrants
        4. 3.2.2.4 Threat of Substitutes
        5. 3.2.2.5 Intensity of Rivalry
      3. 3.2.3 COVID-19 Impact Analysis
        1. 3.2.3.1 Market Impact Analysis
        2. 3.2.3.2 Regional Impact
        3. 3.2.3.3 Opportunity and Threat Analysis
  4. 4 SECTION IV: QUANTITATIVE ANALYSIS
    1. 4.1 Chemicals and Materials, BY Application (USD Billion)
      1. 4.1.1 Aerospace
      2. 4.1.2 Automotive
      3. 4.1.3 Sporting Goods
      4. 4.1.4 Wind Energy
      5. 4.1.5 Civil Engineering
    2. 4.2 Chemicals and Materials, BY End Use (USD Billion)
      1. 4.2.1 Composites
      2. 4.2.2 Textiles
      3. 4.2.3 Resins
      4. 4.2.4 Prepregs
      5. 4.2.5 Additives
    3. 4.3 Chemicals and Materials, BY Type (USD Billion)
      1. 4.3.1 Continuous Fiber
      2. 4.3.2 Chopped Fiber
      3. 4.3.3 Woven Fabric
      4. 4.3.4 Prepreg
      5. 4.3.5 Non-Woven
  5. 5 SECTION V: COMPETITIVE ANALYSIS
    1. 5.1 Competitive Landscape
      1. 5.1.1 Overview
      2. 5.1.2 Competitive Analysis
      3. 5.1.3 Market share Analysis
      4. 5.1.4 Major Growth Strategy in the Chemicals and Materials
      5. 5.1.5 Competitive Benchmarking
      6. 5.1.6 Leading Players in Terms of Number of Developments in the Chemicals and Materials
      7. 5.1.7 Key developments and growth strategies
        1. 5.1.7.1 New Product Launch/Service Deployment
        2. 5.1.7.2 Merger & Acquisitions
        3. 5.1.7.3 Joint Ventures
      8. 5.1.8 Major Players Financial Matrix
        1. 5.1.8.1 Sales and Operating Income
        2. 5.1.8.2 Major Players R&D Expenditure. 2023
    2. 5.2 Company Profiles
      1. 5.2.1 Hexcel Corporation (US)
        1. 5.2.1.1 Financial Overview
        2. 5.2.1.2 Products Offered
        3. 5.2.1.3 Key Developments
        4. 5.2.1.4 SWOT Analysis
        5. 5.2.1.5 Key Strategies
      2. 5.2.2 Toray Industries, Inc. (JP)
        1. 5.2.2.1 Financial Overview
        2. 5.2.2.2 Products Offered
        3. 5.2.2.3 Key Developments
        4. 5.2.2.4 SWOT Analysis
        5. 5.2.2.5 Key Strategies
      3. 5.2.3 SGL Carbon SE (DE)
        1. 5.2.3.1 Financial Overview
        2. 5.2.3.2 Products Offered
        3. 5.2.3.3 Key Developments
        4. 5.2.3.4 SWOT Analysis
        5. 5.2.3.5 Key Strategies
      4. 5.2.4 Mitsubishi Chemical Corporation (JP)
        1. 5.2.4.1 Financial Overview
        2. 5.2.4.2 Products Offered
        3. 5.2.4.3 Key Developments
        4. 5.2.4.4 SWOT Analysis
        5. 5.2.4.5 Key Strategies
      5. 5.2.5 Teijin Limited (JP)
        1. 5.2.5.1 Financial Overview
        2. 5.2.5.2 Products Offered
        3. 5.2.5.3 Key Developments
        4. 5.2.5.4 SWOT Analysis
        5. 5.2.5.5 Key Strategies
      6. 5.2.6 Solvay S.A. (BE)
        1. 5.2.6.1 Financial Overview
        2. 5.2.6.2 Products Offered
        3. 5.2.6.3 Key Developments
        4. 5.2.6.4 SWOT Analysis
        5. 5.2.6.5 Key Strategies
      7. 5.2.7 Zoltek Companies, Inc. (US)
        1. 5.2.7.1 Financial Overview
        2. 5.2.7.2 Products Offered
        3. 5.2.7.3 Key Developments
        4. 5.2.7.4 SWOT Analysis
        5. 5.2.7.5 Key Strategies
      8. 5.2.8 Cytec Industries Inc. (US)
        1. 5.2.8.1 Financial Overview
        2. 5.2.8.2 Products Offered
        3. 5.2.8.3 Key Developments
        4. 5.2.8.4 SWOT Analysis
        5. 5.2.8.5 Key Strategies
      9. 5.2.9 Formosa Plastics Corporation (TW)
        1. 5.2.9.1 Financial Overview
        2. 5.2.9.2 Products Offered
        3. 5.2.9.3 Key Developments
        4. 5.2.9.4 SWOT Analysis
        5. 5.2.9.5 Key Strategies
    3. 5.3 Appendix
      1. 5.3.1 References
      2. 5.3.2 Related Reports
  6. 6 LIST OF FIGURES
    1. 6.1 MARKET SYNOPSIS
    2. 6.2 US MARKET ANALYSIS BY APPLICATION
    3. 6.3 US MARKET ANALYSIS BY END USE
    4. 6.4 US MARKET ANALYSIS BY TYPE
    5. 6.5 KEY BUYING CRITERIA OF CHEMICALS AND MATERIALS
    6. 6.6 RESEARCH PROCESS OF MRFR
    7. 6.7 DRO ANALYSIS OF CHEMICALS AND MATERIALS
    8. 6.8 DRIVERS IMPACT ANALYSIS: CHEMICALS AND MATERIALS
    9. 6.9 RESTRAINTS IMPACT ANALYSIS: CHEMICALS AND MATERIALS
    10. 6.10 SUPPLY / VALUE CHAIN: CHEMICALS AND MATERIALS
    11. 6.11 CHEMICALS AND MATERIALS, BY APPLICATION, 2024 (% SHARE)
    12. 6.12 CHEMICALS AND MATERIALS, BY APPLICATION, 2024 TO 2035 (USD Billion)
    13. 6.13 CHEMICALS AND MATERIALS, BY END USE, 2024 (% SHARE)
    14. 6.14 CHEMICALS AND MATERIALS, BY END USE, 2024 TO 2035 (USD Billion)
    15. 6.15 CHEMICALS AND MATERIALS, BY TYPE, 2024 (% SHARE)
    16. 6.16 CHEMICALS AND MATERIALS, BY TYPE, 2024 TO 2035 (USD Billion)
    17. 6.17 BENCHMARKING OF MAJOR COMPETITORS
  7. 7 LIST OF TABLES
    1. 7.1 LIST OF ASSUMPTIONS
  8. 7.1.1
    1. 7.2 US MARKET SIZE ESTIMATES; FORECAST
      1. 7.2.1 BY APPLICATION, 2025-2035 (USD Billion)
      2. 7.2.2 BY END USE, 2025-2035 (USD Billion)
      3. 7.2.3 BY TYPE, 2025-2035 (USD Billion)
    2. 7.3 PRODUCT LAUNCH/PRODUCT DEVELOPMENT/APPROVAL
  9. 7.3.1
    1. 7.4 ACQUISITION/PARTNERSHIP
  10. 7.4.1

US Chemicals and Materials Market Segmentation

Chemicals and Materials By Application (USD Billion, 2025-2035)

  • Aerospace
  • Automotive
  • Sporting Goods
  • Wind Energy
  • Civil Engineering

Chemicals and Materials By End Use (USD Billion, 2025-2035)

  • Composites
  • Textiles
  • Resins
  • Prepregs
  • Additives

Chemicals and Materials By Type (USD Billion, 2025-2035)

  • Continuous Fiber
  • Chopped Fiber
  • Woven Fabric
  • Prepreg
  • Non-Woven

Compare Licence

×
Features License Type
Single User Multiuser License Enterprise User
Price $4,950 $5,950 $7,250
Maximum User Access Limit 1 User Upto 10 Users Unrestricted Access Throughout the Organization
Free Customization
Direct Access to Analyst
Deliverable Format
Platform Access
Discount on Next Purchase 10% 15% 15%
Printable Versions