

US Pharmaceutical Market Segmentation
Pharmaceutical By Type (USD Million, 2025-2035)
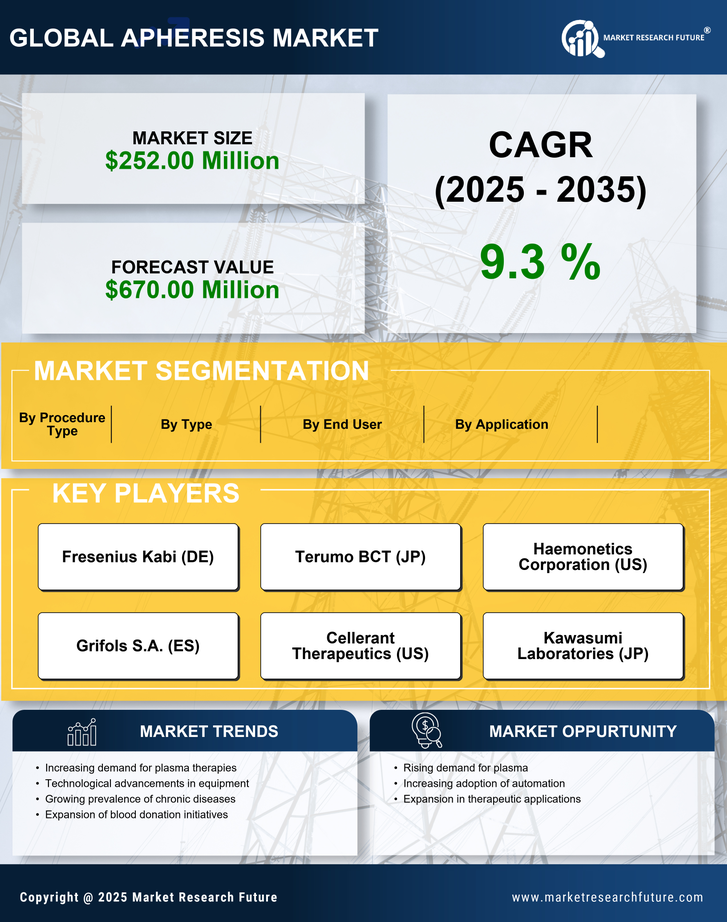
- Therapeutic Apheresis
- Donor Apheresis
- Plasma Apheresis
- Cell Apheresis
Pharmaceutical By Application (USD Million, 2025-2035)
- Renal Disorders
- Neurological Disorders
- Cancer Treatment
- Autoimmune Disorders
Pharmaceutical By End User (USD Million, 2025-2035)
- Hospitals
- Blood Donation Centers
- Research Laboratories
Pharmaceutical By Procedure Type (USD Million, 2025-2035)
- Manual Apheresis
- Automated Apheresis


