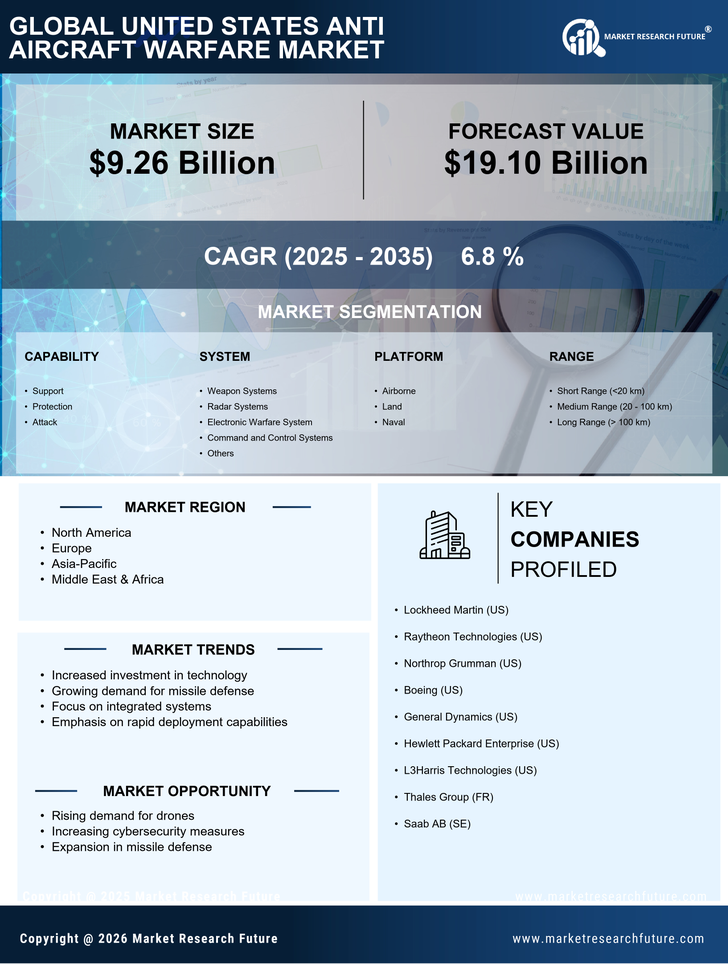
Request Free Sample ×

Kindly complete the form below to receive a free sample of this Report

* Please use a valid business email

Leading companies partner with us for data-driven Insights

clients tt-cursor
Hero Background

United States Anti Aircraft Warfare Market

ID: MRFR/AD/19876-HCR
128 Pages
Triveni Bhoyar
Last Updated: April 06, 2026

United States Anti Aircraft Warfare Market Size, Share, Industry Trend & Analysis Research Report Information By Capability (Support, Protection And Attack), By System (Weapon Systems, Radar Systems, Electronic Warfare System, Command and Control Systems And Others), By Platform (Airborne, Land And Naval), By Range (Short Range (<20 km), Medium Range (20 - 100 km) And Long Range (> 100 km))– United States Forecast Till 2035

Share:
Download PDF ×

We do not share your information with anyone. However, we may send you emails based on your report interest from time to time. You may contact us at any time to opt-out.

United States Anti Aircraft Warfare Market Infographic
Purchase Options
  1. 1 SECTION I: EXECUTIVE SUMMARY AND KEY HIGHLIGHTS
    1. 1.1 EXECUTIVE SUMMARY
      1. 1.1.1 Market Overview
      2. 1.1.2 Key Findings
      3. 1.1.3 Market Segmentation
      4. 1.1.4 Competitive Landscape
      5. 1.1.5 Challenges and Opportunities
      6. 1.1.6 Future Outlook
  2. 2 SECTION II: SCOPING, METHODOLOGY AND MARKET STRUCTURE
    1. 2.1 MARKET INTRODUCTION
      1. 2.1.1 Definition
      2. 2.1.2 Scope of the study
        1. 2.1.2.1 Research Objective
        2. 2.1.2.2 Assumption
        3. 2.1.2.3 Limitations
    2. 2.2 RESEARCH METHODOLOGY
      1. 2.2.1 Overview
      2. 2.2.2 Data Mining
      3. 2.2.3 Secondary Research
      4. 2.2.4 Primary Research
        1. 2.2.4.1 Primary Interviews and Information Gathering Process
        2. 2.2.4.2 Breakdown of Primary Respondents
      5. 2.2.5 Forecasting Model
      6. 2.2.6 Market Size Estimation
        1. 2.2.6.1 Bottom-Up Approach
        2. 2.2.6.2 Top-Down Approach
      7. 2.2.7 Data Triangulation
      8. 2.2.8 Validation
  3. 3 SECTION III: QUALITATIVE ANALYSIS
    1. 3.1 MARKET DYNAMICS
      1. 3.1.1 Overview
      2. 3.1.2 Drivers
      3. 3.1.3 Restraints
      4. 3.1.4 Opportunities
    2. 3.2 MARKET FACTOR ANALYSIS
      1. 3.2.1 Value chain Analysis
      2. 3.2.2 Porter's Five Forces Analysis
        1. 3.2.2.1 Bargaining Power of Suppliers
        2. 3.2.2.2 Bargaining Power of Buyers
        3. 3.2.2.3 Threat of New Entrants
        4. 3.2.2.4 Threat of Substitutes
        5. 3.2.2.5 Intensity of Rivalry
      3. 3.2.3 COVID-19 Impact Analysis
        1. 3.2.3.1 Market Impact Analysis
        2. 3.2.3.2 Regional Impact
        3. 3.2.3.3 Opportunity and Threat Analysis
  4. 4 SECTION IV: QUANTITATIVE ANALYSIS
    1. 4.1 Aerospace & Defense, BY Application (USD Billion)
      1. 4.1.1 Missile Defense
      2. 4.1.2 Air Defense
      3. 4.1.3 Surveillance
      4. 4.1.4 Command and Control
      5. 4.1.5 Electronic Warfare
    2. 4.2 Aerospace & Defense, BY End Use (USD Billion)
      1. 4.2.1 Military
      2. 4.2.2 Government
      3. 4.2.3 Civil Defense
      4. 4.2.4 Commercial
      5. 4.2.5 Research
    3. 4.3 Aerospace & Defense, BY System Type (USD Billion)
      1. 4.3.1 Surface-to-Air Missile Systems
      2. 4.3.2 Anti-Aircraft Artillery Systems
      3. 4.3.3 Directed Energy Weapons
      4. 4.3.4 Counter-Unmanned Aerial Systems
      5. 4.3.5 Integrated Air Defense Systems
    4. 4.4 Aerospace & Defense, BY Technology (USD Billion)
      1. 4.4.1 Radar Systems
      2. 4.4.2 Guidance Systems
      3. 4.4.3 Communication Systems
      4. 4.4.4 Sensor Systems
      5. 4.4.5 Control Systems
    5. 4.5 Aerospace & Defense, BY Platform (USD Billion)
      1. 4.5.1 Land-Based Systems
      2. 4.5.2 Naval Systems
      3. 4.5.3 Aerial Systems
      4. 4.5.4 Mobile Systems
      5. 4.5.5 Fixed Systems
  5. 5 SECTION V: COMPETITIVE ANALYSIS
    1. 5.1 Competitive Landscape
      1. 5.1.1 Overview
      2. 5.1.2 Competitive Analysis
      3. 5.1.3 Market share Analysis
      4. 5.1.4 Major Growth Strategy in the Aerospace & Defense
      5. 5.1.5 Competitive Benchmarking
      6. 5.1.6 Leading Players in Terms of Number of Developments in the Aerospace & Defense
      7. 5.1.7 Key developments and growth strategies
        1. 5.1.7.1 New Product Launch/Service Deployment
        2. 5.1.7.2 Merger & Acquisitions
        3. 5.1.7.3 Joint Ventures
      8. 5.1.8 Major Players Financial Matrix
        1. 5.1.8.1 Sales and Operating Income
        2. 5.1.8.2 Major Players R&D Expenditure. 2023
    2. 5.2 Company Profiles
      1. 5.2.1 Lockheed Martin (US)
        1. 5.2.1.1 Financial Overview
        2. 5.2.1.2 Products Offered
        3. 5.2.1.3 Key Developments
        4. 5.2.1.4 SWOT Analysis
        5. 5.2.1.5 Key Strategies
      2. 5.2.2 Raytheon Technologies (US)
        1. 5.2.2.1 Financial Overview
        2. 5.2.2.2 Products Offered
        3. 5.2.2.3 Key Developments
        4. 5.2.2.4 SWOT Analysis
        5. 5.2.2.5 Key Strategies
      3. 5.2.3 Northrop Grumman (US)
        1. 5.2.3.1 Financial Overview
        2. 5.2.3.2 Products Offered
        3. 5.2.3.3 Key Developments
        4. 5.2.3.4 SWOT Analysis
        5. 5.2.3.5 Key Strategies
      4. 5.2.4 General Dynamics (US)
        1. 5.2.4.1 Financial Overview
        2. 5.2.4.2 Products Offered
        3. 5.2.4.3 Key Developments
        4. 5.2.4.4 SWOT Analysis
        5. 5.2.4.5 Key Strategies
      5. 5.2.5 Boeing (US)
        1. 5.2.5.1 Financial Overview
        2. 5.2.5.2 Products Offered
        3. 5.2.5.3 Key Developments
        4. 5.2.5.4 SWOT Analysis
        5. 5.2.5.5 Key Strategies
      6. 5.2.6 L3Harris Technologies (US)
        1. 5.2.6.1 Financial Overview
        2. 5.2.6.2 Products Offered
        3. 5.2.6.3 Key Developments
        4. 5.2.6.4 SWOT Analysis
        5. 5.2.6.5 Key Strategies
      7. 5.2.7 Huntington Ingalls Industries (US)
        1. 5.2.7.1 Financial Overview
        2. 5.2.7.2 Products Offered
        3. 5.2.7.3 Key Developments
        4. 5.2.7.4 SWOT Analysis
        5. 5.2.7.5 Key Strategies
      8. 5.2.8 Thales USA (US)
        1. 5.2.8.1 Financial Overview
        2. 5.2.8.2 Products Offered
        3. 5.2.8.3 Key Developments
        4. 5.2.8.4 SWOT Analysis
        5. 5.2.8.5 Key Strategies
    3. 5.3 Appendix
      1. 5.3.1 References
      2. 5.3.2 Related Reports
  6. 6 LIST OF FIGURES
    1. 6.1 MARKET SYNOPSIS
    2. 6.2 US MARKET ANALYSIS BY APPLICATION
    3. 6.3 US MARKET ANALYSIS BY END USE
    4. 6.4 US MARKET ANALYSIS BY SYSTEM TYPE
    5. 6.5 US MARKET ANALYSIS BY TECHNOLOGY
    6. 6.6 US MARKET ANALYSIS BY PLATFORM
    7. 6.7 KEY BUYING CRITERIA OF AEROSPACE & DEFENSE
    8. 6.8 RESEARCH PROCESS OF MRFR
    9. 6.9 DRO ANALYSIS OF AEROSPACE & DEFENSE
    10. 6.10 DRIVERS IMPACT ANALYSIS: AEROSPACE & DEFENSE
    11. 6.11 RESTRAINTS IMPACT ANALYSIS: AEROSPACE & DEFENSE
    12. 6.12 SUPPLY / VALUE CHAIN: AEROSPACE & DEFENSE
    13. 6.13 AEROSPACE & DEFENSE, BY APPLICATION, 2024 (% SHARE)
    14. 6.14 AEROSPACE & DEFENSE, BY APPLICATION, 2024 TO 2035 (USD Billion)
    15. 6.15 AEROSPACE & DEFENSE, BY END USE, 2024 (% SHARE)
    16. 6.16 AEROSPACE & DEFENSE, BY END USE, 2024 TO 2035 (USD Billion)
    17. 6.17 AEROSPACE & DEFENSE, BY SYSTEM TYPE, 2024 (% SHARE)
    18. 6.18 AEROSPACE & DEFENSE, BY SYSTEM TYPE, 2024 TO 2035 (USD Billion)
    19. 6.19 AEROSPACE & DEFENSE, BY TECHNOLOGY, 2024 (% SHARE)
    20. 6.20 AEROSPACE & DEFENSE, BY TECHNOLOGY, 2024 TO 2035 (USD Billion)
    21. 6.21 AEROSPACE & DEFENSE, BY PLATFORM, 2024 (% SHARE)
    22. 6.22 AEROSPACE & DEFENSE, BY PLATFORM, 2024 TO 2035 (USD Billion)
    23. 6.23 BENCHMARKING OF MAJOR COMPETITORS
  7. 7 LIST OF TABLES
    1. 7.1 LIST OF ASSUMPTIONS
  8. 7.1.1
    1. 7.2 US MARKET SIZE ESTIMATES; FORECAST
      1. 7.2.1 BY APPLICATION, 2026-2035 (USD Billion)
      2. 7.2.2 BY END USE, 2026-2035 (USD Billion)
      3. 7.2.3 BY SYSTEM TYPE, 2026-2035 (USD Billion)
      4. 7.2.4 BY TECHNOLOGY, 2026-2035 (USD Billion)
      5. 7.2.5 BY PLATFORM, 2026-2035 (USD Billion)
    2. 7.3 PRODUCT LAUNCH/PRODUCT DEVELOPMENT/APPROVAL
  9. 7.3.1
    1. 7.4 ACQUISITION/PARTNERSHIP
  10. 7.4.1

US Aerospace & Defense Market Segmentation

Aerospace & Defense By Application (USD Billion, 2026-2035)

  • Missile Defense
  • Air Defense
  • Surveillance
  • Command and Control
  • Electronic Warfare

Aerospace & Defense By End Use (USD Billion, 2026-2035)

  • Military
  • Government
  • Civil Defense
  • Commercial
  • Research

Aerospace & Defense By System Type (USD Billion, 2026-2035)

  • Surface-to-Air Missile Systems
  • Anti-Aircraft Artillery Systems
  • Directed Energy Weapons
  • Counter-Unmanned Aerial Systems
  • Integrated Air Defense Systems

Aerospace & Defense By Technology (USD Billion, 2026-2035)

  • Radar Systems
  • Guidance Systems
  • Communication Systems
  • Sensor Systems
  • Control Systems

Aerospace & Defense By Platform (USD Billion, 2026-2035)

  • Land-Based Systems
  • Naval Systems
  • Aerial Systems
  • Mobile Systems
  • Fixed Systems

Compare Licence

×
Features License Type
Single User Multiuser License Enterprise User
Price $4,950 $5,950 $7,250
Maximum User Access Limit 1 User Upto 10 Users Unrestricted Access Throughout the Organization
Free Customization
Direct Access to Analyst
Deliverable Format
Platform Access
Discount on Next Purchase 10% 15% 15%
Printable Versions