ID: MRFR/F-B & N/2099-CR | July 2017 | Region: Global | 114 pages
Report Description:
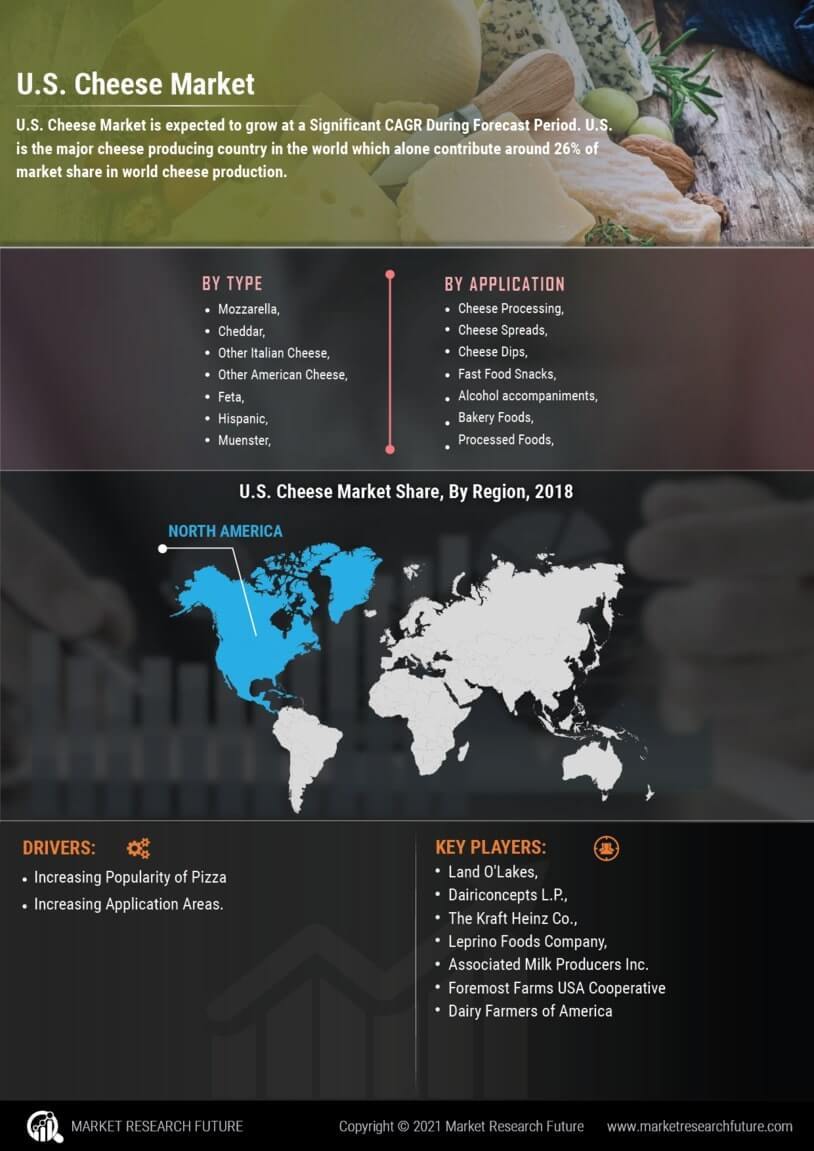
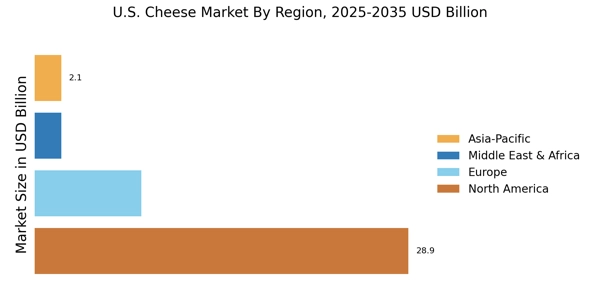
U.S. is the major cheese producing country in the world which alone contribute around 26% of market share in world cheese production. U.S. Cheese market is projected to reach 6787 Kilo Tons by year 2023 with growth rate of 3.41% during the period 2017 to 2023. Wisconsin and California together holds more than 50% of market share in U.S. cheese production. Wisconsin state alone captures major market share of more than 28% in 2017 and it will grow at the rate of 3.55% during the forecast period as majority of cheese producing plants are located in Wisconsin and California. California will witness significant growth rate during 2017 to 2023 due to increasing milk production in California.
Mozzarella will continue to dominate the U.S. Cheese market with more than 50% of market share in 2017. Increasing popularity of pizza and other fast foods is creating huge demand of Mozzarella cheese which will result in faster growth of Mozzarella cheese compare to other cheese types. The production of Cheddar cheese will grow at CAGR of 3.43% during the forecast period. Advancement in manufacturing process and availability of raw material is supporting the growth of various types of cheese that includes Feta, Hispanic, Montery Jack and Cream cheese.
Wisconsin is the major cheese producing state of U.S. which captures around 30% of market share in U.S. during 2017. Wisconsin cheese market is projected to reach around 1900 Kilo Tons with growth rate of 3.55% by 2023. In Wisconsin, Mozzarella cheese has large market share in 2017 and it is growing at faster rate compare to other cheese product type. Other Italian cheese mainly includes Provolone, Parmesan and Romano cheese. Other American cheese mainly includes Bergenost, Bloomsdale, Dorset, Cup Cheese and many more.
Key Players:
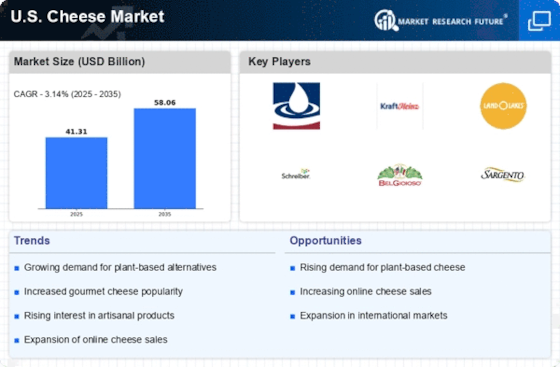
The leading market players in the U.S. Cheese market primarily are Land O'Lakes, Inc., Dairiconcepts L.P., The Kraft Heinz Co., Leprino Foods Company, Associated Milk Producers Inc. Foremost Farms USA Cooperative and Dairy Farmers of America Inc.
In 2013, in order to strengthen the company’s portfolio, Land O'Lakes, Inc. acquired a firm named Geosys, which is a company that provides satellite imaging and insights to agribusiness, where as in 2017, Land O'Lakes, Inc. acquired company named Vermont Creamery. In 2013, Dairy Farmers of America Inc. Dairy Maid Dairy., located in Frederick, Maryland, the U.S.
U.S. Cheese Market, By Volume, Kilo Tons (2014-2023)
Target Audience:
The reports also cover country level analysis:
Frequently Asked Questions (FAQ) :
US cheese market is projected to grow at a 3.41% CAGR between 2017-2023.
Wisconsin is expected to dominate the US cheese market.
US cheese market is predicted to touch 6787 KT by 2023.
Key players profiled in the US cheese market include Dairy Farmers of America Inc., Foremost Farms USA Cooperative, Associated Milk Producers Inc., Leprino Foods Company, The Kraft Heinz Co., Dairiconcepts L.P., and Land O'Lakes, Inc.
Skimmed cow milk will lead the US cheese market.
1 Executive Summary
2 Introduction
2.1 Scope of the Study 13
2.1.1 Research Objective 13
2.1.2 Assumptions 13
2.1.3 Limitations 13
2.2 Market Structure 14
3 Research Methodology
3.1 Introduction 16
3.2 Primary Research 17
4 Secondary Research
5 Market Dynamics
5.1 Introduction 19
5.1.1 Drivers 20
5.1.1.1 Wider applications of cheese 20
5.1.1.2 Increase in consumer acceptance of ethnic cooking, such as Italian & Mexican 20
5.1.1.3 Increase in demand for cheese based snacks 20
5.1.2 Restraints 21
5.1.2.1 Increase in imports restraining limiting domestic cheese sales 21
5.1.2.2 Hike in milk price 21
5.1.2.3 Mixed Cheese Demand 21
5.1.3 Opportunities 22
5.1.3.1 Growth in Export 22
5.1.3.2 High milk production potential 22
5.1.3.3 High downstream market base 22
5.1.4 Challenges 22
5.1.4.1 Rise in obesity population 22
5.1.4.2 Microbial spoilage of cheese 23
5.1.4.3 Lower shelf life of the product 23
6 Market Trends
6.1 Trends in Supply/Production 24
6.2 Trends in Demand/Consumption by Application 25
6.3 Emerging Markets (Supply & Demand) 26
7 Emerging Markets for U.S. Cheese
7.1 Introduction 27
7.2 Trend in Cheese and Curd exports and imports 27
7.2.1 Trend in Cheese and Curd Exports by U.S. 27
7.2.2 Trend in Cheese and curd Imports 28
7.3 Innovations in Products/Process of Cheese in U.S. 29
7.4 Macroeconomic Indicator Analysis for U.S. Market 31
7.4.1 Pestle analysis-U.S. 31
8 Market Factor Analysis
8.1 Introduction 33
8.2 Value Chain Analysis 33
8.3 Porter’s Five Forces 36
8.3.1 Threat of New Entrants 37
8.3.2 Threat of Substitutes 37
8.3.3 Bargaining power of Buyers 37
8.3.4 Bargaining power of Suppliers 37
8.3.5 Intensity of Rivalry 38
8.4 Supply Chain Analysis 38
9 U.S. Cheese Market Overview
9.1 U.S. Cheese Market, by State (2020-2027), Kilo Tons 39
9.2 U.S. Cheese Market, by Product Type (2020-2027), Kilo Tons 41
9.3 U.S. Cheese Market, by Source (2020-2027), Kilo Tons 42
9.4 U.S. Cheese Market, by Type (2020-2027), Kilo Tons 42
9.5 U.S. Cheese Market, by Application (2020-2027), Kilo Tons 43
10 U.S. Cheese Market-By Product Type
10.1 U.S. Cheese Market, by Product Type (2020-2027), Kilo Tons 45
10.2 U.S. Cheese Market, Mozzarella, by State (2020-2027), Kilo Tons 46
10.3 U.S. Cheese Market, Other Italian Cheese, by State (2020-2027), Kilo Tons 47
10.4 U.S. Cheese Market, Other American Cheese, by State (2020-2027), Kilo Tons 47
10.5 U.S. Cheese Market, Feta, by State (2020-2027), Kilo Tons 48
10.6 U.S. Cheese Market, Hispanic, by State (2020-2027), Kilo Tons 48
10.7 U.S. Cheese Market, Muenster, by State (2020-2027), Kilo Tons 49
10.8 U.S. Cheese Market, Montery Jack, by State (2020-2027), Kilo Tons 49
10.9 U.S. Cheese Market, Colby Jack, by State (2020-2027), Kilo Tons 50
10.10 U.S. Cheese Market, Cream cheese, by State (2020-2027), Kilo Tons 50
10.11 U.S. Cheese Market, Cottage cheese, by State (2020-2027), Kilo Tons 51
10.12 U.S. Cheese Market, Pepper Jack, by State (2020-2027), Kilo Tons 51
10.13 U.S. Cheese Market, Other Cheese, by State (2020-2027), Kilo Tons 52
11 U.S. Cheese Market -By Source
11.1 U.S. Cheese Market, by Source (2020-2027), Kilo Tons 54
11.2 U.S. Cheese Market, Whole Cow Milk, by State (2020-2027), Kilo Tons 54
11.3 U.S. Cheese Market, Skimmed Cow Milk, by State (2020-2027), Kilo Tons 55
11.4 U.S. Cheese Market, Other Milk, by State (2020-2027), Kilo Tons 56
12 U.S. Cheese Market-By Type
12.1 U.S. Cheese Market, by Type (2020-2027), Kilo Tons 58
12.2 U.S. Cheese Market, Fresh Cheese, by State (2020-2027), Kilo Tons 59
12.3 U.S. Cheese Market, Aged Fresh, by State (2020-2027), Kilo Tons 59
12.4 U.S. Cheese Market, Soft White, by State (2020-2027), Kilo Tons 60
12.5 U.S. Cheese Market, Semi Soft, by State (2020-2027), Kilo Tons 61
12.6 U.S. Cheese Market, Hard Cheese, by State (2020-2027), Kilo Tons 61
12.7 U.S. Cheese Market, Blue Cheese, by State (2020-2027), Kilo Tons 62
12.8 U.S. Cheese Market, Flavored Cheese, by State (2020-2027), Kilo Tons 63
12.9 U.S. Cheese Market, Other Cheese, by State (2020-2027), Kilo Tons 63
13 U.S. Cheese Market-By Application
13.1 U.S. Cheese Market, by Application (2020-2027), Kilo Tons 66
13.2 U.S. Cheese Market, Cheese Processing, by State (2020-2027), Kilo Tons 67
13.3 U.S. Cheese Market, Cheese Spreads, by State (2020-2027), Kilo Tons 67
13.4 U.S. Cheese Market, Cheese Dips, by State (2020-2027), Kilo Tons 68
13.5 U.S. Cheese Market, Fast Food Snacks, by State (2020-2027), Kilo Tons 69
13.6 U.S. Cheese Market, Alcohol Accompaniments, by State (2020-2027), Kilo Tons 69
13.7 U.S. Cheese Market, Bakery Foods, by State (2020-2027), Kilo Tons 70
13.8 U.S. Cheese Market, Processed Foods, by State (2020-2027), Kilo Tons 71
13.9 U.S. Cheese Market, Savory Snacks, by State (2020-2027), Kilo Tons 71
13.10 U.S. Cheese Market, Other Application, by State (2020-2027), Kilo Tons 72
14 Wisconsin Cheese Market
14.1 Wisconsin. Cheese Market, by Product Type (2020-2027), Kilo Tons 73
14.2 Wisconsin. Cheese Market, by Source, (2020-2027), Kilo Tons 74
14.3 Wisconsin. Cheese Market, by Type, (2020-2027), Kilo Tons 74
14.4 Wisconsin. Cheese Market, by Application, (2020-2027), Kilo Tons 75
15 California Cheese Market
15.1 California. Cheese Market, by Product Type, (2020-2027), Kilo Tons 76
15.2 California. Cheese Market, by Source, (2020-2027), Kilo Tons 76
15.3 California. Cheese Market, by Type, (2020-2027), Kilo Tons 77
15.4 California. Cheese Market, by Application, (2020-2027), Kilo Tons 78
16 Idaho Cheese Market
16.1 Idaho Cheese Market, by Product Type, (2020-2027), Kilo Tons 79
16.2 Idaho Cheese Market, by Source, (2020-2027), Kilo Tons 80
16.3 Idaho Cheese Market, by Type, (2020-2027), Kilo Tons 80
16.4 Idaho Cheese Market, by Application, (2020-2027), Kilo Tons 81
17 New York Cheese Market
17.1 New York Cheese Market, by Product Type, (2020-2027), Kilo Tons 82
17.2 New York Cheese Market, by Source, (2020-2027), Kilo Tons 82
17.3 New York Cheese Market, by Type, (2020-2027), Kilo Tons 83
17.4 New York Cheese Market, by Application, (2020-2027), Kilo Tons 84
18 New Mexico Cheese Market
18.1 New Mexico Cheese Market, by Product Type, (2020-2027), Kilo Tons 85
18.2 New Mexico Cheese Market, by Source, (2020-2027), Kilo Tons 85
18.3 New Mexico Cheese Market, by Type, (2020-2027), Kilo Tons 86
18.4 New Mexico Cheese Market, by Application, (2020-2027), Kilo Tons 87
19 Minnesota Cheese Market
19.1 Minnesota Cheese Market, by Product Type, (2020-2027), Kilo Tons 88
19.2 Minnesota Cheese Market, by Source, (2020-2027), Kilo Tons 88
19.3 Minnesota Cheese Market, by Type, (2020-2027), Kilo Tons 89
19.4 Minnesota Cheese Market, by Application, (2020-2027), Kilo Tons 90
20 Rest of U.S. Cheese Market
20.1 Rest of U.S. Cheese Market, by Product Type, (2020-2027), Kilo Tons 91
20.2 Rest of U.S. Cheese Market, by Source (2020-2027), Kilo Tons 91
20.3 Rest of U.S. Cheese Market, by Type (2020-2027), Kilo Tons 92
20.4 Rest of U.S. Cheese Market, by Application (2020-2027), Kilo Tons 93
21 Company Profile
21.1 Land O'Lakes, Inc. (U.S.) 94
21.1.1 Overview 94
21.1.2 Company Snapshot 94
21.1.3 Product Portfolio 95
21.2 Dairiconcepts, L.P. (U.S.) 96
21.2.1 Overview 96
21.2.2 Company Snapshot 96
21.2.3 Product Portfolio 96
21.2.4 Recent Developments 97
21.3 The Kraft Heinz Co. (U.S.) 98
21.3.1 Overview 98
21.3.2 Company Snapshot 98
21.3.3 Product Portfolio 99
21.4 Leprino Foods Company (U.S.) 100
21.4.1 Overview 100
21.4.2 Company Snapshot 100
21.4.3 Product Portfolio 100
21.5 Associated Milk Producers Inc. (U.S.) 102
21.5.1 Overview 102
21.5.2 Company Snapshot 102
21.5.3 Product Portfolio 102
21.6 Foremost Farms USA Cooperative (U.S.) 104
21.6.1 Overview 104
21.6.2 Company Snapshot 104
21.6.3 Product Portfolio 104
21.7 Dairy Farmers of America Inc. (U.S.) 106
21.7.1 Overview 106
21.7.2 Company Snapshot 106
21.7.3 Product Portfolio 106
22 Competitive Landscape
22.1 Introduction 108
22.2 New Product Launch 110
22.3 Business Expansion 110
22.4 Investment 111
22.5 Acquisitions 111
22.6 Merger and Partnership 112
23 List of Tables
TABLE 1 INNOVATIONS IN PRODUCTS/PROCESS IN PROTEINS 29
TABLE 2 PESTLE ANALYSIS-U.S. 31
TABLE 3 U.S. CHEESE MARKET, BY STATE (2020-2027), KILO TONS 39
TABLE 4 U.S. CHEESE MARKET, BY PRODUCT TYPE (2020-2027), KILO TONS 41
TABLE 5 U.S. CHEESE MARKET, BY SOURCE (2020-2027), KILO TONS 42
TABLE 6 U.S. CHEESE MARKET, BY TYPE (2020-2027), KILO TONS 42
TABLE 7 U.S. CHEESE MARKET, BY APPLICATION (2020-2027), KILO TONS 43
TABLE 8 U.S. CHEESE MARKET, BY PRODUCT TYPE (2020-2027), KILO TONS 45
TABLE 9 U.S. CHEESE MARKET, MOZZARELLA, BY STATE (2020-2027), KILO TONS 46
TABLE 10 U.S. CHEESE MARKET, CHEDDAR, BY STATE (2020-2027), KILO TONS 46
TABLE 11 U.S. CHEESE MARKET, OTHER ITALIAN CHEESE, BY STATE (2020-2027), KILO TONS 47
TABLE 12 U.S. CHEESE MARKET, OTHER AMERICAN CHEESE, BY STATE (2020-2027), KILO TONS 47
TABLE 13 U.S. CHEESE MARKET, FETA, BY STATE (2020-2027), KILO TONS 48
TABLE 14 U.S. CHEESE MARKET, HISPANIC, BY STATE (2020-2027), KILO TONS 48
TABLE 15 U.S. CHEESE MARKET, MUENSTER, BY STATE (2020-2027), KILO TONS 49
TABLE 16 U.S. CHEESE MARKET, MONTERY JACK, BY STATE (2020-2027), KILO TONS 49
TABLE 17 U.S. CHEESE MARKET, COLBY JACK, BY STATE (2020-2027), KILO TONS 50
TABLE 18 U.S. CHEESE MARKET, CREAM CHEESE, BY STATE (2020-2027), KILO TONS 50
TABLE 19 U.S. CHEESE MARKET, COTTAGE CHEESE,, BY STATE (2020-2027), KILO TONS 51
TABLE 20 U.S. CHEESE MARKET, PEPPER JACK,, BY STATE (2020-2027), KILO TONS 51
TABLE 21 U.S. CHEESE MARKET, OTHER CHEESE, BY STATE (2020-2027), KILO TONS 52
TABLE 22 U.S. CHEESE MARKET, BY SOURCE (2020-2027), KILO TONS 54
TABLE 23 U.S. CHEESE MARKET, WHOLE MILK POWDER, BY STATE (2020-2027), KILO TONS 54
TABLE 24 U.S. CHEESE MARKET, SKIMMED MILK POWDER, BY STATE (2020-2027), KILO TONS 55
TABLE 25 U.S. CHEESE MARKET, SKIMMED MILK POWDER, BY STATE (2020-2027), KILO TONS 56
TABLE 26 U.S. CHEESE MARKET, BY TYPE (2020-2027), KILO TONS 58
TABLE 27 U.S. CHEESE MARKET, FRESH CHEESE, BY STATE (2020-2027), KILO TONS 59
TABLE 28 U.S. CHEESE MARKET, AGED FRESH, BY STATE (2020-2027), KILO TONS 59
TABLE 29 U.S. CHEESE MARKET, SOFT WHITE, BY STATE (2020-2027), KILO TONS 60
TABLE 30 U.S. CHEESE MARKET, SEMI SOFT, BY STATE (2020-2027), KILO TONS 61
TABLE 31 U.S. CHEESE MARKET, HARD CHEESE, BY STATE (2020-2027), KILO TONS 61
TABLE 32 U.S. CHEESE MARKET, BLUE CHEESE, BY STATE (2020-2027), KILO TONS 62
TABLE 33 U.S. CHEESE MARKET, FLAVORED CHEESE, BY STATE (2020-2027), KILO TONS 63
TABLE 34 U.S. CHEESE MARKET, OTHER CHEESE, BY STATE (2020-2027), KILO TONS 63
TABLE 35 U.S. CHEESE MARKET, BY APPLICATION (2020-2027), KILO TONS 66
TABLE 36 U.S. CHEESE MARKET, CHEESE PROCESSING, BY STATE (2020-2027), KILO TONS 67
TABLE 37 U.S. CHEESE MARKET, CHEESE SPREADS, BY STATE (2020-2027), KILO TONS 67
TABLE 38 U.S. CHEESE MARKET, CHEESE DIPS, BY STATE (2020-2027), KILO TONS 68
TABLE 39 U.S. CHEESE MARKET, FAST FOOD SNACKS, BY STATE (2020-2027), KILO TONS 69
TABLE 40 U.S. CHEESE MARKET, ALCOHOL ACCOMPANIMENTS, BY STATE (2020-2027), KILO TONS 69
TABLE 41 U.S. CHEESE MARKET, BAKERY FOODS, BY STATE (2020-2027), KILO TONS 70
TABLE 42 U.S. CHEESE MARKET, PROCESSED FOODS, BY STATE (2020-2027), KILO TONS 71
TABLE 43 U.S. CHEESE MARKET, SAVORY SNACKS, BY STATE (2020-2027), KILO TONS 71
TABLE 44 U.S. CHEESE MARKET, OTHER APPLICATION, BY STATE (2020-2027), KILO TONS 72
TABLE 45 WISCONSIN CHEESE MARKET, PRODUCT TYPE, BY STATE (2020-2027), KILO TONS 73
TABLE 46 WISCONSIN CHEESE MARKET, BY SOURCE, (2020-2027), KILO TONS 74
TABLE 47 WISCONSIN CHEESE MARKET, BY TYPE, (2020-2027), KILO TONS 74
TABLE 48 WISCONSIN CHEESE MARKET, BY APPLICATION, (2020-2027), KILO TONS 75
TABLE 49 CALIFORNIA CHEESE MARKET, BY PRODUCT TYPE, (2020-2027), KILO TONS 76
TABLE 50 CALIFORNIA CHEESE MARKET, BY SOURCE, (2020-2027), KILO TONS 76
TABLE 51 CALIFORNIA CHEESE MARKET, BY APPLICATION, (2020-2027), KILO TONS 78
TABLE 52 IDAHO CHEESE MARKET, BY PRODUCT TYPE, (2020-2027), KILO TONS 79
TABLE 53 IDAHO CHEESE MARKET, BY SOURCE, (2020-2027), KILO TONS 80
TABLE 54 IDAHO CHEESE MARKET, BY TYPE, (2020-2027), KILO TONS 80
TABLE 55 IDAHO CHEESE MARKET, BY APPLICATION, (2020-2027), KILO TONS 81
TABLE 56 NEW YORK CHEESE MARKET, BY PRODUCT TYPE, (2020-2027), KILO TONS 82
TABLE 57 NEW YORK CHEESE MARKET, BY PRODUCT TYPE, (2020-2027), KILO TONS 82
TABLE 58 NEW YORK CHEESE MARKET, BY TYPE, (2020-2027), KILO TONS 83
TABLE 59 NEW YORK CHEESE MARKET, BY APPLICATION, (2020-2027), KILO TONS 84
TABLE 60 NEW MEXICO CHEESE MARKET, BY PRODUCT TYPE, (2020-2027), KILO TONS 85
TABLE 61 NEW MEXICO CHEESE MARKET, BY SOURCE, (2020-2027), KILO TONS 85
TABLE 62 NEW MEXICO CHEESE MARKET, BY TYPE, (2020-2027), KILO TONS 86
TABLE 63 NEW MEXICO CHEESE MARKET, BY APPLICATION, (2020-2027), KILO TONS 87
TABLE 64 MINNESOTA CHEESE MARKET, BY PRODUCT TYPE, (2020-2027), KILO TONS 88
TABLE 65 MINNESOTA CHEESE MARKET, BY SOURCE, (2020-2027), KILO TONS 88
TABLE 66 MINNESOTA CHEESE MARKET, BY TYPE, (2020-2027), KILO TONS 89
TABLE 67 MINNESOTA CHEESE MARKET, BY APPLICATION, (2020-2027), KILO TONS 90
TABLE 68 REST OF U.S. CHEESE MARKET, BY PRODUCT TYPE, (2020-2027), KILO TONS 91
TABLE 69 REST OF U.S. CHEESE MARKET, BY SOURCE, (2020-2027), KILO TONS 91
TABLE 70 REST OF U.S. CHEESE MARKET, BY TYPE, (2020-2027), KILO TONS 92
TABLE 71 REST OF U.S. CHEESE MARKET, BY APPLICATION, (2020-2027), KILO TONS 93
TABLE 72 LAND O'LAKES, INC., CHEESE PRODUCTS 95
TABLE 73 RECENT DEVELOPMENTS 95
TABLE 74 DAIRICONCEPTS, L.P., CHEESE PRODUCTS 96
TABLE 75 THE KRAFT HEINZ CO., CHEESE PRODUCTS 99
TABLE 76 RECENT DEVELOPMENTS 99
TABLE 77 LEPRINO FOODS COMPANY, CHEESE PRODUCTS 100
TABLE 78 RECENT DEVELOPMENTS 101
TABLE 79 ASSOCIATED MILK PRODUCERS INC, CHEESE PRODUCTS 102
TABLE 80 RECENT DEVELOPMENTS 103
TABLE 81 FOREMOST FARMS USA COOPERATIVE, CHEESE PRODUCTS 104
TABLE 82 RECENT DEVELOPMENTS 105
TABLE 83 DAIRY FARMERS OF AMERICA INC., CHEESE PRODUCTS 106
TABLE 84 RECENT DEVELOPMENTS 107
TABLE 85 COMPETIVE LANDSCAPING: U.S. CHEESE MARKET: BY STRATEGY 109
24 List of Figures
FIGURE 1 RESEARCH METHODOLOGY 16
FIGURE 2 PRIMARY RESEARCH 17
FIGURE 3 SECONDARY DATA ANALYSIS APPROACH 18
FIGURE 4 MARKET DYNAMICS ANALYSIS 19
FIGURE 5 KEY DRIVERS IN U.S. CHEESE MARKET 20
FIGURE 6 KEY RESTRAINTS IN U.S. CHEESE MARKET 21
FIGURE 7 GLOBAL CHEESE MARKET SUPPLY TRENDS AND FORECAST (2020-2027) 24
FIGURE 8 U.S. CHEESE MARKET DEMAND TRENDS AND FORECAST, BY APPLICATION (2020-2027) 25
FIGURE 9 EMERGING MARKETS (SUPPLY & DEMAND) 26
FIGURE 10 TREND IN CHEESE AND CURD EXPORT BY U.S. TO OTHER COUNTRIES 27
FIGURE 11 TREND IN CHEESE AND CURD IMPORTS BY U.S. FROM OTHER COUNTRIES 28
FIGURE 12 ATENTS ON CHEESE (2015-2017) 30
FIGURE 13 VALUE CHAIN OF CHEESE 33
FIGURE 14 PORTER FIVE FORCES- U.S. CHEESE MARKET 36
FIGURE 15 SUPPLY CHAIN OF CHEESE 38
FIGURE 16 U.S. MARKET GROWTH ANALYSIS BY STATE : 2017 TO 2023 40
FIGURE 17 CALIFORNIA CHEESE MARKET, BY TYPE, (2020-2027), KILO TONS 77
FIGURE 18 LAND O'LAKES, INC., COMPANY SNAPSHOT 94
FIGURE 19 DAIRICONCEPTS, L.P. ,COMPANY SNAPSHOT 96
FIGURE 20 THE KRAFT HEINZ CO., COMPANY SNAPSHOT 98
FIGURE 21 LEPRINO FOODS COMPANY, COMPANY SNAPSHOT 100
FIGURE 22 ASSOCIATED MILK PRODUCERS INC, COMPANY SNAPSHOT 102
FIGURE 23 FOREMOST FARMS USA COOPERATIVE, COMPANY SNAPSHOT 104
FIGURE 24 DAIRY FARMERS OF AMERICA INC., COMPANY SNAPSHOT 106
FIGURE 25 COMPETIVE LANDSCAPING: U.S. CHEESE MARKET: BY STRATEGY 108