Trade Finance Market (2026 - 2035)

ID: MRFR/BS/23074-HCR 200 Pages Aarti Dhapte Last Updated: October 16, 2026

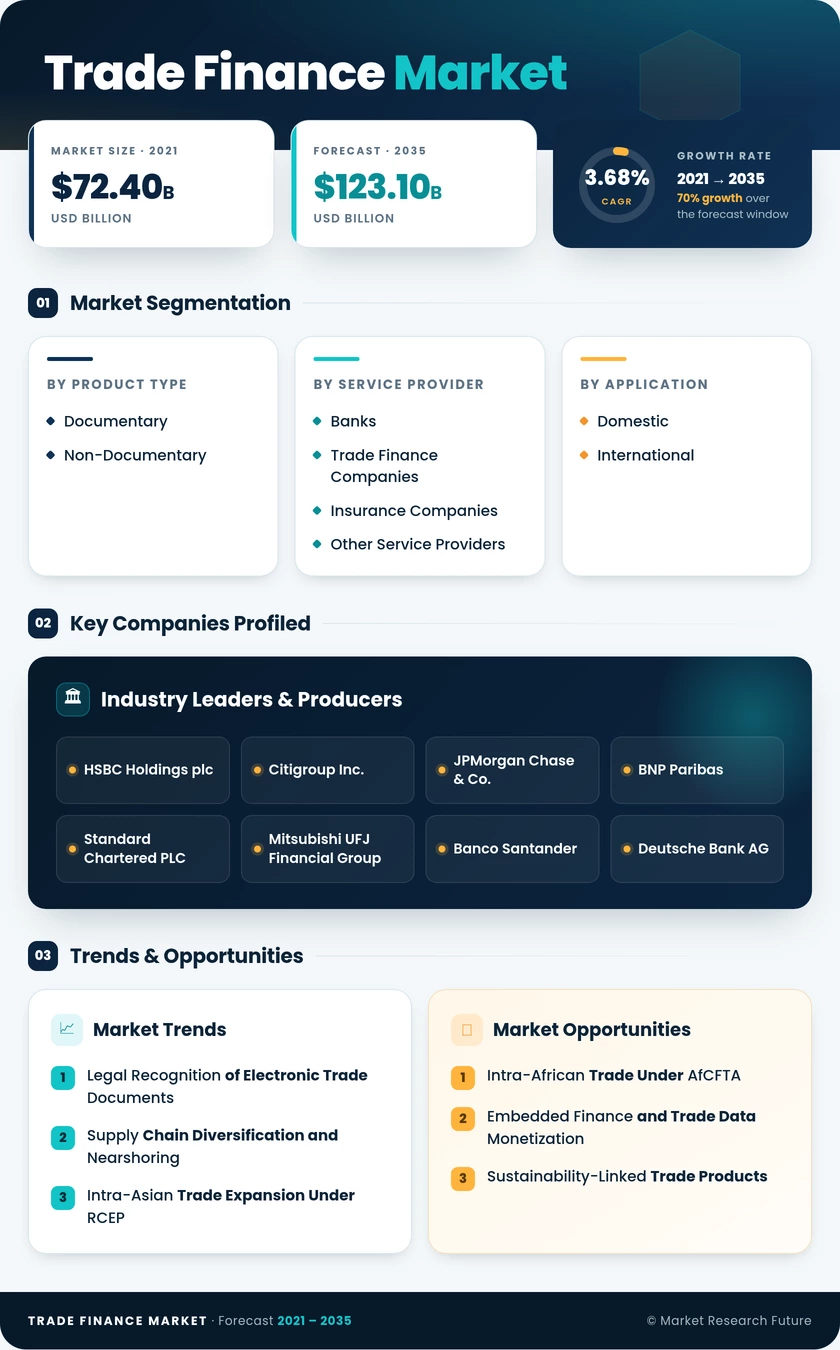
Trade Finance Market Size, Share and Research Report By Product Type (Documentary, Non-Documentary), By Service Provider (Banks, Trade Finance Companies, Insurance Companies, Other Service Providers), By Application (Domestic, International), By Company Size (Large Enterprises, Small and Medium-sized Enterprises (SMEs)), By Financing Structure (Structured Trade Finance, Non-Structured Trade Financing) and By Regional (North America, Europe, South America, Asia Pacific, Middle East and Africa) - Industry Forecast to 2035.

Trade Finance Market
Market Size
Forecast Period2026-2035
CAGR (2026-2035)3.68%
2025 Market SizeUSD 85.9 Billion
2035 Market SizeUSD 123.1 Billion
Key Players
HSBC Holdings plc
Citigroup Inc.
JPMorgan Chase & Co.
BNP Paribas
Standard Chartered PLC
Mitsubishi UFJ Financial Group
Opportunities
  • Intra-African Trade Under AfCFTA
  • Embedded Finance and Trade Data Monetization
  • Sustainability-Linked Trade Products
  1. 1 Market Summary | |
  2. 2 Key Report Takeaways | |
    1. 2.1 By Product Type | |
    2. 2.2 By Service Provider | |
    3. 2.3 By Application | |
    4. 2.4 By Company Size | |
    5. 2.5 By Financing Structure | |
    6. 2.6 By Region | |
  3. 3 Market Size and Forecast (2021–2035) | |
  4. 4 Driver Impact Analysis | |
    1. 4.1 Legal Recognition of Electronic Trade Documents | |
    2. 4.2 Supply Chain Diversification and Nearshoring | |
    3. 4.3 Intra-Asian Trade Expansion Under RCEP | |
    4. 4.4 Multilateral Guarantees Closing the SME Gap | |
    5. 4.5 Buyer-Led Payables Finance Programs | |
    6. 4.6 Energy-Transition Commodity Flows | |
  5. 5 Restraints Impact Analysis | |
    1. 5.1 Tariff Escalation and Trade Fragmentation | |
    2. 5.2 KYC/AML Burden and Bank De-Risking | |
    3. 5.3 Basel III Capital and Leverage Constraints | |
    4. 5.4 Documentary Fraud and Collateral Risk | |
    5. 5.5 Fragmented Digital Platforms | |
  6. 6 Opportunities | |
    1. 6.1 Intra-African Trade Under AfCFTA | |
    2. 6.2 Embedded Finance and Trade Data Monetization | |
    3. 6.3 Sustainability-Linked Trade Products | |
    4. 6.4 Electronic Bill of Lading Finance | |
    5. 6.5 Domestic Supplier Finance in Emerging Economies | |
  7. 7 Regional Market Share and Country-Level Analysis | |
    1. 7.1 North America | | |
      1. 7.1.1 United States | | |
      2. 7.1.2 Canada | | |
      3. 7.1.3 Mexico | |
    2. 7.2 South America | | |
      1. 7.2.1 Brazil | | |
      2. 7.2.2 Peru | | |
      3. 7.2.3 Chile | | |
      4. 7.2.4 Argentina | | |
      5. 7.2.5 Rest of South America | |
    3. 7.3 Europe | | |
      1. 7.3.1 United Kingdom | | |
      2. 7.3.2 Germany | | |
      3. 7.3.3 France | | |
      4. 7.3.4 Spain | | |
      5. 7.3.5 Italy | | |
      6. 7.3.6 BENELUX (Belgium, Netherlands, Luxembourg) | | |
      7. 7.3.7 NORDICS (Denmark, Finland, Iceland, Norway, Sweden) | | |
      8. 7.3.8 Rest of Europe | |
    4. 7.4 Asia-Pacific | | |
      1. 7.4.1 India | | |
      2. 7.4.2 China | | |
      3. 7.4.3 Japan | | |
      4. 7.4.4 Australia | | |
      5. 7.4.5 South Korea | | |
      6. 7.4.6 South-East Asia (Singapore, Malaysia, Thailand, Indonesia, Vietnam, Philippines) | | |
      7. 7.4.7 Rest of Asia-Pacific | |
    5. 7.5 Middle East and Africa | | |
      1. 7.5.1 United Arab Emirates | | |
      2. 7.5.2 Saudi Arabia | | |
      3. 7.5.3 South Africa | | |
      4. 7.5.4 Nigeria | | |
      5. 7.5.5 Rest of Middle East and Africa | |
  8. 8 Future Outlook (2026–2035) | |
    1. 8.1 AI-Driven Document Checking and Compliance | |
    2. 8.2 Digital Negotiable Instruments Become the Norm | |
    3. 8.3 Geoeconomic Corridor Rewiring | |
    4. 8.4 Sustainability Reporting in Trade Credit | |
  9. 9 Segmentation Analysis | |
    1. 9.1 By Product Type | | |
      1. 9.1.1 Documentary | | |
      2. 9.1.2 Non-Documentary | |
    2. 9.2 By Service Provider | | |
      1. 9.2.1 Banks | | |
      2. 9.2.2 Trade Finance Companies | | |
      3. 9.2.3 Insurance Companies | | |
      4. 9.2.4 Other Service Providers | |
    3. 9.3 By Application | | |
      1. 9.3.1 Domestic | | |
      2. 9.3.2 International | |
    4. 9.4 By Company Size | | |
      1. 9.4.1 Large Enterprises | | |
      2. 9.4.2 Small and Medium-sized Enterprises (SMEs) | |
    5. 9.5 By Financing Structure | | |
      1. 9.5.1 Structured Trade Finance | | |
      2. 9.5.2 Non-Structured Trade Financing | |
  10. 10 Competitive Landscape | |
    1. 10.1 Market Concentration Analysis | |
    2. 10.2 Competitive Benchmarking Matrix | |
    3. 10.3 Company Profiles | | |
      1. 10.3.1 HSBC Holdings plc | | |
      2. 10.3.2 Citigroup Inc. | | |
      3. 10.3.3 JPMorgan Chase & Co. | | |
      4. 10.3.4 BNP Paribas | | |
      5. 10.3.5 Standard Chartered PLC | | |
      6. 10.3.6 Mitsubishi UFJ Financial Group | | |
      7. 10.3.7 Banco Santander | | |
      8. 10.3.8 Deutsche Bank AG | | |
      9. 10.3.9 Bank of America | | |
      10. 10.3.10 Allianz Trade | |
  11. 11 Recent News & Developments | |
  12. 12 Report Scope and Methodology | |
  13. 13 Detailed Sources and Citations | |
  14. 14 Frequently Asked Questions (FAQs) | | LIST OF TABLES | |
  15. TABLE 1 Global Trade Finance Summary Metrics, 2025–2035 | |
  16. TABLE 2 Global Trade Finance Size & Forecast, by Revenue (USD Billion), 2021–2035 | |
  17. TABLE 3 Driver Impact Analysis, 2026–2035 | |
  18. TABLE 4 Restraints Impact Analysis, 2026–2035 | |
  19. TABLE 5 Global Trade Finance Size, by Region, 2025 (USD Billion) | |
  20. TABLE 6 North America Trade Finance, by Country, 2025 | |
  21. TABLE 7 South America Trade Finance, by Country, 2025 | |
  22. TABLE 8 Europe Trade Finance, by Country, 2025 | |
  23. TABLE 9 Asia-Pacific Trade Finance, by Country, 2025 | |
  24. TABLE 10 Middle East and Africa Trade Finance, by Country, 2025 | |
  25. TABLE 11 Global Trade Finance, by Product Type, 2021–2035 (USD Billion) | |
  26. TABLE 12 Global Trade Finance, by Service Provider, 2021–2035 (USD Billion) | |
  27. TABLE 13 Global Trade Finance, by Application, 2021–2035 (USD Billion) | |
  28. TABLE 14 Global Trade Finance, by Company Size, 2021–2035 (USD Billion) | |
  29. TABLE 15 Global Trade Finance, by Financing Structure, 2021–2035 (USD Billion) | |
  30. TABLE 16 Competitive Benchmarking Matrix, 2025 | |
  31. TABLE 17 Report Scope and Methodology | |
  32. TABLE 18 Detailed Sources and Citations | |
  33. TABLE 19 Segmentation Quick Reference | | LIST OF FIGURES | |
  34. FIGURE 1 Market Dynamics Overview — Drivers, Restraints, Opportunities | |
  35. FIGURE 2 Industry Value Chain Analysis | |
  36. FIGURE 3 Porter's Five Forces Analysis | |
  37. FIGURE 4 Global Trade Finance Size Trend, 2021–2035 (USD Billion) | |
  38. FIGURE 5 Share by Product Type, 2025 (%) | |
  39. FIGURE 6 Share by Service Provider, 2025 (%) | |
  40. FIGURE 7 Share by Application, 2025 (%) | |
  41. FIGURE 8 Share by Company Size, 2025 (%) | |
  42. FIGURE 9 Share by Financing Structure, 2025 (%) | |
  43. FIGURE 10 Regional Share, 2025 (%) | |
  44. FIGURE 11 Regional CAGR Comparison, 2026–2035 (%) | |
  45. FIGURE 12 Competitive Landscape — Estimated Revenue Share Ranges, 2025

Segmentation Quick Reference

DimensionSub-SegmentsDominant SegmentFastest Growing Segment
By Product TypeDocumentary; Non-DocumentaryDocumentary (61.5% share)Non-Documentary (4.68% CAGR)
By Service ProviderBanks; Trade Finance Companies; Insurance Companies; Other Service ProvidersBanks (65.4% share)Trade Finance Companies (5.06% CAGR)
By ApplicationDomestic; InternationalInternational (65.3% share)Domestic (5.97% CAGR)
By Company SizeLarge Enterprises; Small and Medium-sized Enterprises (SMEs)Large Enterprises (59.5% share)Small and Medium-sized Enterprises (SMEs) (4.31% CAGR)
By Financing StructureStructured Trade Finance; Non-Structured Trade FinancingNon-Structured Trade Financing (57.6% share)Structured Trade Finance (4.12% CAGR)
By RegionNorth America; South America; Europe; Asia-Pacific; Middle East and AfricaEurope (33.6% share)Asia-Pacific (4.92% CAGR)

Market Segmentation Overview

By Product Type

Sub-SegmentKey Trend
DocumentaryDigitised documentary credits on electronic title documents
Non-DocumentaryOpen-account terms backed by receivables finance and credit cover

Documentary leads with a 61.5% share because exporters selling into volatile or unfamiliar markets still need bank-backed payment assurance. Non-Documentary grows fastest at a 4.68% CAGR as established trading partners shift to open-account terms that settle faster and cost less. Electronic title documents will narrow the speed advantage, but not reverse the shift in mature corridors.

By Service Provider

Sub-SegmentKey Trend
BanksWhite-labelling fintech workflows on regulated balance sheets
Trade Finance CompaniesEmbedded API financing in ERP and procurement platforms
Insurance CompaniesCredit cover underpinning bank and fintech exposures
Other Service ProvidersExport credit agencies widening short-term supplier cover.

Banks hold a 65.4% share because high-value, multi-currency transactions require regulated balance sheet capacity. Trade Finance Companies grow fastest at a 5.06% CAGR by scoring suppliers on invoice and shipment data and onboarding them in hours. Insurance Companies and Other Service Providers sit beneath both, absorbing default risk that lets lenders extend capacity.

By Application

Sub-SegmentKey Trend
DomesticPayables programs extended to lower-tier local suppliers
InternationalHeavier sanctions and dual-use screening on cross-border flows

International holds a 65.3% share since cross-border deals need bank handling of documents, sanctions checks, and currency risk. Domestic grows fastest at a 5.97% CAGR as corporates push supplier programs deeper into local supply chains and regulated invoice platforms such as India's TReDS widen access. Lighter compliance requirements make domestic deals cheaper to process.

By Company Size

Sub-SegmentKey Trend
Large EnterprisesSponsoring reverse factoring for their supplier bases
Small and Medium-sized Enterprises (SMEs)Invoice-level credit scoring and multilateral guarantees

Large Enterprises lead with a 59.5% share through multi-bank relationships and strong collateral. Small and Medium-sized Enterprises (SMEs) grow fastest at a 4.31% CAGR as development-bank guarantees and digital scoring reduce high rejection rates. Buyer-sponsored programs let smaller suppliers borrow on their customers' credit rather than their own.

By Financing Structure

Sub-SegmentKey Trend
Structured Trade FinancePrepayment and borrowing-base facilities for battery metals and LNG
Non-Structured Trade FinancingAutomated short-tenor transactional products

Non-Structured Trade Financing holds a 57.6% share because routine short-tenor transactions dominate manufacturing and retail trade. Structured Trade Finance grows fastest at a 4.12% CAGR as producers of copper, lithium, and LNG borrow against future output under offtake contracts. Commodity price volatility makes collateral-based structures more attractive to lenders than unsecured lines.


Download PDF ×

We do not share your information with anyone. However, we may send you emails based on your report interest from time to time. You may contact us at any time to opt-out.