• Cat-intel
  • MedIntelliX
  • Resources
  • About Us
  • English
    Chinese
    French
    Japanese
    Korean
    German
    Spanish

    Sweeteners Market Share

    ID: MRFR/F-B & N/3565-HCR
    128 Pages
    Varsha More
    October 2025

    Sweeteners Market Research Report By Type (Natural Sweeteners, Artificial Sweeteners, Sugar Alcohols, Stevia, Agave Syrup), By Application (Beverages, Bakery, Confectionery, Dairy Products, Sauces and Dressings), By Formulation (Liquid, Powder, Granular, Tabletop, Bulk), By End Use (Food Industry, Beverage Industry, Pharmaceuticals, Personal Care, Household Products) and By Regional (North Amer...

    Share:
    Download PDF ×

    We do not share your information with anyone. However, we may send you emails based on your report interest from time to time. You may contact us at any time to opt-out.

    Sweeteners Market Infographic
    $ 4,950.0
    $ 5,950.0
    $ 7,250.0

    Market Share

    Sweeteners Market Share Analysis

    In the highly competitive sweeteners market, effective market share positioning strategies are essential for brands seeking to differentiate themselves and capture a significant portion of the consumer base. Product differentiation is a key strategy. Brands that offer sweeteners with unique taste and natural alternatives like stevia or innovative blends, can stand out in the market. It also means that a brand can reach out to various kinds of consumers, who all have different tastes in food and sometimes come with special dietary requirements or eating preferences. This allows the brand not only to widen its consumer base but also places it into a market niche which is hard for other competitors to fill. Building a strong and distinctive brand image is essential to the trust of consumers. Those brands that use clear, accessible marketing data to inform consumers about their sweeteners 'origins and the processes of their formation. Of its benefits are likelier in fact find success on the marketplace than those which hide everything behind a curtain Value creating. In this period of increasing competition, storytelling and a clear brand narrative have become methods to connect with consumers on an emotional level. At the same time, they differentiate you from competitors more effectively than certified specialties would otherwise be able by themselves. This is definitely contributing in part to growth of market share for many brands--or at least that's what he hoped as we chatted This growth in market share comes from co-sponsorship with high-class retailers offline as well as online. It's like expanding the number of points at which people can get their hands on a brand or product, and it also includes convenience and sweeteners in the sweetators. The strategy of personalization is becoming more prominent. Sweetener blends tailored to habits and requirements. In this regard, brands offering personalized solutions especially resonate with consumers requesting individual experiences. Customization enhances the consumer's connection with the product and fosters brand loyalty, contributing to a larger market share. Pricing strategies are critical in market share positioning within the sweeteners industry. Brands can adopt various pricing approaches, from positioning themselves as premium options with high-quality natural sweeteners to offering more affordable alternatives that appeal to price-sensitive consumers.

    Market Summary

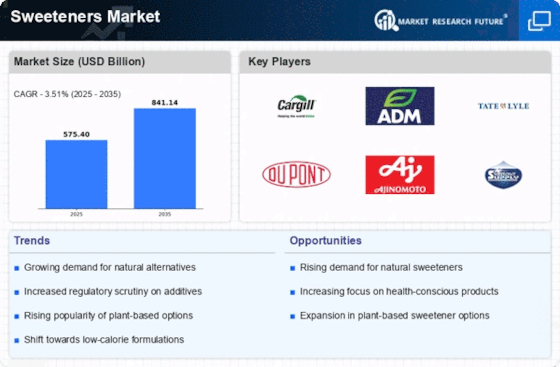
    As per Market Research Future Analysis, the Global Sweeteners Market is poised for significant growth, driven by rising health consciousness and demand for natural alternatives. The market size was estimated at 575.40 USD Billion in 2024 and is projected to reach 841.14 USD Billion by 2035, reflecting a CAGR of 3.51% from 2025 to 2035. Key trends include a shift towards low-calorie sweeteners and regulatory support for reduced sugar consumption, which are reshaping product offerings across the food and beverage sectors.

    Key Market Trends & Highlights

    The Global Sweeteners Market is evolving with notable trends and consumer preferences.

    • Natural Sweeteners are expected to grow from 24.0 USD Billion in 2024 to 30.0 USD Billion by 2035.
    • Artificial Sweeteners are projected to increase from 30.0 USD Billion in 2024 to 39.0 USD Billion by 2035.
    • The demand for natural sweeteners is anticipated to grow by approximately 10% annually.
    • North America is expected to lead the market with a valuation of 30.0 USD Billion in 2024, growing to 37.0 USD Billion by 2035.

    Market Size & Forecast

    2024 Market Size USD 575.40 Billion
    2035 Market Size USD 841.14 Billion
    CAGR (2025-2035) 3.51%
    Largest Regional Market Share in 2024 North America.

    Major Players

    Key players include Sweetener Solutions, DuPont, Kerry Group, Naturex, Nutraceutical Corporation, Archer Daniels Midland, Hawkins Watts, Cargill, Ingredion, MGP Ingredients, Roquette Freres, Ninth Wave, Tate and Lyle, and The NutraSweet Company.

    Market Trends

    The Sweeteners Market is undergoing substantial changes as a result of evolving consumer preferences and health consciousness. Due to health concerns such as obesity and diabetes, there is an increasing emphasis on reducing sugar intake. Consequently, a significant number of consumers are actively pursuing healthier alternatives. This change is increasing the demand for natural sweeteners, such as stevia and monk fruit, which are perceived as healthier alternatives to artificial sweeteners and traditional sugar. Furthermore, the expansion of these natural sweeteners is supported by the increasing popularity of plant-based diets, which are in accordance with the preferences of health-conscious consumers.

    Opportunities within the market are also changing, particularly as manufacturers develop innovative product formulations that incorporate various types of sweeteners to reduce calorie counts while preserving flavor. This trend offers companies the opportunity to meet the diverse requirements of various consumer segments, including those who prefer more natural ingredients and those who are interested in low-calorie options. In this dynamic market, brands that concentrate on these innovations may establish a competitive advantage. Recently, there has been a global increase in the availability and acceptability of sweeteners in both the food and beverage sectors, suggesting a significant change in culinary practices.

    Regulatory support is being observed in a variety of regions, as certain governments advocate for low-calorie sweeteners to combat the consumption of sweetened beverages. This regulatory assistance has the potential to stimulate market growth and promote the development of products that are consistent with healthy living.Additionally, e-commerce platforms have established new distribution channels for sweetener products, thereby facilitating greater number of consumers to access them. Overall, the Sweeteners Market is undergoing a rapid adaptation to evolving health priorities and behaviors, resulting in a dynamic and evolving landscape.

    The global sweeteners market appears to be evolving towards a greater demand for natural alternatives, as consumers increasingly seek healthier options that align with their dietary preferences.

    U.S. Department of Agriculture

    Sweeteners Market Market Drivers

    Rising Health Consciousness

    The Global Sweeteners Market Industry experiences a notable shift as consumers increasingly prioritize health and wellness. This trend is evidenced by the growing demand for low-calorie and natural sweeteners, which are perceived as healthier alternatives to traditional sugars. As individuals become more aware of the adverse effects of excessive sugar consumption, the market for sweeteners is projected to reach 90.6 USD Billion in 2024. This shift towards healthier options suggests that manufacturers are likely to innovate and expand their product lines to cater to this evolving consumer preference.

    Market Segment Insights

    Sweeteners Market Segment Insights

    Sweeteners Market Segment Insights

    Sweeteners Market Type Insights  

    Sweeteners Market Type Insights  

    The Sweeteners Market exhibits a diverse array of types, each contributing significantly to the market landscape. As of 2024, Natural Sweeteners are valued at 25.0 USD billion and are expected to reach 32.5 USD billion by 2035, reflecting a growing consumer preference for healthier alternatives to traditional sugars. This segment demonstrates major importance as it aligns with the increasing trend towards clean labeling and natural ingredient sourcing, appealing to health-conscious consumers globally.

    The Artificial Sweeteners segment holds a substantial market value of 30.0 USD billion in 2024, with projections estimating a growth to 40.0 USD billion by 2035.This category significantly dominates the market due to its widespread use in the food and beverage industry as a sugar substitute, driven by the rising demand for low-calorie products. Furthermore, the Sugar Alcohols segment, valued at 15.0 USD Billion in 2024 and anticipated to reach 20.0 USD Billion by 2035, caters to consumers looking for low-calorie sweeteners with digestive benefits, making it a notable player in the market.

    Stevia, valued at 12.0 USD billion in 2024 and expected to grow to 16.0 USD billion by 2035, is emerging as a significant option due to its natural origin and zero-calorie profile, making it increasingly popular in various applications from beverages to baked goods.Lastly, the Agave Syrup segment, valued at 8.6 USD Billion in 2024 with growth projections to 11.5 USD billion by 2035, is often used for its unique taste and lower glycemic index, appealing to both manufacturers and health-conscious consumers.

    Overall, the Sweeteners Market segmentation reflects the evolving preferences towards healthier, low-calorie, and natural sweetening options, highlighting the importance of each type in addressing consumer trends while contributing to the market's revenue streams and growth dynamics.

    Sweeteners Market Application Insights  

    Sweeteners Market Application Insights  

    The Sweeteners Market, valued at 90.6 USD Billion in 2024, reflects a diverse range of applications that significantly drive overall market growth. The Application segment includes important categories such as Beverages, Bakery, Confectionery, Dairy Products, and Sauces and Dressings, each contributing to the increasing demand for sweeteners across various industries. Beverages, notably non-alcoholic drinks, leverage sweeteners to enhance flavor without adding calories, representing a crucial area of consumption.

    Bakery products utilize sweeteners not only for taste but also for texture and preservation, highlighting their indispensable role in this sector.Additionally, Confectionery items rely heavily on sweeteners to achieve the desired sweetness and product stability, making this application significant in satisfying consumer preferences. Dairy Products benefit from sweeteners that enhance flavor while fulfilling nutritional requirements, while Sauces and Dressings use them to balance flavors and improve taste. The overall market statistics show a steady demand and a growth pattern influenced by health-conscious trends and increasing consumer preference for low-calorie food and beverages.

    These dynamics emphasize the vital nature of the Application segment within the Sweeteners Market industry.

    Sweeteners Market Formulation Insights  

    Sweeteners Market Formulation Insights  

    The Sweeteners Market, exhibiting strong growth dynamics, is projected to be valued at approximately 90.6 billion USD by 2024. The Formulation segment plays a vital role in this market landscape, characterized by its various forms such as Liquid, Powder, Granular, Tabletop, and Bulk. Liquid sweeteners are experiencing heightened demand due to their convenience and versatility in a wide range of food and beverage applications. Meanwhile, Powder sweeteners are favored for their shelf stability and ease of use, particularly in baking and cooking.Granular forms are significant for bulk purchases, appealing to both households and commercial entities seeking cost-effective solutions.

    Tabletop sweeteners remain popular among health-conscious consumers as ideal sugar substitutes for personal sweetening preferences. The Bulk segment is increasingly important in industrial applications, allowing manufacturers to integrate sweeteners into their products efficiently. Overall, these variations in formulation not only influence consumer choices but also significantly drive the revenue potential in the Sweeteners Market, tapping into the growing trend of sugar reduction, health consciousness, and the demand for natural sweetening alternatives.

    Sweeteners Market End Use Insights  

    Sweeteners Market End Use Insights  

    The Sweeteners Market, valued at 90.6 USD Billion in 2024, plays a crucial role across various end-use sectors, demonstrating significant growth potential. The Food Industry represents a vital segment, driven by the increasing consumer demand for low-calorie and sugar-free products, thus fostering a market environment focused on health and wellness. The Beverage Industry similarly benefits from this trend, with many manufacturers reformulating their products to enhance flavor without adding calories.

    Pharmaceuticals have notably embraced sweeteners for their role in covering unpleasant tastes in medications, directly impacting patient compliance.Additionally, the Personal Care sector utilizes sweeteners in various cosmetic formulations for their moisturizing properties. Meanwhile, Household Products leverages sweeteners for their effectiveness in cleaning solutions and deodorants. Overall, the diverse applications across these industries underscore the versatility and importance of sweeteners, contributing to the growing Sweeteners Market revenue and reflecting the shifting consumption patterns toward healthier options. The projected growth within these segments emphasizes the market's resilience and adaptive nature in response to evolving consumer preferences.

    Get more detailed insights about Sweeteners Market Research Report - Forecast till 2035

    Regional Insights

    The Sweeteners Market is valued at 90.6 USD Billion in 2024, with regional segments significantly contributing to its overall landscape. North America dominates this market with a valuation of 30.0 USD billion, projected to grow to 39.0 USD billion by 2035, reflecting the region's robust consumption patterns and inclination towards low-calorie sweeteners. Europe follows closely, valued at 25.0 USD Billion in 2024, growing to 32.0 USD billion, owing to increasing health awareness and government regulations against sugar usage.

    Asia Pacific is also a major player, with a market value of 21.0 USD Billion that is expected to reach 30.0 USD billion, driven by rising population and urbanization trends.South America, while smaller at 8.0 USD billion in 2024, is expected to increase to 10.5 USD billion, showing potential growth in demand for natural sweeteners. The Middle East and Africa, with current values of 6.6 USD Billion, will grow to 8.5 USD Billion, as these regions' market growth is fueled by changing dietary preferences.

    The overall Sweeteners Market revenue reflects a growing acceptance of sweeteners in various applications, positioning these regional markets as vital components for future growth and innovation in the sweeteners industry.

    Sweeteners Market Regional Insights

    Source: Primary Research, Secondary Research, Market Research Future Database, and Analyst Review

    Key Players and Competitive Insights

    The Sweeteners Market is characterized by a dynamic landscape influenced by various factors, including consumer preferences, regulatory changes, and technological advancements. As health consciousness rises among consumers, there is an increased demand for natural and low-calorie sweeteners, which has led to a surge in product innovations and market entrants. The competition in this market is not solely reliant on product offerings; it also encompasses pricing strategies, distribution channels, and marketing tactics.

    Companies are vying for a place in a rapidly evolving market, ensuring their portfolios align with current trends such as sugar reduction and clean labels, which are driving the sweeteners segment. Stakeholders are increasingly seeking strategic partnerships and acquisitions to enhance their capabilities, expand product lines, and penetrate emerging markets to cater to a diverse customer base seeking healthier alternatives.Wilmar International has established a strong foothold in the Sweeteners Market by leveraging its extensive experience and innovative approaches to sweetener production and distribution.

    Known for its integrated agribusiness model, the company benefits from a vast network of resources that enables it to source raw materials efficiently and maintain high-quality standards throughout its processes. Wilmar's commitment to sustainability and responsible sourcing reflects positively in its market presence, helping it build trust with consumers and business partners alike.

    Moreover, the company's strategic investments in research and development have led to the launch of a variety of natural and specialty sweeteners that cater to diverse applications across different industries, enhancing their competitive edge within the global market.Cargill has carved a significant niche in the Sweeteners Market, offering a diverse array of products and services aimed at addressing consumer demands for healthier options. The company's portfolio includes popular sweeteners derived from corn and cane sugar, alongside innovative alternatives like stevia and monk fruit extract that cater to the needs of health-conscious consumers.

    Cargill’s ability to adapt to changing market trends and its focus on sustainability contribute to its robust market presence. The company actively invests in research and development, enabling it to stay ahead in product innovation and meet evolving consumer expectations. Additionally, through strategic mergers and acquisitions, Cargill has expanded its capabilities and scale, enhancing its distribution network and enabling it to better serve global markets. This collaborative approach integrates well with Cargill's mission to provide solutions that support customer growth while promoting sustainable practices, further solidifying its position in the competitive sweeteners landscape.

    Key Companies in the Sweeteners Market market include

    Industry Developments

    Recent developments in the Sweeteners Market indicate a growing trend towards natural sweeteners, especially with companies like Cargill and PureCircle focusing on plant-based alternatives such as stevia and monk fruit.

    Cargill's joint venture with DSM-Firmenich, Avansya, received positive safety opinions from both the EFSA and UK FSA in January 2024 for its EverSweet® stevia sweetener. This achievement is indicative of the company's ongoing commitment to natural, low-calorie sweeteners. Wilmar International reported exceptional results in its Food Products segment in June 2025. This included a stronger sales volume in healthy sweetener categories, as well as sugar, which was driven by consumer demand for healthier ingredients.

    Archer Daniels Midland (ADM) announced in December 2023 that it had entered into agreements to acquire both Revela Foods (a US dairy flavor producer) and FDL (a UK-based flavor and functional ingredients company). This acquisition will significantly broaden ADM's flavors and sweetener ingredient portfolio.

     Over the past two years, major shifts have occurred, including Tate & Lyle's strategic partnership aimed at developing more sustainable sweeteners, which reinforces the industry's commitment to sustainability. Also, ongoing regulatory changes globally are impacting how sweeteners are produced, consumed, and marketed. Companies such as Mitsubishi Corporation and NutraSweet are being closely monitored for their market strategies amid increasing scrutiny on health and nutrition standards.

    Future Outlook

    Sweeteners Market Future Outlook

    The Global Sweeteners Market is projected to grow at a 3.51% CAGR from 2025 to 2035, driven by health trends, regulatory changes, and innovation in product formulations.

    New opportunities lie in:

    • Develop low-calorie sweeteners targeting health-conscious consumers.
    • Invest in natural sweeteners to meet rising demand for clean-label products.
    • Leverage technology for enhanced production efficiency and cost reduction.

    By 2035, the Global Sweeteners Market is expected to exhibit robust growth, reflecting evolving consumer preferences and innovative product offerings.

    Market Segmentation

    Sweeteners Market Type Outlook

    • Natural Sweeteners
    • Artificial Sweeteners
    • Sugar Alcohols
    • Stevia
    • Agave Syrup

    Sweeteners Market End Use Outlook

    • Food Industry
    • Beverage Industry
    • Pharmaceuticals
    • Personal Care
    • Household Products

    Sweeteners Market Regional Outlook

    • North America
    • Europe
    • South America
    • Asia Pacific
    • Middle East and Africa

    Sweeteners Market Application Outlook

    • Beverages
    • Bakery
    • Confectionery
    • Dairy Products
    • Sauces and Dressings

    Sweeteners Market Formulation Outlook

    • Liquid
    • Powder
    • Granular
    • Tabletop
    • Bulk

    Report Scope

    Report Attribute/Metric Details
    Market Size 2018 88.5(USD Billion)
    Market Size 2024 90.6(USD Billion)
    Market Size 2035 841.14 (USD Billion)
    Compound Annual Growth Rate (CAGR) 3.51% (2025 - 2035)
    Report Coverage Revenue Forecast, Competitive Landscape, Growth Factors, and Trends
    Base Year 2024
    Market Forecast Period 2025 - 2035
    Historical Data 2019 - 2024
    Market Forecast Units USD Billion
    Key Companies Profiled Wilmar International, Cargill, Stevia First, Zhejiang Guanshengyuan, Ingredion, Tate & Lyle, Archer Daniels Midland, NutraSweet, Ajinomoto, Mitsubishi Corporation, PureCircle
    Segments Covered Type, Application, Formulation, End Use, Regional
    Key Market Opportunities Natural sweeteners demand growth, Low-calorie sweeteners adoption, rising health consciousness trends, Expansion in emerging markets, and Sugar alternatives in beverages.
    Key Market Dynamics health consciousness, regulatory changes, consumer preferences, technological advancements, competitive pricing
    Countries Covered North America, Europe, APAC, South America, MEA
    Market Size 2025 595.61 (USD Billion)

    Market Highlights

    Author

    Varsha More
    Research Analyst

    She holds an experience of about 6+ years in market research and business consulting, working under the spectrum of information communication technology, telecommunications and semiconductor domains. aarti conceptualizes and implements a scalable business strategy and provides strategic leadership to the clients. her expertise lies in market estimation, competitive intelligence, pipeline analysis, customer assessment, etc.

    Leave a Comment

    Latest Comments

    John Doe
    john@example.com

    This is a great article! Really helped me understand the topic better.

    Posted on July 23, 2025, 10:15 AM
    Jane Smith
    jane@domain.com

    Thanks for sharing this. I’ve bookmarked it for later reference.

    Posted on July 22, 2025, 7:45 PM

    FAQs

    What is the expected market size of the Sweeteners Market in 2024?

    The Sweeteners Market is expected to be valued at 90.6 billion USD in 2024.

    What will be the estimated market value of the Sweeteners Market by 2035?

    By 2035, the Sweeteners Market is projected to reach a value of 120.0 billion USD.

    What is the forecasted CAGR for the Sweeteners Market from 2025 to 2035?

    The expected CAGR for the Sweeteners Market during the period from 2025 to 2035 is 2.61%.

    Which region is expected to dominate the Sweeteners Market in 2024?

    North America is anticipated to dominate the Sweeteners Market with a value of 30.0 billion USD in 2024.

    How much is the Europe region projected to be worth in the Sweeteners Market by 2035?

    Europe is expected to be valued at 32.0 billion USD within the Sweeteners Market by 2035.

    What is the market value of artificial sweeteners in 2024?

    Artificial sweeteners are valued at 30.0 billion USD in the Sweeteners Market for the year 2024.

    Who are some of the major players in the Sweeteners Market?

    Key players in the Sweeteners Market include Cargill, Wilmar International, and Archer Daniels Midland, among others.

    What is the projected market value for sugar alcohols in 2035?

    The market value of sugar alcohols is projected to reach 20.0 billion USD by 2035.

    How much is the Asia Pacific region anticipated to grow in the Sweeteners Market by 2035?

    The Asia Pacific region is expected to grow to a value of 30.0 billion USD in the Sweeteners Market by 2035.

    What will be the market size for natural sweeteners in 2035?

    Natural sweeteners are projected to be valued at 32.5 billion USD in the Sweeteners Market by 2035.

    1. Table of Contents
    2. Executive Summary
      1. Market Overview
      2. Key Findings
      3. Market Segmentation
      4. Competitive Landscape
      5. Challenges and Opportunities
      6. Future Outlook
    3. Market Introduction
      1. Definition
      2. Scope of the Study
        1. Research Objective
        2. Assumption
        3. Limitations
    4. Research Methodology
      1. Overview
      2. Data Mining
      3. Secondary Research
      4. Primary Research
        1. Primary Interviews and Information Gathering Process
        2. Breakdown of Primary Respondents
      5. Forecasting Model
      6. Market Size Estimation
        1. Bottom-up Approach
        2. Top-Down Approach
      7. Data Triangulation
      8. Validation
    5. MARKET DYNAMICS
      1. Overview
      2. Drivers
      3. Restraints
      4. Opportunities
    6. MARKET FACTOR ANALYSIS
      1. Value chain Analysis
      2. Porter's Five Forces Analysis
        1. Bargaining Power of Suppliers
        2. Bargaining Power of Buyers
        3. Threat of New Entrants
        4. Threat of Substitutes
        5. Intensity of Rivalry
      3. COVID-19 Impact Analysis
        1. Market Impact Analysis
        2. Regional Impact
        3. Opportunity and Threat Analysis
    7. SWEETENERS MARKET, BY TYPE (USD BILLION)
      1. Natural Sweeteners
      2. Artificial Sweeteners
      3. Sugar Alcohols
      4. Stevia
      5. Agave Syrup
    8. SWEETENERS MARKET, BY APPLICATION (USD BILLION)
      1. Beverages
      2. Bakery
      3. Confectionery
      4. Dairy Products
      5. Sauces and Dressings
    9. SWEETENERS MARKET, BY FORMULATION (USD BILLION)
      1. Liquid
      2. Powder
      3. Granular
      4. Tabletop
      5. Bulk
    10. SWEETENERS MARKET, BY END USE (USD BILLION)
      1. Food Industry
      2. Beverage Industry
      3. Pharmaceuticals
      4. Personal Care
      5. Household Products
    11. SWEETENERS MARKET, BY REGIONAL (USD BILLION)
      1. North America
        1. US
        2. Canada
      2. Europe
        1. Germany
        2. UK
        3. France
        4. Russia
        5. Italy
        6. Spain
        7. Rest of Europe
      3. APAC
        1. China
        2. India
        3. Japan
        4. South Korea
        5. Malaysia
        6. Thailand
        7. Indonesia
        8. Rest of APAC
      4. South America
        1. Brazil
        2. Mexico
        3. Argentina
        4. Rest of South America
      5. MEA
        1. GCC Countries
        2. South Africa
        3. Rest of MEA
    12. Competitive Landscape
      1. Overview
      2. Competitive Analysis
      3. Market share Analysis
      4. Major Growth Strategy in the Sweeteners Market
      5. Competitive Benchmarking
      6. Leading Players in Terms of Number of Developments in the Sweeteners Market
      7. Key developments and growth strategies
        1. New Product Launch/Service Deployment
        2. Merger & Acquisitions
        3. Joint Ventures
      8. Major Players Financial Matrix
        1. Sales and Operating Income
        2. Major Players R&D Expenditure. 2023
    13. COMPANY PROFILES
      1. Wilmar International
        1. Financial Overview
        2. Products Offered
        3. Key Developments
        4. SWOT Analysis
        5. Key Strategies
      2. Cargill
        1. Financial Overview
        2. Products Offered
        3. Key Developments
        4. SWOT Analysis
        5. Key Strategies
      3. Stevia First
        1. Financial Overview
        2. Products Offered
        3. Key Developments
        4. SWOT Analysis
        5. Key Strategies
      4. Zhejiang Guanshengyuan
        1. Financial Overview
        2. Products Offered
        3. Key Developments
        4. SWOT Analysis
        5. Key Strategies
      5. Ingredion
        1. Financial Overview
        2. Products Offered
        3. Key Developments
        4. SWOT Analysis
        5. Key Strategies
      6. Tate & Lyle
        1. Financial Overview
        2. Products Offered
        3. Key Developments
        4. SWOT Analysis
        5. Key Strategies
      7. Archer Daniels Midland
        1. Financial Overview
        2. Products Offered
        3. Key Developments
        4. SWOT Analysis
        5. Key Strategies
      8. Glucose and Fructose
        1. Financial Overview
        2. Products Offered
        3. Key Developments
        4. SWOT Analysis
        5. Key Strategies
      9. LCM Foods
        1. Financial Overview
        2. Products Offered
        3. Key Developments
        4. SWOT Analysis
        5. Key Strategies
      10. NutraSweet
        1. Financial Overview
        2. Products Offered
        3. Key Developments
        4. SWOT Analysis
        5. Key Strategies
      11. Ajinomoto
        1. Financial Overview
        2. Products Offered
        3. Key Developments
        4. SWOT Analysis
        5. Key Strategies
      12. Mitsubishi Corporation
        1. Financial Overview
        2. Products Offered
        3. Key Developments
        4. SWOT Analysis
        5. Key Strategies
      13. PureCircle
        1. Financial Overview
        2. Products Offered
        3. Key Developments
        4. SWOT Analysis
        5. Key Strategies
    14. APPENDIX
      1. References
      2. Related Reports
    15. List of Tables and Figures
      1. LIST OF TABLES
      2. TABLE 1. LIST OF ASSUMPTIONS
      3. TABLE 2. NORTH AMERICA SWEETENERS MARKET SIZE ESTIMATES & FORECAST, BY TYPE, 2019-2035 (USD BILLIONS)
      4. TABLE 3. NORTH AMERICA SWEETENERS MARKET SIZE ESTIMATES & FORECAST, BY APPLICATION, 2019-2035 (USD BILLIONS)
      5. TABLE 4. NORTH AMERICA SWEETENERS MARKET SIZE ESTIMATES & FORECAST, BY FORMULATION, 2019-2035 (USD BILLIONS)
      6. TABLE 5. NORTH AMERICA SWEETENERS MARKET SIZE ESTIMATES & FORECAST, BY END USE, 2019-2035 (USD BILLIONS)
      7. TABLE 6. NORTH AMERICA SWEETENERS MARKET SIZE ESTIMATES & FORECAST, BY REGIONAL, 2019-2035 (USD BILLIONS)
      8. TABLE 7. US SWEETENERS MARKET SIZE ESTIMATES & FORECAST, BY TYPE, 2019-2035 (USD BILLIONS)
      9. TABLE 8. US SWEETENERS MARKET SIZE ESTIMATES & FORECAST, BY APPLICATION, 2019-2035 (USD BILLIONS)
      10. TABLE 9. US SWEETENERS MARKET SIZE ESTIMATES & FORECAST, BY FORMULATION, 2019-2035 (USD BILLIONS)
      11. TABLE 10. US SWEETENERS MARKET SIZE ESTIMATES & FORECAST, BY END USE, 2019-2035 (USD BILLIONS)
      12. TABLE 11. US SWEETENERS MARKET SIZE ESTIMATES & FORECAST, BY REGIONAL, 2019-2035 (USD BILLIONS)
      13. TABLE 12. CANADA SWEETENERS MARKET SIZE ESTIMATES & FORECAST, BY TYPE, 2019-2035 (USD BILLIONS)
      14. TABLE 13. CANADA SWEETENERS MARKET SIZE ESTIMATES & FORECAST, BY APPLICATION, 2019-2035 (USD BILLIONS)
      15. TABLE 14. CANADA SWEETENERS MARKET SIZE ESTIMATES & FORECAST, BY FORMULATION, 2019-2035 (USD BILLIONS)
      16. TABLE 15. CANADA SWEETENERS MARKET SIZE ESTIMATES & FORECAST, BY END USE, 2019-2035 (USD BILLIONS)
      17. TABLE 16. CANADA SWEETENERS MARKET SIZE ESTIMATES & FORECAST, BY REGIONAL, 2019-2035 (USD BILLIONS)
      18. TABLE 17. EUROPE SWEETENERS MARKET SIZE ESTIMATES & FORECAST, BY TYPE, 2019-2035 (USD BILLIONS)
      19. TABLE 18. EUROPE SWEETENERS MARKET SIZE ESTIMATES & FORECAST, BY APPLICATION, 2019-2035 (USD BILLIONS)
      20. TABLE 19. EUROPE SWEETENERS MARKET SIZE ESTIMATES & FORECAST, BY FORMULATION, 2019-2035 (USD BILLIONS)
      21. TABLE 20. EUROPE SWEETENERS MARKET SIZE ESTIMATES & FORECAST, BY END USE, 2019-2035 (USD BILLIONS)
      22. TABLE 21. EUROPE SWEETENERS MARKET SIZE ESTIMATES & FORECAST, BY REGIONAL, 2019-2035 (USD BILLIONS)
      23. TABLE 22. GERMANY SWEETENERS MARKET SIZE ESTIMATES & FORECAST, BY TYPE, 2019-2035 (USD BILLIONS)
      24. TABLE 23. GERMANY SWEETENERS MARKET SIZE ESTIMATES & FORECAST, BY APPLICATION, 2019-2035 (USD BILLIONS)
      25. TABLE 24. GERMANY SWEETENERS MARKET SIZE ESTIMATES & FORECAST, BY FORMULATION, 2019-2035 (USD BILLIONS)
      26. TABLE 25. GERMANY SWEETENERS MARKET SIZE ESTIMATES & FORECAST, BY END USE, 2019-2035 (USD BILLIONS)
      27. TABLE 26. GERMANY SWEETENERS MARKET SIZE ESTIMATES & FORECAST, BY REGIONAL, 2019-2035 (USD BILLIONS)
      28. TABLE 27. UK SWEETENERS MARKET SIZE ESTIMATES & FORECAST, BY TYPE, 2019-2035 (USD BILLIONS)
      29. TABLE 28. UK SWEETENERS MARKET SIZE ESTIMATES & FORECAST, BY APPLICATION, 2019-2035 (USD BILLIONS)
      30. TABLE 29. UK SWEETENERS MARKET SIZE ESTIMATES & FORECAST, BY FORMULATION, 2019-2035 (USD BILLIONS)
      31. TABLE 30. UK SWEETENERS MARKET SIZE ESTIMATES & FORECAST, BY END USE, 2019-2035 (USD BILLIONS)
      32. TABLE 31. UK SWEETENERS MARKET SIZE ESTIMATES & FORECAST, BY REGIONAL, 2019-2035 (USD BILLIONS)
      33. TABLE 32. FRANCE SWEETENERS MARKET SIZE ESTIMATES & FORECAST, BY TYPE, 2019-2035 (USD BILLIONS)
      34. TABLE 33. FRANCE SWEETENERS MARKET SIZE ESTIMATES & FORECAST, BY APPLICATION, 2019-2035 (USD BILLIONS)
      35. TABLE 34. FRANCE SWEETENERS MARKET SIZE ESTIMATES & FORECAST, BY FORMULATION, 2019-2035 (USD BILLIONS)
      36. TABLE 35. FRANCE SWEETENERS MARKET SIZE ESTIMATES & FORECAST, BY END USE, 2019-2035 (USD BILLIONS)
      37. TABLE 36. FRANCE SWEETENERS MARKET SIZE ESTIMATES & FORECAST, BY REGIONAL, 2019-2035 (USD BILLIONS)
      38. TABLE 37. RUSSIA SWEETENERS MARKET SIZE ESTIMATES & FORECAST, BY TYPE, 2019-2035 (USD BILLIONS)
      39. TABLE 38. RUSSIA SWEETENERS MARKET SIZE ESTIMATES & FORECAST, BY APPLICATION, 2019-2035 (USD BILLIONS)
      40. TABLE 39. RUSSIA SWEETENERS MARKET SIZE ESTIMATES & FORECAST, BY FORMULATION, 2019-2035 (USD BILLIONS)
      41. TABLE 40. RUSSIA SWEETENERS MARKET SIZE ESTIMATES & FORECAST, BY END USE, 2019-2035 (USD BILLIONS)
      42. TABLE 41. RUSSIA SWEETENERS MARKET SIZE ESTIMATES & FORECAST, BY REGIONAL, 2019-2035 (USD BILLIONS)
      43. TABLE 42. ITALY SWEETENERS MARKET SIZE ESTIMATES & FORECAST, BY TYPE, 2019-2035 (USD BILLIONS)
      44. TABLE 43. ITALY SWEETENERS MARKET SIZE ESTIMATES & FORECAST, BY APPLICATION, 2019-2035 (USD BILLIONS)
      45. TABLE 44. ITALY SWEETENERS MARKET SIZE ESTIMATES & FORECAST, BY FORMULATION, 2019-2035 (USD BILLIONS)
      46. TABLE 45. ITALY SWEETENERS MARKET SIZE ESTIMATES & FORECAST, BY END USE, 2019-2035 (USD BILLIONS)
      47. TABLE 46. ITALY SWEETENERS MARKET SIZE ESTIMATES & FORECAST, BY REGIONAL, 2019-2035 (USD BILLIONS)
      48. TABLE 47. SPAIN SWEETENERS MARKET SIZE ESTIMATES & FORECAST, BY TYPE, 2019-2035 (USD BILLIONS)
      49. TABLE 48. SPAIN SWEETENERS MARKET SIZE ESTIMATES & FORECAST, BY APPLICATION, 2019-2035 (USD BILLIONS)
      50. TABLE 49. SPAIN SWEETENERS MARKET SIZE ESTIMATES & FORECAST, BY FORMULATION, 2019-2035 (USD BILLIONS)
      51. TABLE 50. SPAIN SWEETENERS MARKET SIZE ESTIMATES & FORECAST, BY END USE, 2019-2035 (USD BILLIONS)
      52. TABLE 51. SPAIN SWEETENERS MARKET SIZE ESTIMATES & FORECAST, BY REGIONAL, 2019-2035 (USD BILLIONS)
      53. TABLE 52. REST OF EUROPE SWEETENERS MARKET SIZE ESTIMATES & FORECAST, BY TYPE, 2019-2035 (USD BILLIONS)
      54. TABLE 53. REST OF EUROPE SWEETENERS MARKET SIZE ESTIMATES & FORECAST, BY APPLICATION, 2019-2035 (USD BILLIONS)
      55. TABLE 54. REST OF EUROPE SWEETENERS MARKET SIZE ESTIMATES & FORECAST, BY FORMULATION, 2019-2035 (USD BILLIONS)
      56. TABLE 55. REST OF EUROPE SWEETENERS MARKET SIZE ESTIMATES & FORECAST, BY END USE, 2019-2035 (USD BILLIONS)
      57. TABLE 56. REST OF EUROPE SWEETENERS MARKET SIZE ESTIMATES & FORECAST, BY REGIONAL, 2019-2035 (USD BILLIONS)
      58. TABLE 57. APAC SWEETENERS MARKET SIZE ESTIMATES & FORECAST, BY TYPE, 2019-2035 (USD BILLIONS)
      59. TABLE 58. APAC SWEETENERS MARKET SIZE ESTIMATES & FORECAST, BY APPLICATION, 2019-2035 (USD BILLIONS)
      60. TABLE 59. APAC SWEETENERS MARKET SIZE ESTIMATES & FORECAST, BY FORMULATION, 2019-2035 (USD BILLIONS)
      61. TABLE 60. APAC SWEETENERS MARKET SIZE ESTIMATES & FORECAST, BY END USE, 2019-2035 (USD BILLIONS)
      62. TABLE 61. APAC SWEETENERS MARKET SIZE ESTIMATES & FORECAST, BY REGIONAL, 2019-2035 (USD BILLIONS)
      63. TABLE 62. CHINA SWEETENERS MARKET SIZE ESTIMATES & FORECAST, BY TYPE, 2019-2035 (USD BILLIONS)
      64. TABLE 63. CHINA SWEETENERS MARKET SIZE ESTIMATES & FORECAST, BY APPLICATION, 2019-2035 (USD BILLIONS)
      65. TABLE 64. CHINA SWEETENERS MARKET SIZE ESTIMATES & FORECAST, BY FORMULATION, 2019-2035 (USD BILLIONS)
      66. TABLE 65. CHINA SWEETENERS MARKET SIZE ESTIMATES & FORECAST, BY END USE, 2019-2035 (USD BILLIONS)
      67. TABLE 66. CHINA SWEETENERS MARKET SIZE ESTIMATES & FORECAST, BY REGIONAL, 2019-2035 (USD BILLIONS)
      68. TABLE 67. INDIA SWEETENERS MARKET SIZE ESTIMATES & FORECAST, BY TYPE, 2019-2035 (USD BILLIONS)
      69. TABLE 68. INDIA SWEETENERS MARKET SIZE ESTIMATES & FORECAST, BY APPLICATION, 2019-2035 (USD BILLIONS)
      70. TABLE 69. INDIA SWEETENERS MARKET SIZE ESTIMATES & FORECAST, BY FORMULATION, 2019-2035 (USD BILLIONS)
      71. TABLE 70. INDIA SWEETENERS MARKET SIZE ESTIMATES & FORECAST, BY END USE, 2019-2035 (USD BILLIONS)
      72. TABLE 71. INDIA SWEETENERS MARKET SIZE ESTIMATES & FORECAST, BY REGIONAL, 2019-2035 (USD BILLIONS)
      73. TABLE 72. JAPAN SWEETENERS MARKET SIZE ESTIMATES & FORECAST, BY TYPE, 2019-2035 (USD BILLIONS)
      74. TABLE 73. JAPAN SWEETENERS MARKET SIZE ESTIMATES & FORECAST, BY APPLICATION, 2019-2035 (USD BILLIONS)
      75. TABLE 74. JAPAN SWEETENERS MARKET SIZE ESTIMATES & FORECAST, BY FORMULATION, 2019-2035 (USD BILLIONS)
      76. TABLE 75. JAPAN SWEETENERS MARKET SIZE ESTIMATES & FORECAST, BY END USE, 2019-2035 (USD BILLIONS)
      77. TABLE 76. JAPAN SWEETENERS MARKET SIZE ESTIMATES & FORECAST, BY REGIONAL, 2019-2035 (USD BILLIONS)
      78. TABLE 77. SOUTH KOREA SWEETENERS MARKET SIZE ESTIMATES & FORECAST, BY TYPE, 2019-2035 (USD BILLIONS)
      79. TABLE 78. SOUTH KOREA SWEETENERS MARKET SIZE ESTIMATES & FORECAST, BY APPLICATION, 2019-2035 (USD BILLIONS)
      80. TABLE 79. SOUTH KOREA SWEETENERS MARKET SIZE ESTIMATES & FORECAST, BY FORMULATION, 2019-2035 (USD BILLIONS)
      81. TABLE 80. SOUTH KOREA SWEETENERS MARKET SIZE ESTIMATES & FORECAST, BY END USE, 2019-2035 (USD BILLIONS)
      82. TABLE 81. SOUTH KOREA SWEETENERS MARKET SIZE ESTIMATES & FORECAST, BY REGIONAL, 2019-2035 (USD BILLIONS)
      83. TABLE 82. MALAYSIA SWEETENERS MARKET SIZE ESTIMATES & FORECAST, BY TYPE, 2019-2035 (USD BILLIONS)
      84. TABLE 83. MALAYSIA SWEETENERS MARKET SIZE ESTIMATES & FORECAST, BY APPLICATION, 2019-2035 (USD BILLIONS)
      85. TABLE 84. MALAYSIA SWEETENERS MARKET SIZE ESTIMATES & FORECAST, BY FORMULATION, 2019-2035 (USD BILLIONS)
      86. TABLE 85. MALAYSIA SWEETENERS MARKET SIZE ESTIMATES & FORECAST, BY END USE, 2019-2035 (USD BILLIONS)
      87. TABLE 86. MALAYSIA SWEETENERS MARKET SIZE ESTIMATES & FORECAST, BY REGIONAL, 2019-2035 (USD BILLIONS)
      88. TABLE 87. THAILAND SWEETENERS MARKET SIZE ESTIMATES & FORECAST, BY TYPE, 2019-2035 (USD BILLIONS)
      89. TABLE 88. THAILAND SWEETENERS MARKET SIZE ESTIMATES & FORECAST, BY APPLICATION, 2019-2035 (USD BILLIONS)
      90. TABLE 89. THAILAND SWEETENERS MARKET SIZE ESTIMATES & FORECAST, BY FORMULATION, 2019-2035 (USD BILLIONS)
      91. TABLE 90. THAILAND SWEETENERS MARKET SIZE ESTIMATES & FORECAST, BY END USE, 2019-2035 (USD BILLIONS)
      92. TABLE 91. THAILAND SWEETENERS MARKET SIZE ESTIMATES & FORECAST, BY REGIONAL, 2019-2035 (USD BILLIONS)
      93. TABLE 92. INDONESIA SWEETENERS MARKET SIZE ESTIMATES & FORECAST, BY TYPE, 2019-2035 (USD BILLIONS)
      94. TABLE 93. INDONESIA SWEETENERS MARKET SIZE ESTIMATES & FORECAST, BY APPLICATION, 2019-2035 (USD BILLIONS)
      95. TABLE 94. INDONESIA SWEETENERS MARKET SIZE ESTIMATES & FORECAST, BY FORMULATION, 2019-2035 (USD BILLIONS)
      96. TABLE 95. INDONESIA SWEETENERS MARKET SIZE ESTIMATES & FORECAST, BY END USE, 2019-2035 (USD BILLIONS)
      97. TABLE 96. INDONESIA SWEETENERS MARKET SIZE ESTIMATES & FORECAST, BY REGIONAL, 2019-2035 (USD BILLIONS)
      98. TABLE 97. REST OF APAC SWEETENERS MARKET SIZE ESTIMATES & FORECAST, BY TYPE, 2019-2035 (USD BILLIONS)
      99. TABLE 98. REST OF APAC SWEETENERS MARKET SIZE ESTIMATES & FORECAST, BY APPLICATION, 2019-2035 (USD BILLIONS)
      100. TABLE 99. REST OF APAC SWEETENERS MARKET SIZE ESTIMATES & FORECAST, BY FORMULATION, 2019-2035 (USD BILLIONS)
      101. TABLE 100. REST OF APAC SWEETENERS MARKET SIZE ESTIMATES & FORECAST, BY END USE, 2019-2035 (USD BILLIONS)
      102. TABLE 101. REST OF APAC SWEETENERS MARKET SIZE ESTIMATES & FORECAST, BY REGIONAL, 2019-2035 (USD BILLIONS)
      103. TABLE 102. SOUTH AMERICA SWEETENERS MARKET SIZE ESTIMATES & FORECAST, BY TYPE, 2019-2035 (USD BILLIONS)
      104. TABLE 103. SOUTH AMERICA SWEETENERS MARKET SIZE ESTIMATES & FORECAST, BY APPLICATION, 2019-2035 (USD BILLIONS)
      105. TABLE 104. SOUTH AMERICA SWEETENERS MARKET SIZE ESTIMATES & FORECAST, BY FORMULATION, 2019-2035 (USD BILLIONS)
      106. TABLE 105. SOUTH AMERICA SWEETENERS MARKET SIZE ESTIMATES & FORECAST, BY END USE, 2019-2035 (USD BILLIONS)
      107. TABLE 106. SOUTH AMERICA SWEETENERS MARKET SIZE ESTIMATES & FORECAST, BY REGIONAL, 2019-2035 (USD BILLIONS)
      108. TABLE 107. BRAZIL SWEETENERS MARKET SIZE ESTIMATES & FORECAST, BY TYPE, 2019-2035 (USD BILLIONS)
      109. TABLE 108. BRAZIL SWEETENERS MARKET SIZE ESTIMATES & FORECAST, BY APPLICATION, 2019-2035 (USD BILLIONS)
      110. TABLE 109. BRAZIL SWEETENERS MARKET SIZE ESTIMATES & FORECAST, BY FORMULATION, 2019-2035 (USD BILLIONS)
      111. TABLE 110. BRAZIL SWEETENERS MARKET SIZE ESTIMATES & FORECAST, BY END USE, 2019-2035 (USD BILLIONS)
      112. TABLE 111. BRAZIL SWEETENERS MARKET SIZE ESTIMATES & FORECAST, BY REGIONAL, 2019-2035 (USD BILLIONS)
      113. TABLE 112. MEXICO SWEETENERS MARKET SIZE ESTIMATES & FORECAST, BY TYPE, 2019-2035 (USD BILLIONS)
      114. TABLE 113. MEXICO SWEETENERS MARKET SIZE ESTIMATES & FORECAST, BY APPLICATION, 2019-2035 (USD BILLIONS)
      115. TABLE 114. MEXICO SWEETENERS MARKET SIZE ESTIMATES & FORECAST, BY FORMULATION, 2019-2035 (USD BILLIONS)
      116. TABLE 115. MEXICO SWEETENERS MARKET SIZE ESTIMATES & FORECAST, BY END USE, 2019-2035 (USD BILLIONS)
      117. TABLE 116. MEXICO SWEETENERS MARKET SIZE ESTIMATES & FORECAST, BY REGIONAL, 2019-2035 (USD BILLIONS)
      118. TABLE 117. ARGENTINA SWEETENERS MARKET SIZE ESTIMATES & FORECAST, BY TYPE, 2019-2035 (USD BILLIONS)
      119. TABLE 118. ARGENTINA SWEETENERS MARKET SIZE ESTIMATES & FORECAST, BY APPLICATION, 2019-2035 (USD BILLIONS)
      120. TABLE 119. ARGENTINA SWEETENERS MARKET SIZE ESTIMATES & FORECAST, BY FORMULATION, 2019-2035 (USD BILLIONS)
      121. TABLE 120. ARGENTINA SWEETENERS MARKET SIZE ESTIMATES & FORECAST, BY END USE, 2019-2035 (USD BILLIONS)
      122. TABLE 121. ARGENTINA SWEETENERS MARKET SIZE ESTIMATES & FORECAST, BY REGIONAL, 2019-2035 (USD BILLIONS)
      123. TABLE 122. REST OF SOUTH AMERICA SWEETENERS MARKET SIZE ESTIMATES & FORECAST, BY TYPE, 2019-2035 (USD BILLIONS)
      124. TABLE 123. REST OF SOUTH AMERICA SWEETENERS MARKET SIZE ESTIMATES & FORECAST, BY APPLICATION, 2019-2035 (USD BILLIONS)
      125. TABLE 124. REST OF SOUTH AMERICA SWEETENERS MARKET SIZE ESTIMATES & FORECAST, BY FORMULATION, 2019-2035 (USD BILLIONS)
      126. TABLE 125. REST OF SOUTH AMERICA SWEETENERS MARKET SIZE ESTIMATES & FORECAST, BY END USE, 2019-2035 (USD BILLIONS)
      127. TABLE 126. REST OF SOUTH AMERICA SWEETENERS MARKET SIZE ESTIMATES & FORECAST, BY REGIONAL, 2019-2035 (USD BILLIONS)
      128. TABLE 127. MEA SWEETENERS MARKET SIZE ESTIMATES & FORECAST, BY TYPE, 2019-2035 (USD BILLIONS)
      129. TABLE 128. MEA SWEETENERS MARKET SIZE ESTIMATES & FORECAST, BY APPLICATION, 2019-2035 (USD BILLIONS)
      130. TABLE 129. MEA SWEETENERS MARKET SIZE ESTIMATES & FORECAST, BY FORMULATION, 2019-2035 (USD BILLIONS)
      131. TABLE 130. MEA SWEETENERS MARKET SIZE ESTIMATES & FORECAST, BY END USE, 2019-2035 (USD BILLIONS)
      132. TABLE 131. MEA SWEETENERS MARKET SIZE ESTIMATES & FORECAST, BY REGIONAL, 2019-2035 (USD BILLIONS)
      133. TABLE 132. GCC COUNTRIES SWEETENERS MARKET SIZE ESTIMATES & FORECAST, BY TYPE, 2019-2035 (USD BILLIONS)
      134. TABLE 133. GCC COUNTRIES SWEETENERS MARKET SIZE ESTIMATES & FORECAST, BY APPLICATION, 2019-2035 (USD BILLIONS)
      135. TABLE 134. GCC COUNTRIES SWEETENERS MARKET SIZE ESTIMATES & FORECAST, BY FORMULATION, 2019-2035 (USD BILLIONS)
      136. TABLE 135. GCC COUNTRIES SWEETENERS MARKET SIZE ESTIMATES & FORECAST, BY END USE, 2019-2035 (USD BILLIONS)
      137. TABLE 136. GCC COUNTRIES SWEETENERS MARKET SIZE ESTIMATES & FORECAST, BY REGIONAL, 2019-2035 (USD BILLIONS)
      138. TABLE 137. SOUTH AFRICA SWEETENERS MARKET SIZE ESTIMATES & FORECAST, BY TYPE, 2019-2035 (USD BILLIONS)
      139. TABLE 138. SOUTH AFRICA SWEETENERS MARKET SIZE ESTIMATES & FORECAST, BY APPLICATION, 2019-2035 (USD BILLIONS)
      140. TABLE 139. SOUTH AFRICA SWEETENERS MARKET SIZE ESTIMATES & FORECAST, BY FORMULATION, 2019-2035 (USD BILLIONS)
      141. TABLE 140. SOUTH AFRICA SWEETENERS MARKET SIZE ESTIMATES & FORECAST, BY END USE, 2019-2035 (USD BILLIONS)
      142. TABLE 141. SOUTH AFRICA SWEETENERS MARKET SIZE ESTIMATES & FORECAST, BY REGIONAL, 2019-2035 (USD BILLIONS)
      143. TABLE 142. REST OF MEA SWEETENERS MARKET SIZE ESTIMATES & FORECAST, BY TYPE, 2019-2035 (USD BILLIONS)
      144. TABLE 143. REST OF MEA SWEETENERS MARKET SIZE ESTIMATES & FORECAST, BY APPLICATION, 2019-2035 (USD BILLIONS)
      145. TABLE 144. REST OF MEA SWEETENERS MARKET SIZE ESTIMATES & FORECAST, BY FORMULATION, 2019-2035 (USD BILLIONS)
      146. TABLE 145. REST OF MEA SWEETENERS MARKET SIZE ESTIMATES & FORECAST, BY END USE, 2019-2035 (USD BILLIONS)
      147. TABLE 146. REST OF MEA SWEETENERS MARKET SIZE ESTIMATES & FORECAST, BY REGIONAL, 2019-2035 (USD BILLIONS)
      148. TABLE 147. PRODUCT LAUNCH/PRODUCT DEVELOPMENT/APPROVAL
      149. TABLE 148. ACQUISITION/PARTNERSHIP                             LIST OF FIGURES
      150. FIGURE 1. MARKET SYNOPSIS
      151. FIGURE 2. NORTH AMERICA SWEETENERS MARKET ANALYSIS
      152. FIGURE 3. US SWEETENERS MARKET ANALYSIS BY TYPE
      153. FIGURE 4. US SWEETENERS MARKET ANALYSIS BY APPLICATION
      154. FIGURE 5. US SWEETENERS MARKET ANALYSIS BY FORMULATION
      155. FIGURE 6. US SWEETENERS MARKET ANALYSIS BY END USE
      156. FIGURE 7. US SWEETENERS MARKET ANALYSIS BY REGIONAL
      157. FIGURE 8. CANADA SWEETENERS MARKET ANALYSIS BY TYPE
      158. FIGURE 9. CANADA SWEETENERS MARKET ANALYSIS BY APPLICATION
      159. FIGURE 10. CANADA SWEETENERS MARKET ANALYSIS BY FORMULATION
      160. FIGURE 11. CANADA SWEETENERS MARKET ANALYSIS BY END USE
      161. FIGURE 12. CANADA SWEETENERS MARKET ANALYSIS BY REGIONAL
      162. FIGURE 13. EUROPE SWEETENERS MARKET ANALYSIS
      163. FIGURE 14. GERMANY SWEETENERS MARKET ANALYSIS BY TYPE
      164. FIGURE 15. GERMANY SWEETENERS MARKET ANALYSIS BY APPLICATION
      165. FIGURE 16. GERMANY SWEETENERS MARKET ANALYSIS BY FORMULATION
      166. FIGURE 17. GERMANY SWEETENERS MARKET ANALYSIS BY END USE
      167. FIGURE 18. GERMANY SWEETENERS MARKET ANALYSIS BY REGIONAL
      168. FIGURE 19. UK SWEETENERS MARKET ANALYSIS BY TYPE
      169. FIGURE 20. UK SWEETENERS MARKET ANALYSIS BY APPLICATION
      170. FIGURE 21. UK SWEETENERS MARKET ANALYSIS BY FORMULATION
      171. FIGURE 22. UK SWEETENERS MARKET ANALYSIS BY END USE
      172. FIGURE 23. UK SWEETENERS MARKET ANALYSIS BY REGIONAL
      173. FIGURE 24. FRANCE SWEETENERS MARKET ANALYSIS BY TYPE
      174. FIGURE 25. FRANCE SWEETENERS MARKET ANALYSIS BY APPLICATION
      175. FIGURE 26. FRANCE SWEETENERS MARKET ANALYSIS BY FORMULATION
      176. FIGURE 27. FRANCE SWEETENERS MARKET ANALYSIS BY END USE
      177. FIGURE 28. FRANCE SWEETENERS MARKET ANALYSIS BY REGIONAL
      178. FIGURE 29. RUSSIA SWEETENERS MARKET ANALYSIS BY TYPE
      179. FIGURE 30. RUSSIA SWEETENERS MARKET ANALYSIS BY APPLICATION
      180. FIGURE 31. RUSSIA SWEETENERS MARKET ANALYSIS BY FORMULATION
      181. FIGURE 32. RUSSIA SWEETENERS MARKET ANALYSIS BY END USE
      182. FIGURE 33. RUSSIA SWEETENERS MARKET ANALYSIS BY REGIONAL
      183. FIGURE 34. ITALY SWEETENERS MARKET ANALYSIS BY TYPE
      184. FIGURE 35. ITALY SWEETENERS MARKET ANALYSIS BY APPLICATION
      185. FIGURE 36. ITALY SWEETENERS MARKET ANALYSIS BY FORMULATION
      186. FIGURE 37. ITALY SWEETENERS MARKET ANALYSIS BY END USE
      187. FIGURE 38. ITALY SWEETENERS MARKET ANALYSIS BY REGIONAL
      188. FIGURE 39. SPAIN SWEETENERS MARKET ANALYSIS BY TYPE
      189. FIGURE 40. SPAIN SWEETENERS MARKET ANALYSIS BY APPLICATION
      190. FIGURE 41. SPAIN SWEETENERS MARKET ANALYSIS BY FORMULATION
      191. FIGURE 42. SPAIN SWEETENERS MARKET ANALYSIS BY END USE
      192. FIGURE 43. SPAIN SWEETENERS MARKET ANALYSIS BY REGIONAL
      193. FIGURE 44. REST OF EUROPE SWEETENERS MARKET ANALYSIS BY TYPE
      194. FIGURE 45. REST OF EUROPE SWEETENERS MARKET ANALYSIS BY APPLICATION
      195. FIGURE 46. REST OF EUROPE SWEETENERS MARKET ANALYSIS BY FORMULATION
      196. FIGURE 47. REST OF EUROPE SWEETENERS MARKET ANALYSIS BY END USE
      197. FIGURE 48. REST OF EUROPE SWEETENERS MARKET ANALYSIS BY REGIONAL
      198. FIGURE 49. APAC SWEETENERS MARKET ANALYSIS
      199. FIGURE 50. CHINA SWEETENERS MARKET ANALYSIS BY TYPE
      200. FIGURE 51. CHINA SWEETENERS MARKET ANALYSIS BY APPLICATION
      201. FIGURE 52. CHINA SWEETENERS MARKET ANALYSIS BY FORMULATION
      202. FIGURE 53. CHINA SWEETENERS MARKET ANALYSIS BY END USE
      203. FIGURE 54. CHINA SWEETENERS MARKET ANALYSIS BY REGIONAL
      204. FIGURE 55. INDIA SWEETENERS MARKET ANALYSIS BY TYPE
      205. FIGURE 56. INDIA SWEETENERS MARKET ANALYSIS BY APPLICATION
      206. FIGURE 57. INDIA SWEETENERS MARKET ANALYSIS BY FORMULATION
      207. FIGURE 58. INDIA SWEETENERS MARKET ANALYSIS BY END USE
      208. FIGURE 59. INDIA SWEETENERS MARKET ANALYSIS BY REGIONAL
      209. FIGURE 60. JAPAN SWEETENERS MARKET ANALYSIS BY TYPE
      210. FIGURE 61. JAPAN SWEETENERS MARKET ANALYSIS BY APPLICATION
      211. FIGURE 62. JAPAN SWEETENERS MARKET ANALYSIS BY FORMULATION
      212. FIGURE 63. JAPAN SWEETENERS MARKET ANALYSIS BY END USE
      213. FIGURE 64. JAPAN SWEETENERS MARKET ANALYSIS BY REGIONAL
      214. FIGURE 65. SOUTH KOREA SWEETENERS MARKET ANALYSIS BY TYPE
      215. FIGURE 66. SOUTH KOREA SWEETENERS MARKET ANALYSIS BY APPLICATION
      216. FIGURE 67. SOUTH KOREA SWEETENERS MARKET ANALYSIS BY FORMULATION
      217. FIGURE 68. SOUTH KOREA SWEETENERS MARKET ANALYSIS BY END USE
      218. FIGURE 69. SOUTH KOREA SWEETENERS MARKET ANALYSIS BY REGIONAL
      219. FIGURE 70. MALAYSIA SWEETENERS MARKET ANALYSIS BY TYPE
      220. FIGURE 71. MALAYSIA SWEETENERS MARKET ANALYSIS BY APPLICATION
      221. FIGURE 72. MALAYSIA SWEETENERS MARKET ANALYSIS BY FORMULATION
      222. FIGURE 73. MALAYSIA SWEETENERS MARKET ANALYSIS BY END USE
      223. FIGURE 74. MALAYSIA SWEETENERS MARKET ANALYSIS BY REGIONAL
      224. FIGURE 75. THAILAND SWEETENERS MARKET ANALYSIS BY TYPE
      225. FIGURE 76. THAILAND SWEETENERS MARKET ANALYSIS BY APPLICATION
      226. FIGURE 77. THAILAND SWEETENERS MARKET ANALYSIS BY FORMULATION
      227. FIGURE 78. THAILAND SWEETENERS MARKET ANALYSIS BY END USE
      228. FIGURE 79. THAILAND SWEETENERS MARKET ANALYSIS BY REGIONAL
      229. FIGURE 80. INDONESIA SWEETENERS MARKET ANALYSIS BY TYPE
      230. FIGURE 81. INDONESIA SWEETENERS MARKET ANALYSIS BY APPLICATION
      231. FIGURE 82. INDONESIA SWEETENERS MARKET ANALYSIS BY FORMULATION
      232. FIGURE 83. INDONESIA SWEETENERS MARKET ANALYSIS BY END USE
      233. FIGURE 84. INDONESIA SWEETENERS MARKET ANALYSIS BY REGIONAL
      234. FIGURE 85. REST OF APAC SWEETENERS MARKET ANALYSIS BY TYPE
      235. FIGURE 86. REST OF APAC SWEETENERS MARKET ANALYSIS BY APPLICATION
      236. FIGURE 87. REST OF APAC SWEETENERS MARKET ANALYSIS BY FORMULATION
      237. FIGURE 88. REST OF APAC SWEETENERS MARKET ANALYSIS BY END USE
      238. FIGURE 89. REST OF APAC SWEETENERS MARKET ANALYSIS BY REGIONAL
      239. FIGURE 90. SOUTH AMERICA SWEETENERS MARKET ANALYSIS
      240. FIGURE 91. BRAZIL SWEETENERS MARKET ANALYSIS BY TYPE
      241. FIGURE 92. BRAZIL SWEETENERS MARKET ANALYSIS BY APPLICATION
      242. FIGURE 93. BRAZIL SWEETENERS MARKET ANALYSIS BY FORMULATION
      243. FIGURE 94. BRAZIL SWEETENERS MARKET ANALYSIS BY END USE
      244. FIGURE 95. BRAZIL SWEETENERS MARKET ANALYSIS BY REGIONAL
      245. FIGURE 96. MEXICO SWEETENERS MARKET ANALYSIS BY TYPE
      246. FIGURE 97. MEXICO SWEETENERS MARKET ANALYSIS BY APPLICATION
      247. FIGURE 98. MEXICO SWEETENERS MARKET ANALYSIS BY FORMULATION
      248. FIGURE 99. MEXICO SWEETENERS MARKET ANALYSIS BY END USE
      249. FIGURE 100. MEXICO SWEETENERS MARKET ANALYSIS BY REGIONAL
      250. FIGURE 101. ARGENTINA SWEETENERS MARKET ANALYSIS BY TYPE
      251. FIGURE 102. ARGENTINA SWEETENERS MARKET ANALYSIS BY APPLICATION
      252. FIGURE 103. ARGENTINA SWEETENERS MARKET ANALYSIS BY FORMULATION
      253. FIGURE 104. ARGENTINA SWEETENERS MARKET ANALYSIS BY END USE
      254. FIGURE 105. ARGENTINA SWEETENERS MARKET ANALYSIS BY REGIONAL
      255. FIGURE 106. REST OF SOUTH AMERICA SWEETENERS MARKET ANALYSIS BY TYPE
      256. FIGURE 107. REST OF SOUTH AMERICA SWEETENERS MARKET ANALYSIS BY APPLICATION
      257. FIGURE 108. REST OF SOUTH AMERICA SWEETENERS MARKET ANALYSIS BY FORMULATION
      258. FIGURE 109. REST OF SOUTH AMERICA SWEETENERS MARKET ANALYSIS BY END USE
      259. FIGURE 110. REST OF SOUTH AMERICA SWEETENERS MARKET ANALYSIS BY REGIONAL
      260. FIGURE 111. MEA SWEETENERS MARKET ANALYSIS
      261. FIGURE 112. GCC COUNTRIES SWEETENERS MARKET ANALYSIS BY TYPE
      262. FIGURE 113. GCC COUNTRIES SWEETENERS MARKET ANALYSIS BY APPLICATION
      263. FIGURE 114. GCC COUNTRIES SWEETENERS MARKET ANALYSIS BY FORMULATION
      264. FIGURE 115. GCC COUNTRIES SWEETENERS MARKET ANALYSIS BY END USE
      265. FIGURE 116. GCC COUNTRIES SWEETENERS MARKET ANALYSIS BY REGIONAL
      266. FIGURE 117. SOUTH AFRICA SWEETENERS MARKET ANALYSIS BY TYPE
      267. FIGURE 118. SOUTH AFRICA SWEETENERS MARKET ANALYSIS BY APPLICATION
      268. FIGURE 119. SOUTH AFRICA SWEETENERS MARKET ANALYSIS BY FORMULATION
      269. FIGURE 120. SOUTH AFRICA SWEETENERS MARKET ANALYSIS BY END USE
      270. FIGURE 121. SOUTH AFRICA SWEETENERS MARKET ANALYSIS BY REGIONAL
      271. FIGURE 122. REST OF MEA SWEETENERS MARKET ANALYSIS BY TYPE
      272. FIGURE 123. REST OF MEA SWEETENERS MARKET ANALYSIS BY APPLICATION
      273. FIGURE 124. REST OF MEA SWEETENERS MARKET ANALYSIS BY FORMULATION
      274. FIGURE 125. REST OF MEA SWEETENERS MARKET ANALYSIS BY END USE
      275. FIGURE 126. REST OF MEA SWEETENERS MARKET ANALYSIS BY REGIONAL
      276. FIGURE 127. KEY BUYING CRITERIA OF SWEETENERS MARKET
      277. FIGURE 128. RESEARCH PROCESS OF MRFR
      278. FIGURE 129. DRO ANALYSIS OF SWEETENERS MARKET
      279. FIGURE 130. DRIVERS IMPACT ANALYSIS: SWEETENERS MARKET
      280. FIGURE 131. RESTRAINTS IMPACT ANALYSIS: SWEETENERS MARKET
      281. FIGURE 132. SUPPLY / VALUE CHAIN: SWEETENERS MARKET
      282. FIGURE 133. SWEETENERS MARKET, BY TYPE, 2025 (% SHARE)
      283. FIGURE 134. SWEETENERS MARKET, BY TYPE, 2019 TO 2035 (USD Billions)
      284. FIGURE 135. SWEETENERS MARKET, BY APPLICATION, 2025 (% SHARE)
      285. FIGURE 136. SWEETENERS MARKET, BY APPLICATION, 2019 TO 2035 (USD Billions)
      286. FIGURE 137. SWEETENERS MARKET, BY FORMULATION, 2025 (% SHARE)
      287. FIGURE 138. SWEETENERS MARKET, BY FORMULATION, 2019 TO 2035 (USD Billions)
      288. FIGURE 139. SWEETENERS MARKET, BY END USE, 2025 (% SHARE)
      289. FIGURE 140. SWEETENERS MARKET, BY END USE, 2019 TO 2035 (USD Billions)
      290. FIGURE 141. SWEETENERS MARKET, BY REGIONAL, 2025 (% SHARE)
      291. FIGURE 142. SWEETENERS MARKET, BY REGIONAL, 2019 TO 2035 (USD Billions)
      292. FIGURE 143. BENCHMARKING OF MAJOR COMPETITORS  

    Sweeteners Market Segmentation


    • Sweeteners Market By Type (USD Billion, 2019-2035)
      • Natural Sweeteners
      • Artificial Sweeteners
      • Sugar Alcohols
      • Stevia
      • Agave Syrup


    • Sweeteners Market By Application (USD Billion, 2019-2035)
      • Beverages
      • Bakery
      • Confectionery
      • Dairy Products
      • Sauces and Dressings


    • Sweeteners Market By Formulation (USD Billion, 2019-2035)
      • Liquid
      • Powder
      • Granular
      • Tabletop
      • Bulk


    • Sweeteners Market By End Use (USD Billion, 2019-2035)
      • Food Industry
      • Beverage Industry
      • Pharmaceuticals
      • Personal Care
      • Household Products


    • Sweeteners Market By Regional (USD Billion, 2019-2035)
      • North America
      • Europe
      • South America
      • Asia Pacific
      • Middle East and Africa


    Sweeteners Market Regional Outlook (USD Billion, 2019-2035)


    • North America Outlook (USD Billion, 2019-2035)
      • North America Sweeteners Market by Type
        • Natural Sweeteners
        • Artificial Sweeteners
        • Sugar Alcohols
        • Stevia
        • Agave Syrup
      • North America Sweeteners Market by Application Type
        • Beverages
        • Bakery
        • Confectionery
        • Dairy Products
        • Sauces and Dressings
      • North America Sweeteners Market by Formulation Type
        • Liquid
        • Powder
        • Granular
        • Tabletop
        • Bulk
      • North America Sweeteners Market by End Use Type
        • Food Industry
        • Beverage Industry
        • Pharmaceuticals
        • Personal Care
        • Household Products
      • North America Sweeteners Market by Regional Type
        • US
        • Canada
      • US Outlook (USD Billion, 2019-2035)
      • US Sweeteners Market by Type
        • Natural Sweeteners
        • Artificial Sweeteners
        • Sugar Alcohols
        • Stevia
        • Agave Syrup
      • US Sweeteners Market by Application Type
        • Beverages
        • Bakery
        • Confectionery
        • Dairy Products
        • Sauces and Dressings
      • US Sweeteners Market by Formulation Type
        • Liquid
        • Powder
        • Granular
        • Tabletop
        • Bulk
      • US Sweeteners Market by End Use Type
        • Food Industry
        • Beverage Industry
        • Pharmaceuticals
        • Personal Care
        • Household Products
      • CANADA Outlook (USD Billion, 2019-2035)
      • CANADA Sweeteners Market by Type
        • Natural Sweeteners
        • Artificial Sweeteners
        • Sugar Alcohols
        • Stevia
        • Agave Syrup
      • CANADA Sweeteners Market by Application Type
        • Beverages
        • Bakery
        • Confectionery
        • Dairy Products
        • Sauces and Dressings
      • CANADA Sweeteners Market by Formulation Type
        • Liquid
        • Powder
        • Granular
        • Tabletop
        • Bulk
      • CANADA Sweeteners Market by End Use Type
        • Food Industry
        • Beverage Industry
        • Pharmaceuticals
        • Personal Care
        • Household Products
      • Europe Outlook (USD Billion, 2019-2035)
        • Europe Sweeteners Market by Type
          • Natural Sweeteners
          • Artificial Sweeteners
          • Sugar Alcohols
          • Stevia
          • Agave Syrup
        • Europe Sweeteners Market by Application Type
          • Beverages
          • Bakery
          • Confectionery
          • Dairy Products
          • Sauces and Dressings
        • Europe Sweeteners Market by Formulation Type
          • Liquid
          • Powder
          • Granular
          • Tabletop
          • Bulk
        • Europe Sweeteners Market by End Use Type
          • Food Industry
          • Beverage Industry
          • Pharmaceuticals
          • Personal Care
          • Household Products
        • Europe Sweeteners Market by Regional Type
          • Germany
          • UK
          • France
          • Russia
          • Italy
          • Spain
          • Rest of Europe
        • GERMANY Outlook (USD Billion, 2019-2035)
        • GERMANY Sweeteners Market by Type
          • Natural Sweeteners
          • Artificial Sweeteners
          • Sugar Alcohols
          • Stevia
          • Agave Syrup
        • GERMANY Sweeteners Market by Application Type
          • Beverages
          • Bakery
          • Confectionery
          • Dairy Products
          • Sauces and Dressings
        • GERMANY Sweeteners Market by Formulation Type
          • Liquid
          • Powder
          • Granular
          • Tabletop
          • Bulk
        • GERMANY Sweeteners Market by End Use Type
          • Food Industry
          • Beverage Industry
          • Pharmaceuticals
          • Personal Care
          • Household Products
        • UK Outlook (USD Billion, 2019-2035)
        • UK Sweeteners Market by Type
          • Natural Sweeteners
          • Artificial Sweeteners
          • Sugar Alcohols
          • Stevia
          • Agave Syrup
        • UK Sweeteners Market by Application Type
          • Beverages
          • Bakery
          • Confectionery
          • Dairy Products
          • Sauces and Dressings
        • UK Sweeteners Market by Formulation Type
          • Liquid
          • Powder
          • Granular
          • Tabletop
          • Bulk
        • UK Sweeteners Market by End Use Type
          • Food Industry
          • Beverage Industry
          • Pharmaceuticals
          • Personal Care
          • Household Products
        • FRANCE Outlook (USD Billion, 2019-2035)
        • FRANCE Sweeteners Market by Type
          • Natural Sweeteners
          • Artificial Sweeteners
          • Sugar Alcohols
          • Stevia
          • Agave Syrup
        • FRANCE Sweeteners Market by Application Type
          • Beverages
          • Bakery
          • Confectionery
          • Dairy Products
          • Sauces and Dressings
        • FRANCE Sweeteners Market by Formulation Type
          • Liquid
          • Powder
          • Granular
          • Tabletop
          • Bulk
        • FRANCE Sweeteners Market by End Use Type
          • Food Industry
          • Beverage Industry
          • Pharmaceuticals
          • Personal Care
          • Household Products
        • RUSSIA Outlook (USD Billion, 2019-2035)
        • RUSSIA Sweeteners Market by Type
          • Natural Sweeteners
          • Artificial Sweeteners
          • Sugar Alcohols
          • Stevia
          • Agave Syrup
        • RUSSIA Sweeteners Market by Application Type
          • Beverages
          • Bakery
          • Confectionery
          • Dairy Products
          • Sauces and Dressings
        • RUSSIA Sweeteners Market by Formulation Type
          • Liquid
          • Powder
          • Granular
          • Tabletop
          • Bulk
        • RUSSIA Sweeteners Market by End Use Type
          • Food Industry
          • Beverage Industry
          • Pharmaceuticals
          • Personal Care
          • Household Products
        • ITALY Outlook (USD Billion, 2019-2035)
        • ITALY Sweeteners Market by Type
          • Natural Sweeteners
          • Artificial Sweeteners
          • Sugar Alcohols
          • Stevia
          • Agave Syrup
        • ITALY Sweeteners Market by Application Type
          • Beverages
          • Bakery
          • Confectionery
          • Dairy Products
          • Sauces and Dressings
        • ITALY Sweeteners Market by Formulation Type
          • Liquid
          • Powder
          • Granular
          • Tabletop
          • Bulk
        • ITALY Sweeteners Market by End Use Type
          • Food Industry
          • Beverage Industry
          • Pharmaceuticals
          • Personal Care
          • Household Products
        • SPAIN Outlook (USD Billion, 2019-2035)
        • SPAIN Sweeteners Market by Type
          • Natural Sweeteners
          • Artificial Sweeteners
          • Sugar Alcohols
          • Stevia
          • Agave Syrup
        • SPAIN Sweeteners Market by Application Type
          • Beverages
          • Bakery
          • Confectionery
          • Dairy Products
          • Sauces and Dressings
        • SPAIN Sweeteners Market by Formulation Type
          • Liquid
          • Powder
          • Granular
          • Tabletop
          • Bulk
        • SPAIN Sweeteners Market by End Use Type
          • Food Industry
          • Beverage Industry
          • Pharmaceuticals
          • Personal Care
          • Household Products
        • REST OF EUROPE Outlook (USD Billion, 2019-2035)
        • REST OF EUROPE Sweeteners Market by Type
          • Natural Sweeteners
          • Artificial Sweeteners
          • Sugar Alcohols
          • Stevia
          • Agave Syrup
        • REST OF EUROPE Sweeteners Market by Application Type
          • Beverages
          • Bakery
          • Confectionery
          • Dairy Products
          • Sauces and Dressings
        • REST OF EUROPE Sweeteners Market by Formulation Type
          • Liquid
          • Powder
          • Granular
          • Tabletop
          • Bulk
        • REST OF EUROPE Sweeteners Market by End Use Type
          • Food Industry
          • Beverage Industry
          • Pharmaceuticals
          • Personal Care
          • Household Products
        • APAC Outlook (USD Billion, 2019-2035)
          • APAC Sweeteners Market by Type
            • Natural Sweeteners
            • Artificial Sweeteners
            • Sugar Alcohols
            • Stevia
            • Agave Syrup
          • APAC Sweeteners Market by Application Type
            • Beverages
            • Bakery
            • Confectionery
            • Dairy Products
            • Sauces and Dressings
          • APAC Sweeteners Market by Formulation Type
            • Liquid
            • Powder
            • Granular
            • Tabletop
            • Bulk
          • APAC Sweeteners Market by End Use Type
            • Food Industry
            • Beverage Industry
            • Pharmaceuticals
            • Personal Care
            • Household Products
          • APAC Sweeteners Market by Regional Type
            • China
            • India
            • Japan
            • South Korea
            • Malaysia
            • Thailand
            • Indonesia
            • Rest of APAC
          • CHINA Outlook (USD Billion, 2019-2035)
          • CHINA Sweeteners Market by Type
            • Natural Sweeteners
            • Artificial Sweeteners
            • Sugar Alcohols
            • Stevia
            • Agave Syrup
          • CHINA Sweeteners Market by Application Type
            • Beverages
            • Bakery
            • Confectionery
            • Dairy Products
            • Sauces and Dressings
          • CHINA Sweeteners Market by Formulation Type
            • Liquid
            • Powder
            • Granular
            • Tabletop
            • Bulk
          • CHINA Sweeteners Market by End Use Type
            • Food Industry
            • Beverage Industry
            • Pharmaceuticals
            • Personal Care
            • Household Products
          • INDIA Outlook (USD Billion, 2019-2035)
          • INDIA Sweeteners Market by Type
            • Natural Sweeteners
            • Artificial Sweeteners
            • Sugar Alcohols
            • Stevia
            • Agave Syrup
          • INDIA Sweeteners Market by Application Type
            • Beverages
            • Bakery
            • Confectionery
            • Dairy Products
            • Sauces and Dressings
          • INDIA Sweeteners Market by Formulation Type
            • Liquid
            • Powder
            • Granular
            • Tabletop
            • Bulk
          • INDIA Sweeteners Market by End Use Type
            • Food Industry
            • Beverage Industry
            • Pharmaceuticals
            • Personal Care
            • Household Products
          • JAPAN Outlook (USD Billion, 2019-2035)
          • JAPAN Sweeteners Market by Type
            • Natural Sweeteners
            • Artificial Sweeteners
            • Sugar Alcohols
            • Stevia
            • Agave Syrup
          • JAPAN Sweeteners Market by Application Type
            • Beverages
            • Bakery
            • Confectionery
            • Dairy Products
            • Sauces and Dressings
          • JAPAN Sweeteners Market by Formulation Type
            • Liquid
            • Powder
            • Granular
            • Tabletop
            • Bulk
          • JAPAN Sweeteners Market by End Use Type
            • Food Industry
            • Beverage Industry
            • Pharmaceuticals
            • Personal Care
            • Household Products
          • SOUTH KOREA Outlook (USD Billion, 2019-2035)
          • SOUTH KOREA Sweeteners Market by Type
            • Natural Sweeteners
            • Artificial Sweeteners
            • Sugar Alcohols
            • Stevia
            • Agave Syrup
          • SOUTH KOREA Sweeteners Market by Application Type
            • Beverages
            • Bakery
            • Confectionery
            • Dairy Products
            • Sauces and Dressings
          • SOUTH KOREA Sweeteners Market by Formulation Type
            • Liquid
            • Powder
            • Granular
            • Tabletop
            • Bulk
          • SOUTH KOREA Sweeteners Market by End Use Type
            • Food Industry
            • Beverage Industry
            • Pharmaceuticals
            • Personal Care
            • Household Products
          • MALAYSIA Outlook (USD Billion, 2019-2035)
          • MALAYSIA Sweeteners Market by Type
            • Natural Sweeteners
            • Artificial Sweeteners
            • Sugar Alcohols
            • Stevia
            • Agave Syrup
          • MALAYSIA Sweeteners Market by Application Type
            • Beverages
            • Bakery
            • Confectionery
            • Dairy Products
            • Sauces and Dressings
          • MALAYSIA Sweeteners Market by Formulation Type
            • Liquid
            • Powder
            • Granular
            • Tabletop
            • Bulk
          • MALAYSIA Sweeteners Market by End Use Type
            • Food Industry
            • Beverage Industry
            • Pharmaceuticals
            • Personal Care
            • Household Products
          • THAILAND Outlook (USD Billion, 2019-2035)
          • THAILAND Sweeteners Market by Type
            • Natural Sweeteners
            • Artificial Sweeteners
            • Sugar Alcohols
            • Stevia
            • Agave Syrup
          • THAILAND Sweeteners Market by Application Type
            • Beverages
            • Bakery
            • Confectionery
            • Dairy Products
            • Sauces and Dressings
          • THAILAND Sweeteners Market by Formulation Type
            • Liquid
            • Powder
            • Granular
            • Tabletop
            • Bulk
          • THAILAND Sweeteners Market by End Use Type
            • Food Industry
            • Beverage Industry
            • Pharmaceuticals
            • Personal Care
            • Household Products
          • INDONESIA Outlook (USD Billion, 2019-2035)
          • INDONESIA Sweeteners Market by Type
            • Natural Sweeteners
            • Artificial Sweeteners
            • Sugar Alcohols
            • Stevia
            • Agave Syrup
          • INDONESIA Sweeteners Market by Application Type
            • Beverages
            • Bakery
            • Confectionery
            • Dairy Products
            • Sauces and Dressings
          • INDONESIA Sweeteners Market by Formulation Type
            • Liquid
            • Powder
            • Granular
            • Tabletop
            • Bulk
          • INDONESIA Sweeteners Market by End Use Type
            • Food Industry
            • Beverage Industry
            • Pharmaceuticals
            • Personal Care
            • Household Products
          • REST OF APAC Outlook (USD Billion, 2019-2035)
          • REST OF APAC Sweeteners Market by Type
            • Natural Sweeteners
            • Artificial Sweeteners
            • Sugar Alcohols
            • Stevia
            • Agave Syrup
          • REST OF APAC Sweeteners Market by Application Type
            • Beverages
            • Bakery
            • Confectionery
            • Dairy Products
            • Sauces and Dressings
          • REST OF APAC Sweeteners Market by Formulation Type
            • Liquid
            • Powder
            • Granular
            • Tabletop
            • Bulk
          • REST OF APAC Sweeteners Market by End Use Type
            • Food Industry
            • Beverage Industry
            • Pharmaceuticals
            • Personal Care
            • Household Products
          • South America Outlook (USD Billion, 2019-2035)
            • South America Sweeteners Market by Type
              • Natural Sweeteners
              • Artificial Sweeteners
              • Sugar Alcohols
              • Stevia
              • Agave Syrup
            • South America Sweeteners Market by Application Type
              • Beverages
              • Bakery
              • Confectionery
              • Dairy Products
              • Sauces and Dressings
            • South America Sweeteners Market by Formulation Type
              • Liquid
              • Powder
              • Granular
              • Tabletop
              • Bulk
            • South America Sweeteners Market by End Use Type
              • Food Industry
              • Beverage Industry
              • Pharmaceuticals
              • Personal Care
              • Household Products
            • South America Sweeteners Market by Regional Type
              • Brazil
              • Mexico
              • Argentina
              • Rest of South America
            • BRAZIL Outlook (USD Billion, 2019-2035)
            • BRAZIL Sweeteners Market by Type
              • Natural Sweeteners
              • Artificial Sweeteners
              • Sugar Alcohols
              • Stevia
              • Agave Syrup
            • BRAZIL Sweeteners Market by Application Type
              • Beverages
              • Bakery
              • Confectionery
              • Dairy Products
              • Sauces and Dressings
            • BRAZIL Sweeteners Market by Formulation Type
              • Liquid
              • Powder
              • Granular
              • Tabletop
              • Bulk
            • BRAZIL Sweeteners Market by End Use Type
              • Food Industry
              • Beverage Industry
              • Pharmaceuticals
              • Personal Care
              • Household Products
            • MEXICO Outlook (USD Billion, 2019-2035)
            • MEXICO Sweeteners Market by Type
              • Natural Sweeteners
              • Artificial Sweeteners
              • Sugar Alcohols
              • Stevia
              • Agave Syrup
            • MEXICO Sweeteners Market by Application Type
              • Beverages
              • Bakery
              • Confectionery
              • Dairy Products
              • Sauces and Dressings
            • MEXICO Sweeteners Market by Formulation Type
              • Liquid
              • Powder
              • Granular
              • Tabletop
              • Bulk
            • MEXICO Sweeteners Market by End Use Type
              • Food Industry
              • Beverage Industry
              • Pharmaceuticals
              • Personal Care
              • Household Products
            • ARGENTINA Outlook (USD Billion, 2019-2035)
            • ARGENTINA Sweeteners Market by Type
              • Natural Sweeteners
              • Artificial Sweeteners
              • Sugar Alcohols
              • Stevia
              • Agave Syrup
            • ARGENTINA Sweeteners Market by Application Type
              • Beverages
              • Bakery
              • Confectionery
              • Dairy Products
              • Sauces and Dressings
            • ARGENTINA Sweeteners Market by Formulation Type
              • Liquid
              • Powder
              • Granular
              • Tabletop
              • Bulk
            • ARGENTINA Sweeteners Market by End Use Type
              • Food Industry
              • Beverage Industry
              • Pharmaceuticals
              • Personal Care
              • Household Products
            • REST OF SOUTH AMERICA Outlook (USD Billion, 2019-2035)
            • REST OF SOUTH AMERICA Sweeteners Market by Type
              • Natural Sweeteners
              • Artificial Sweeteners
              • Sugar Alcohols
              • Stevia
              • Agave Syrup
            • REST OF SOUTH AMERICA Sweeteners Market by Application Type
              • Beverages
              • Bakery
              • Confectionery
              • Dairy Products
              • Sauces and Dressings
            • REST OF SOUTH AMERICA Sweeteners Market by Formulation Type
              • Liquid
              • Powder
              • Granular
              • Tabletop
              • Bulk
            • REST OF SOUTH AMERICA Sweeteners Market by End Use Type
              • Food Industry
              • Beverage Industry
              • Pharmaceuticals
              • Personal Care
              • Household Products
            • MEA Outlook (USD Billion, 2019-2035)
              • MEA Sweeteners Market by Type
                • Natural Sweeteners
                • Artificial Sweeteners
                • Sugar Alcohols
                • Stevia
                • Agave Syrup
              • MEA Sweeteners Market by Application Type
                • Beverages
                • Bakery
                • Confectionery
                • Dairy Products
                • Sauces and Dressings
              • MEA Sweeteners Market by Formulation Type
                • Liquid
                • Powder
                • Granular
                • Tabletop
                • Bulk
              • MEA Sweeteners Market by End Use Type
                • Food Industry
                • Beverage Industry
                • Pharmaceuticals
                • Personal Care
                • Household Products
              • MEA Sweeteners Market by Regional Type
                • GCC Countries
                • South Africa
                • Rest of MEA
              • GCC COUNTRIES Outlook (USD Billion, 2019-2035)
              • GCC COUNTRIES Sweeteners Market by Type
                • Natural Sweeteners
                • Artificial Sweeteners
                • Sugar Alcohols
                • Stevia
                • Agave Syrup
              • GCC COUNTRIES Sweeteners Market by Application Type
                • Beverages
                • Bakery
                • Confectionery
                • Dairy Products
                • Sauces and Dressings
              • GCC COUNTRIES Sweeteners Market by Formulation Type
                • Liquid
                • Powder
                • Granular
                • Tabletop
                • Bulk
              • GCC COUNTRIES Sweeteners Market by End Use Type
                • Food Industry
                • Beverage Industry
                • Pharmaceuticals
                • Personal Care
                • Household Products
              • SOUTH AFRICA Outlook (USD Billion, 2019-2035)
              • SOUTH AFRICA Sweeteners Market by Type
                • Natural Sweeteners
                • Artificial Sweeteners
                • Sugar Alcohols
                • Stevia
                • Agave Syrup
              • SOUTH AFRICA Sweeteners Market by Application Type
                • Beverages
                • Bakery
                • Confectionery
                • Dairy Products
                • Sauces and Dressings
              • SOUTH AFRICA Sweeteners Market by Formulation Type
                • Liquid
                • Powder
                • Granular
                • Tabletop
                • Bulk
              • SOUTH AFRICA Sweeteners Market by End Use Type
                • Food Industry
                • Beverage Industry
                • Pharmaceuticals
                • Personal Care
                • Household Products
              • REST OF MEA Outlook (USD Billion, 2019-2035)
              • REST OF MEA Sweeteners Market by Type
                • Natural Sweeteners
                • Artificial Sweeteners
                • Sugar Alcohols
                • Stevia
                • Agave Syrup
              • REST OF MEA Sweeteners Market by Application Type
                • Beverages
                • Bakery
                • Confectionery
                • Dairy Products
                • Sauces and Dressings
              • REST OF MEA Sweeteners Market by Formulation Type
                • Liquid
                • Powder
                • Granular
                • Tabletop
                • Bulk
              • REST OF MEA Sweeteners Market by End Use Type
                • Food Industry
                • Beverage Industry
                • Pharmaceuticals
                • Personal Care
                • Household Products


    Infographic

    Free Sample Request

    Kindly complete the form below to receive a free sample of this Report

    Get Free Sample

    Customer Strories

    “I am very pleased with how market segments have been defined in a relevant way for my purposes (such as "Portable Freezers & refrigerators" and "last-mile"). In general the report is well structured. Thanks very much for your efforts.”

    Victoria Milne

    Founder
    Case Study
    Chemicals and Materials