ID: MRFR/FnB/3565-HCR
128 Pages
Varsha More
Last Updated: April 06, 2026
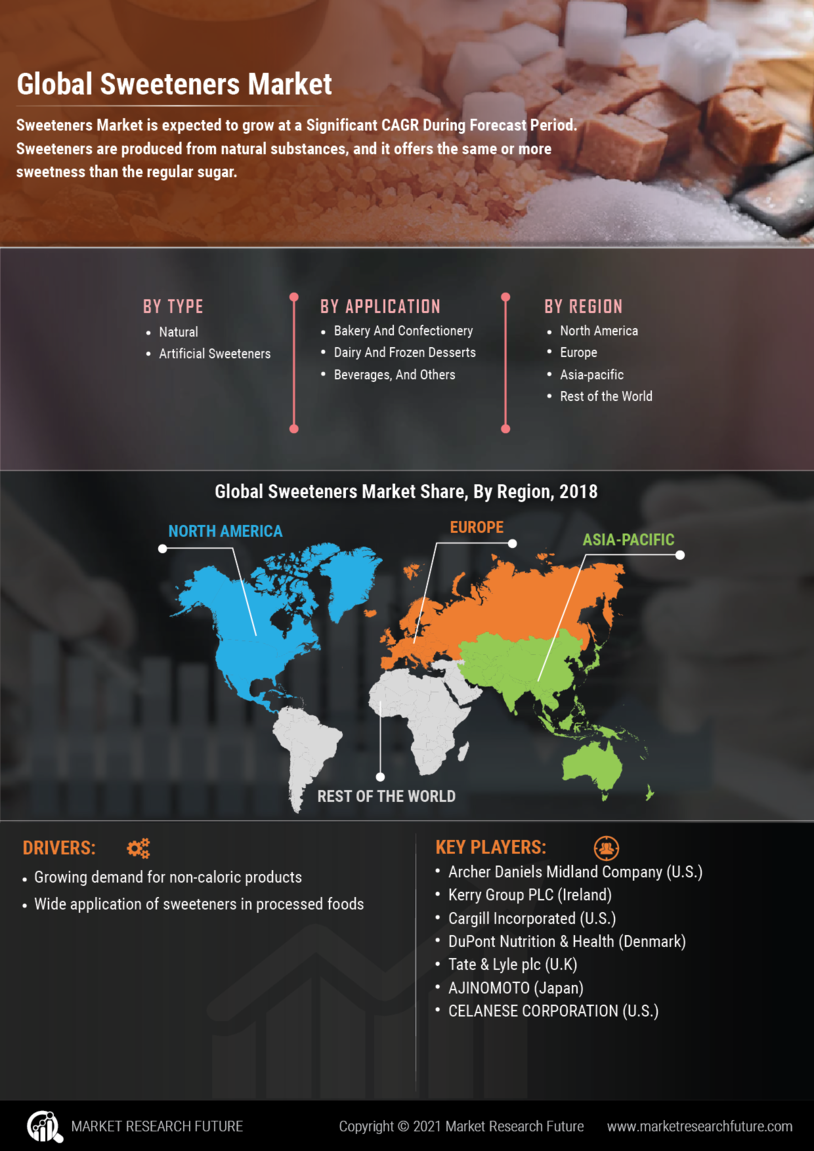
Sweeteners Market Size, Share, Industry Trend & Analysis Research Report By Type (Natural Sweeteners, Artificial Sweeteners, Sugar Alcohols, Stevia, Agave Syrup), By Application (Beverages, Bakery, Confectionery, Dairy Products, Sauces and Dressings), By Formulation (Liquid, Powder, Granular, Tabletop, Bulk), By End Use (Food Industry, Beverage Industry, Pharmaceuticals, Personal Care, Household Products) and By Regional (North America, Europe, South America, Asia Pacific, Middle East and Africa) - Forecast to 2035