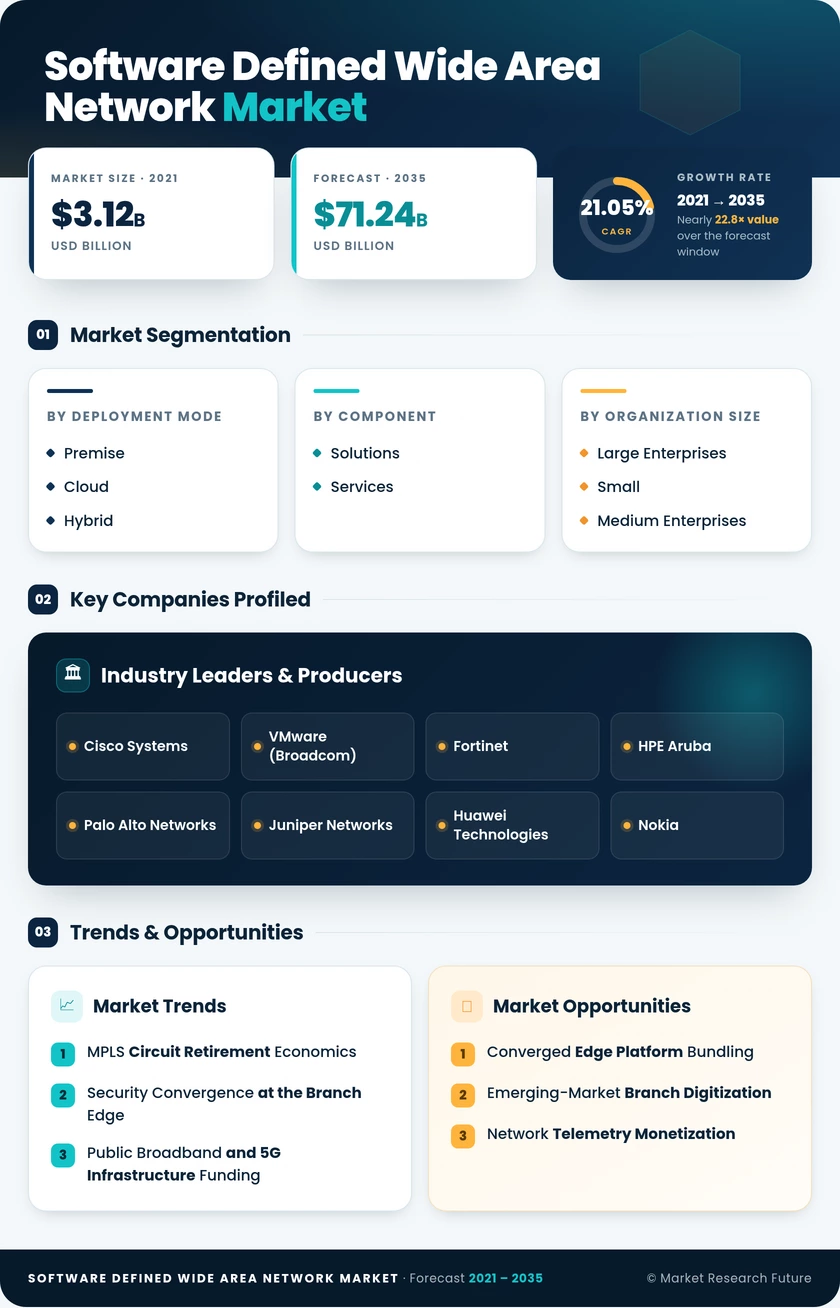
Market Segmentation Analysis
By Deployment Mode
9.1.1 Premise
9.1.2 Cloud
9.1.3 Hybrid
By Component
9.2.1 Solutions
9.2.2 Services
By Organization Size
9.3.1 Large Enterprises
9.3.2 Small and Medium Enterprises
By End-User Industry
9.4.1 Healthcare
9.4.2 BFSI
9.4.3 Retail and Consumer Services
9.4.4 Manufacturing
9.4.5 Transport and Logistics
9.4.6 IT and Telecom
| Dimension | Sub-Segments | Dominant Segment | Fastest Growing Segment |
| By Deployment Mode | Premise, Cloud, Hybrid | Premise (45.6% share, 2025) | Cloud (23.4% CAGR, 2026–2035) |
| By Component | Solutions, Services | Solutions (58.7% share, 2025) | Services (22.8% CAGR, 2026–2035) |
| By Organization Size | Large Enterprises, Small and Medium Enterprises | Large Enterprises (75.1% share, 2025) | Small and Medium Enterprises (21.9% CAGR, 2026–2035) |
| By End-User Industry | Healthcare, BFSI, Retail and Consumer Services, Manufacturing, Transport and Logistics, IT and Telecom | IT and Telecom (27.8% share, 2025) | Retail and Consumer Services (25.9% CAGR, 2026–2035) |
Market Segmentation Overview
By Deployment Mode
| Sub-Segment | Key Trend |
| Premise | Appliance-based control planes retained by regulated healthcare and banking buyers |
| Cloud | Consumption pricing removes capital barriers for mid-sized adopters. |
| Hybrid | Latency-critical workloads stay local while branches consume SaaS orchestration. |
Premise leads because HIPAA- and GDPR-facing organizations want the control plane inside facilities they own and audit. Cloud grows fastest as consumption pricing removes the capital approval step that historically blocked mid-market projects. Hybrid sits between them and is winning practical deployment volume — large estates rarely fit either pure model, so they run local enforcement at headquarters and plants while branch sites take cloud-orchestrated policy.
By Component
| Sub-Segment | Key Trend |
| Solutions | Edge appliances, subscription licenses, and centralized orchestration consoles |
| Services | Design, migration, and managed operations delivered by integrators and carriers. |
Solutions still carry the majority of revenue because every deployment requires licensed software and edge hardware regardless of who operates it. Services grow faster because the operational skills required — policy design, multi-vendor troubleshooting, security assurance — are scarce and expensive to hire. Vendor-neutral practices at large integrators have made outsourced operations acceptable to buyers who previously feared losing architectural control.
By Organization Size
| Sub-Segment | Key Trend |
| Large Enterprises | Thousand-site estates with multi-vendor interoperability and analytics demands |
| Small and Medium Enterprises | Simplified consoles and bundled security lower deployment barriers |
Large Enterprises dominate absolute spending because branch count drives licensing volume and their compliance requirements command premium feature tiers. Small and Medium Enterprises grow faster from a much smaller base, enabled by consoles that hide routing complexity entirely — a regional clinic group can deploy eight sites without employing a network engineer. Bundling firewall and threat management into one subscription has been the decisive commercial lever for this cohort.
By End-User Industry
| Sub-Segment | Key Trend |
| Healthcare | Telehealth traffic growth alongside clinical data residency obligations |
| BFSI | Branch compliance evidence and low-latency transaction path requirements |
| Retail and Consumer Services | Store-level digitization of payments, inventory, and customer experience |
| Manufacturing | Plant telemetry and industrial IoT backhaul from distributed facilities |
| Transport and Logistics | Depot connectivity and fleet telemetry aggregation |
| IT and Telecom | Mobile backhaul, data center interconnect, and managed connectivity resale. |
IT and Telecom leads because operators consume overlays twice — internally for backhaul and interconnect, and externally as a product they resell to enterprise customers. Retail and Consumer Services grows fastest as chains push payments, inventory sensing, and customer analytics into every store, turning low-value sites into bandwidth consumers. BFSI and Healthcare buy for different reasons entirely: transaction latency and branch audit evidence in the former, data residency and telehealth reliability in the latter.


 Noah Malgeri
Co-Founder

 Peter Groot koerkamp
Account and Business Manager

 Younghwan Choi
Senior Retail Manager

 Mark Irwin
Management Consultant

 Akif Moroglu
Strategy & Business Development Director

 Guilherme Gomes Martins
Product Management Director

 Joseph Aguayo
Sales Operations & Pricing Manager

 La Terria Dodd
Program Support Specialist

 Rob Kooiker
Group Product Manager HVAC & Fire Protection GMA