Certified Global Research Member
Isomar fd.webp Wcrc 57.webp
Key Questions Answered
  • Global Market Outlook
  • In-depth analysis of global and regional trends
  • Analyze and identify the major players in the market, their market share, key developments, etc.
  • To understand the capability of the major players based on products offered, financials, and strategies.
  • Identify disrupting products, companies, and trends.
  • To identify opportunities in the market.
  • Analyze the key challenges in the market.
  • Analyze the regional penetration of players, products, and services in the market.
  • Comparison of major playersโ€™ financial performance.
  • Evaluate strategies adopted by major players.
  • Recommendations
Why Choose Market Research Future?
  • Vigorous research methodologies for specific market.
  • Knowledge partners across the globe
  • Large network of partner consultants.
  • Ever-increasing/ Escalating data base with quarterly monitoring of various markets
  • Trusted by fortune 500 companies/startups/ universities/organizations
  • Large database of 5000+ markets reports.
  • Effective and prompt pre- and post-sales support.

Sodium Reduction Ingredients Market Research Report by Type (Amino Acids, Mineral Salts, Yeast Extract and others), Application (Bakery & Confectionery, Dairy & Frozen Foods, Sweet & Savory Snacks, Meat, Seafood & Poultry, Soups, Dressings & Salads and others) and Region (North America, Europe, Asia-Pacific, and Rest of the World)โ€”Forecast till 2030


ID: MRFR/F-B & N/3777-HCR | 110 Pages | Author: Pradeep Nandi| April 2024
Leading companies partner with us for data-driven Insights
client_1 client_2 client_3 client_4 client_5 client_6 client_7 client_8 client_9 client_10
Please fill in Business Email for Quick Response

TABLE OF CONTENTS

1. EXECUTIVE SUMMARY

1.1. Market Attractiveness Analysis

1.1.1. Global Sodium Reduction Ingredients Market, by Type

1.1.2. Global Sodium Reduction Ingredients Market, by Application

1.1.3. Global Sodium Reduction Ingredients Market, by Region

2. MARKET INTRODUCTION

2.1. Definition

2.2. Scope of the Study

2.3. Market Structure

2.4. Key Buying Criteria

2.5. Macro Factor Indicator Analysis

3. RESEARCH METHODOLOGY

3.1. Research Process

3.2. Primary Research

3.3. Secondary Research

3.4. Market Size Estimation

3.5. Forecast Model

3.6. List of Assumptions

4. MARKET DYNAMICS

4.1. Introduction

4.2. Drivers

4.3. Restraints

4.4. Opportunities

4.5. Challenges

5. MARKET FACTOR ANALYSIS

5.1. Value Chain Analysis

5.2. Supply Chain Analysis

5.3. Porterโ€™s Five Forces Model

5.3.1. Bargaining Power of Suppliers

5.3.2. Bargaining Power of Buyers

5.3.3. Threat of New Entrants

5.3.4. Threat of Substitutes

5.3.5. Intensity of Rivalry

6. GLOBAL SODIUM REDUCTION INGREDIENTS MARKET, BY TYPE

6.1. Introduction

6.2. Amino Acids

6.2.1. Amino Acids: Market Estimates & Forecast by Region/Country, 2022โ€“2030

6.3. Mineral Salts

6.3.1. Mineral Salts: Market Estimates & Forecast by Region/Country, 2022โ€“2030

6.3.2. Potassium Chloride

6.3.2.1. Potassium Chloride: Market Estimates & Forecast by Region/Country, 2022โ€“2030

6.3.3. Magnesium Sulfate

6.3.3.1. Magnessium Sulfate: Market Estimates & Forecast by Region/Country, 2022โ€“2030

6.3.4. Potassium Lactate

6.3.4.1. Potassium Lactate: Market Estimates & Forecast by Region/Country, 2022โ€“2030

6.3.5. Calcium Chloride

6.3.5.1. Mineral Salts: Market Estimates & Forecast by Region/Country, 2022โ€“2030

6.3.6. Others

6.3.6.1. Mineral Salts: Market Estimates & Forecast by Region/Country, 2022โ€“2030

6.4. Yeast Extracts

6.4.1. Yeast Extracts: Market Estimates & Forecast by Region/Country, 2022โ€“2030

6.5. Others

6.5.1. Others: Market Estimates & Forecast by Region/Country, 2022โ€“2030

7. GLOBAL SODIUM REDUCTION INGREDIENTS MARKET, BY APPLICATION

7.1. Introduction

7.2. Bakery & Confectionery

7.2.1. Bakery & Confectionery: Market Estimates & Forecast by Region/Country, 2022โ€“2030

7.3. Dairy & Frozen Foods

7.3.1. Swine: Market Estimates & Forecast by Region/Country, 2022โ€“2030

7.4. Sweet & Savory Snacks

7.4.1. Others: Market Estimates & Forecast by Region/Country, 2022โ€“2030

7.5. Meat, Seafood & Poultry

7.5.1. Meat, Seafood & Poultry: Market Estimates & Forecast by Region/Country, 2022โ€“2030

7.6. Soup, Salads, & Dressings

7.6.1. Soup, Salads, & Dressings: Market Estimates & Forecast by Region/Country, 2022โ€“2030

7.7. Others

7.7.1. Others: Market Estimates & Forecast by Region/Country, 2022โ€“2030

8. GLOBAL SODIUM REDUCTION INGREDIENTS MARKET, BY REGION

8.1. Introduction

8.2. North America

8.2.1. Market Estimates & Forecast by Type, 2022โ€“2030

8.2.2. Market Estimates & Forecast by Application, 2022โ€“2030

8.2.3. Market Estimates & Forecast by Country, 2022โ€“2030

8.2.4. US

8.2.4.1. Market Estimates & Forecast by Type, 2022โ€“2030

8.2.4.2. Market Estimates & Forecast by Application, 2022โ€“2030

8.2.5. Canada

8.2.5.1. Market Estimates & Forecast by Type, 2022โ€“2030

8.2.5.2. Market Estimates & Forecast by Application, 2022โ€“2030

8.2.6. Mexico

8.2.6.1. Market Estimates & Forecast by Type, 2022โ€“2030

8.2.6.2. Market Estimates & Forecast by Application, 2022โ€“2030

8.3. Europe

8.3.1. Market Estimates & Forecast by Type, 2022โ€“2030

8.3.2. Market Estimates & Forecast by Application, 2022โ€“2030

8.3.3. Market Estimates & Forecast by Country, 2022โ€“2030

8.3.4. Germany

8.3.4.1. Market Estimates & Forecast by Type, 2022โ€“2030

8.3.4.2. Market Estimates & Forecast by Application, 2022โ€“2030

8.3.5. UK

8.3.5.1. Market Estimates & Forecast by Type, 2022โ€“2030

8.3.5.2. Market Estimates & Forecast by Application, 2022โ€“2030

8.3.6. France

8.3.6.1. Market Estimates & Forecast by Type, 2022โ€“2030

8.3.6.2. Market Estimates & Forecast by Application, 2022โ€“2030

8.3.7. Spain

8.3.7.1. Market Estimates & Forecast by Type, 2022โ€“2030

8.3.7.2. Market Estimates & Forecast by Application, 2022โ€“2030

8.3.8. Italy

8.3.8.1. Market Estimates & Forecast by Type, 2022โ€“2030

8.3.8.2. Market Estimates & Forecast by Application, 2022โ€“2030

8.3.9. Rest of Europe

8.3.9.1. Market Estimates & Forecast by Type, 2022โ€“2030

8.3.9.2. Market Estimates & Forecast by Application, 2022โ€“2030

8.4. Asia-Pacific

8.4.1. Market Estimates & Forecast by Type, 2022โ€“2030

8.4.2. Market Estimates & Forecast by Application, 2022โ€“2030

8.4.3. Market Estimates & Forecast by Country, 2022โ€“2030

8.4.4. China

8.4.4.1. Market Estimates & Forecast by Type, 2022โ€“2030

8.4.4.2. Market Estimates & Forecast by Application, 2022โ€“2030

8.4.5. Japan

8.4.5.1. Market Estimates & Forecast by Type, 2022โ€“2030

8.4.5.2. Market Estimates & Forecast by Application, 2022โ€“2030

8.4.6. India

8.4.6.1. Market Estimates & Forecast by Type, 2022โ€“2030

8.4.6.2. Market Estimates & Forecast by Application, 2022โ€“2030

8.4.7. Australia & New Zealand

8.4.7.1. Market Estimates & Forecast by Type, 2022โ€“2030

8.4.7.2. Market Estimates & Forecast by Application, 2022โ€“2030

8.4.8. Rest of Asia-Pacific

8.4.8.1. Market Estimates & Forecast by Type, 2022โ€“2030

8.4.8.2. Market Estimates & Forecast by Application, 2022โ€“2030

8.5. Rest of the World

8.5.1. Market Estimates & Forecast by Type, 2022โ€“2030

8.5.2. Market Estimates & Forecast by Application, 2022โ€“2030

8.5.3. Market Estimates & Forecast by Country, 2022โ€“2030

8.5.4. South America

8.5.4.1. Market Estimates & Forecast by Type, 2022โ€“2030

8.5.4.2. Market Estimates & Forecast by Application, 2022โ€“2030

8.5.5. Middle East

8.5.5.1. Market Estimates & Forecast by Type, 2022โ€“2030

8.5.5.2. Market Estimates & Forecast by Application, 2022โ€“2030

8.5.6. Africa

8.5.6.1. Market Estimates & Forecast by Type, 2022โ€“2030

8.5.6.2. Market Estimates & Forecast by Application, 2022โ€“2030

9. COMPETITIVE LANDSCAPE

9.1. Introduction

9.2. Competitive Benchmarking

9.3. Development Share Analysis

9.4. Key Developments & Growth Strategies

10. COMPANY PROFILES

10.1. DSM NV

10.1.1. Company Overview

10.1.2. Financial Overview

10.1.3. Products Offered

10.1.4. Key Developments

10.1.5. SWOT Analysis

10.1.6. Key Strategies

10.2. Cargill Inc.

10.2.1. Company Overview

10.2.2. Financial Overview

10.2.3. Products Offered

10.2.4. Key Developments

10.2.5. SWOT Analysis

10.2.6. Key Strategies

10.3. AngelYeast Co., Ltd.

10.3.1. Company Overview

10.3.2. Financial Overview

10.3.3. Products Offered

10.3.4. Key Developments

10.3.5. SWOT Analysis

10.3.6. Key Strategies

10.4. Kerry Group plc

10.4.1. Company Overview

10.4.2. Financial Overview

10.4.3. Products Offered

10.4.4. Key Developments

10.4.5. SWOT Analysis

10.4.6. Key Strategies

10.5. Jungbunzlauer Suisse AG

10.5.1. Company Overview

10.5.2. Financial Overview

10.5.3. Products Offered

10.5.4. Key Developments

10.5.5. SWOT Analysis

10.5.6. Key Strategies

10.6. Innophos Holdings Inc.

10.6.1. Company Overview

10.6.2. Financial Overview

10.6.3. Products Offered

10.6.4. Key Developments

10.6.5. SWOT Analysis

10.6.6. Key Strategies

10.7. Sensient Technologies Corporation

10.7.1. Company Overview

10.7.2. Financial Overview

10.7.3. Products Offered

10.7.4. Key Developments

10.7.5. SWOT Analysis

10.7.6. Key Strategies

10.8. Tate & Lyle PLC

10.8.1. Company Overview

10.8.2. Financial Overview

10.8.3. Products Offered

10.8.4. Key Developments

10.8.5. SWOT Analysis

10.8.6. Key Strategies

10.9. Givaudan SA

10.9.1. Company Overview

10.9.2. Financial Overview

10.9.3. Products Offered

10.9.4. Key Developments

10.9.5. SWOT Analysis

10.9.6. Key Strategies

10.10. Corbion N.V.

10.10.1. Company Overview

10.10.2. Financial Overview

10.10.3. Products Offered

10.10.4. Key Developments

10.10.5. SWOT Analysis

10.10.6. Key Strategies

10.11. Barcelonesa Food Ingredients

10.11.1. Company Overview

10.11.2. Financial Overview

10.11.3. Products Offered

10.11.4. Key Developments

10.11.5. SWOT Analysis

10.11.6. Key Strategies

11. APPENDIX

11.1. General Sources & References

11.2. List of Abbreviation

LIST OF TABLES

Table 1 Global Sodium Reduction Ingredients Market, by Region, 2022โ€“2030 (USD Million)

Table 2 Global Sodium Reduction Ingredients Market, by Type, 2022โ€“2030 (USD Million)

Table 3 Global Sodium Reduction Ingredients Market, by Application, 2022โ€“2030 (USD Million)

Table 4 North America: Sodium Reduction Ingredients Market, by Country, 2022โ€“2030 (USD Million)

Table 5 North America: Sodium Reduction Ingredients Market, by Type, 2022โ€“2030 (USD Million)

Table 6 North America: Sodium Reduction Ingredients Market, by Application, 2022โ€“2030 (USD Million)

Table 7 US: Sodium Reduction Ingredients Market, by Type, 2022โ€“2030 (USD Million)

Table 8 US: Sodium Reduction Ingredients Market, by Application, 2022โ€“2030 (USD Million)

Table 9 Canada: Sodium Reduction Ingredients Market, by Type, 2022โ€“2030 (USD Million)

Table 10 Canada: Sodium Reduction Ingredients Market, by Application, 2022โ€“2030 (USD Million)

Table 11 Mexico: Sodium Reduction Ingredients Market, by Type, 2022โ€“2030 (USD Million)

Table 12 Mexico: Sodium Reduction Ingredients Market, by Application, 2022โ€“2030 (USD Million)

Table 13 Europe: Sodium Reduction Ingredients Market, by Country, 2022โ€“2030 (USD Million)

Table 14 Europe: Sodium Reduction Ingredients Market, by Type, 2022โ€“2030 (USD Million)

Table 15 Europe: Sodium Reduction Ingredients Market, by Application, 2022โ€“2030 (USD Million)

Table 16 Germany: Sodium Reduction Ingredients Market, by Type, 2022โ€“2030 (USD Million)

Table 17 Germany: Sodium Reduction Ingredients Market, by Application, 2022โ€“2030 (USD Million)

Table 18 France: Sodium Reduction Ingredients Market, by Type, 2022โ€“2030 (USD Million)

Table 19 France: Sodium Reduction Ingredients Market, by Application, 2022โ€“2030 (USD Million)

Table 20 Italy: Sodium Reduction Ingredients Market, by Type, 2022โ€“2030 (USD Million)

Table 21 Italy: Sodium Reduction Ingredients Market, by Application, 2022โ€“2030 (USD Million)

Table 22 Spain: Sodium Reduction Ingredients Market, by Type, 2022โ€“2030 (USD Million)

Table 23 Spain: Sodium Reduction Ingredients Market, by Application, 2022โ€“2030 (USD Million)

Table 24 UK: Sodium Reduction Ingredients Market, by Type, 2022โ€“2030 (USD Million)

Table 25 UK: Sodium Reduction Ingredients Market, by Application, 2022โ€“2030 (USD Million)

Table 26 Rest of Europe: Sodium Reduction Ingredients Market, by Type, 2022โ€“2030 (USD Million)

Table 27 Rest of Europe: Sodium Reduction Ingredients Market, by Application, 2022โ€“2030 (USD Million)

Table 28 Asia-Pacific: Sodium Reduction Ingredients Market, by Country, 2022โ€“2030 (USD Million)

Table 29 Asia-Pacific: Sodium Reduction Ingredients Market, by Type, 2022โ€“2030 (USD Million)

Table 30 Asia-Pacific: Sodium Reduction Ingredients Market, by Application, 2022โ€“2030 (USD Million)

Table 31 China: Sodium Reduction Ingredients Market, by Type, 2022โ€“2030 (USD Million)

Table 32 China: Sodium Reduction Ingredients Market, by Application, 2022โ€“2030 (USD Million)

Table 33 India: Sodium Reduction Ingredients Market, by Type, 2022โ€“2030 (USD Million)

Table 34 India: Sodium Reduction Ingredients Market, by Application, 2022โ€“2030 (USD Million)

Table 35 Japan: Sodium Reduction Ingredients Market, by Type, 2022โ€“2030 (USD Million)

Table 36 Japan: Sodium Reduction Ingredients Market, by Application, 2022โ€“2030 (USD Million)

Table 37 Australia & New Zealand: Sodium Reduction Ingredients Market, by Type, 2022โ€“2030 (USD Million)

Table 38 Australia & New Zealand: Sodium Reduction Ingredients Market, by Application, 2022โ€“2030 (USD Million)

Table 39 Rest of Asia-Pacific: Sodium Reduction Ingredients Market, by Type, 2022โ€“2030 (USD Million)

Table 40 Rest of Asia-Pacific: Sodium Reduction Ingredients Market, by Application, 2022โ€“2030 (USD Million)

Table 41 Rest of the World (RoW): Sodium Reduction Ingredients Market, by Country, 2022โ€“2030 (USD Million)

Table 42 Rest of the World (RoW): Sodium Reduction Ingredients Market, by Type, 2022โ€“2030 (USD Million)

Table 43 Rest of the World (RoW): Sodium Reduction Ingredients Market, by Application, 2022โ€“2030 (USD Million)

Table 44 South America: Sodium Reduction Ingredients Market, by Type, 2022โ€“2030 (USD Million)

Table 45 South America: Sodium Reduction Ingredients Market, by Application, 2022โ€“2030 (USD Million)

Table 46 Middle East: Sodium Reduction Ingredients Market, by Type, 2022โ€“2030 (USD Million)

Table 47 Middle East: Sodium Reduction Ingredients Market, by Application, 2022โ€“2030 (USD Million)

Table 48 Africa: Sodium Reduction Ingredients Market, by Type, 2022โ€“2030 (USD Million)

Table 49 Africa: Sodium Reduction Ingredients Market, by Application, 2022โ€“2030 (USD Million)

LIST OF FIGURES

FIGURE 1 Global 
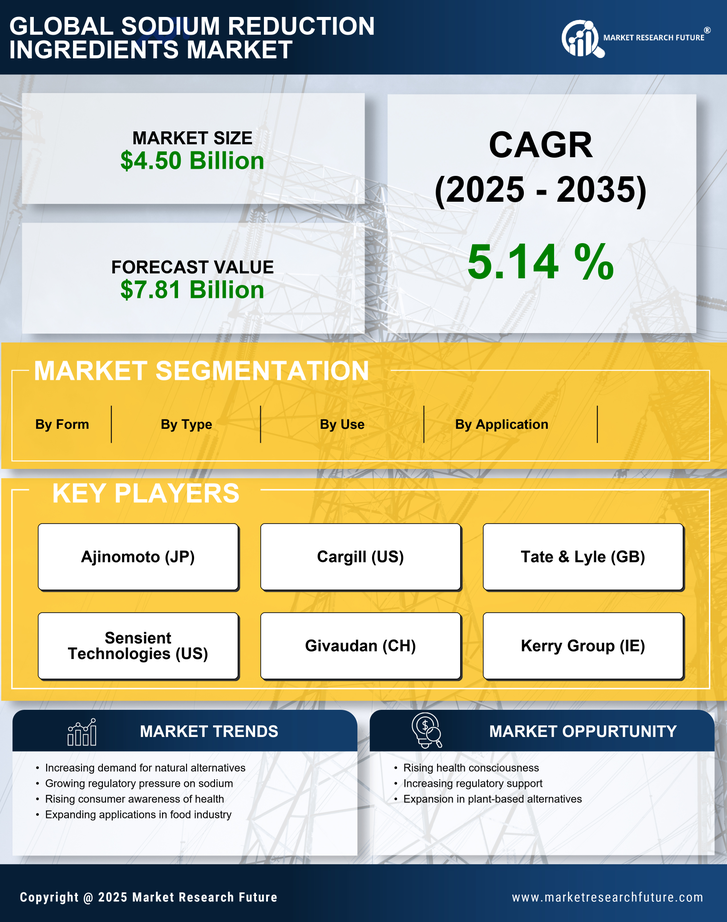
Sodium Reduction Ingredients Market Segmentation

FIGURE 2 Forecast Research Methodology

FIGURE 3 Five Forces Analysis of the Global Sodium Reduction Ingredients Market

FIGURE 4 Value Chain of the Global Sodium Reduction Ingredients Market

FIGURE 5 Share of the Global Sodium Reduction Ingredients Market in 2022, by Country (%)

FIGURE 6 Global Sodium Reduction Ingredients Market, by Region, 2022โ€“2030,

FIGURE 7 Global Sodium Reduction Ingredients Market Size, by Type, 2022

FIGURE 8 Share of the Global Sodium Reduction Ingredients Market, by Type, 2022โ€“2030 (%)

FIGURE 9 Global Sodium Reduction Ingredients Market Size, by Application, 2022

FIGURE 10 Share of the Global Sodium Reduction Ingredients Market, by Application, 2022โ€“2030 (%)

Purchase Option
Single User $ 4,950
Multiuser License $ 5,950
Enterprise User $ 7,250
Compare Licenses
Tailored for You
  • Dedicated Research on any specifics segment or region.
  • Focused Research on specific players in the market.
  • Custom Report based only on your requirements.
  • Flexibility to add or subtract any chapter in the study.
  • Historic data from 2014 and forecasts outlook till 2040.
  • Flexibility of providing data/insights in formats (PDF, PPT, Excel).
  • Provide cross segmentation in applicable scenario/markets.