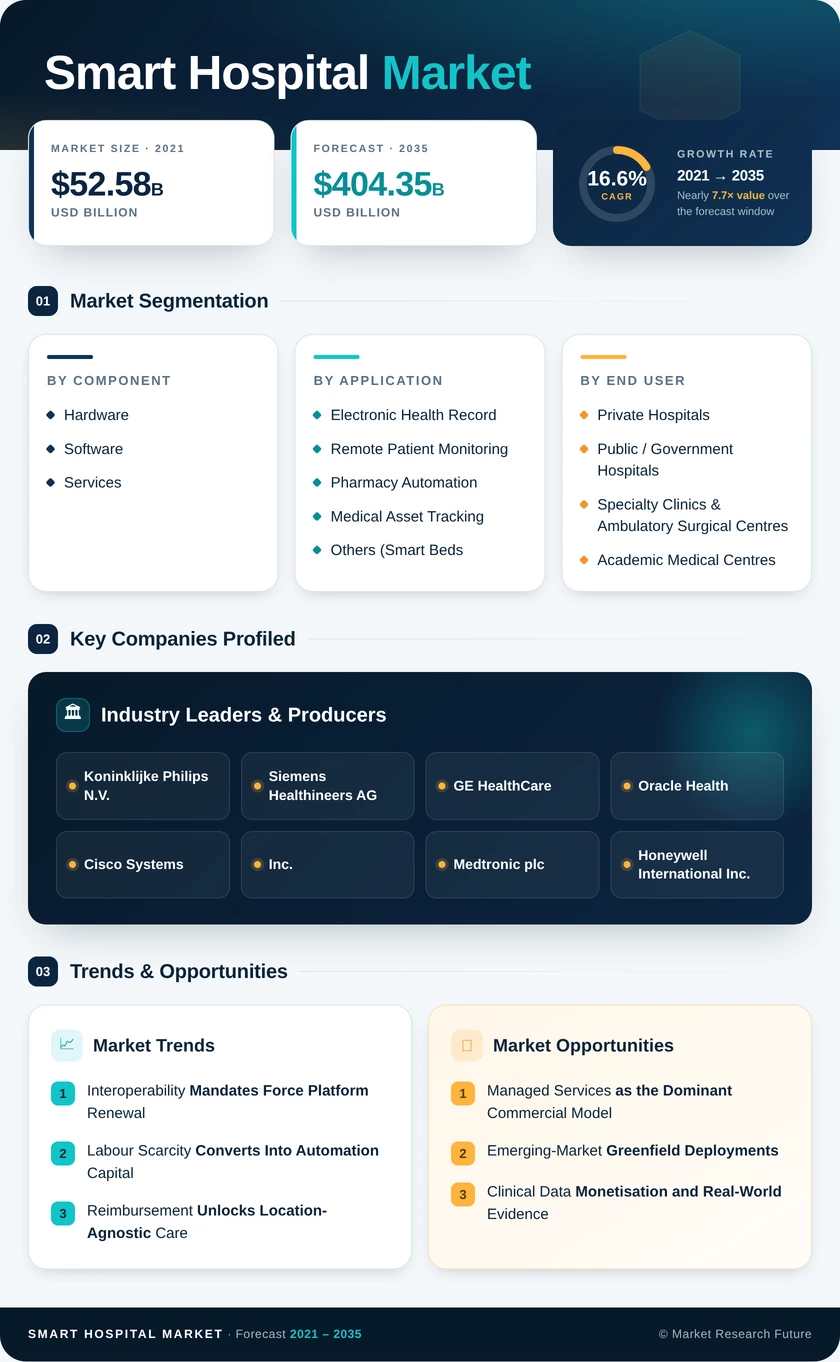
Smart Hospital Market (2026 – 2035)

ID: MRFR/SEM/3090-HCR 200 Pages Kiran Jinkalwad Last Updated: September 15, 2026
Smart Hospital Market Size, Share and Research Report By Type (General Services, Specialty, Super-Specialty), By Application (Remote Medicine Management, Outpatient Vigilance, Medical Assistance, Medical Connected Imaging, Electronic Health Record, Clinic Workflow), And By Region (North America, Europe, Asia-Pacific, And Rest Of The World) – Industry Forecast Till 2035
Smart Hospital Market
Market Size
Forecast Period2026-2035
CAGR (2026-2035)16.6%
2025 Market SizeUSD 87.05 Billion
2035 Market SizeUSD 404.35 Billion
Key Players
Koninklijke Philips N.V.
Siemens Healthineers AG
GE HealthCare
Oracle Health
Cisco Systems, Inc.
Medtronic plc
Opportunities
  • Managed Services as the Dominant Commercial Model
  • Emerging-Market Greenfield Deployments
  • Clinical Data Monetisation and Real-World Evidence
  1. 1 Market Overview |
    1. 1.1 Study Assumptions & Market Definition |
    2. 1.2 Scope of the Study |
    3. 1.3 Research Methodology
  2. 2 Market Summary & Key Report Takeaways |
    1. 2.1 Takeaways by Component |
    2. 2.2 Takeaways by Application |
    3. 2.3 Takeaways by Geography
  3. 3 Market Size & Forecast (2021–2035) |
    1. 3.1 Historical Market Size (2021–2024) |
    2. 3.2 Base Year Estimation (2025) |
    3. 3.3 Forecast Market Size (2026–2035) |
    4. 3.4 Year-over-Year Growth Analysis
  4. 4 Driver Impact Analysis |
    1. 4.1 Interoperability Mandates Force Platform Renewal |
    2. 4.2 Labour Scarcity Converts Into Automation Capital |
    3. 4.3 Reimbursement Unlocks Location-Agnostic Care |
    4. 4.4 Connectivity Upgrades Enable Real-Time Clinical Analytics
  5. 5 Restraints Impact Analysis |
    1. 5.1 Cyber Risk Repriced the Whole Category |
    2. 5.2 Integration Debt Consumes the Budget |
    3. 5.3 Margin Pressure Delays Community-Hospital Adoption
  6. 6 Opportunity Analysis |
    1. 6.1 Managed Services as the Dominant Commercial Model |
    2. 6.2 Emerging-Market Greenfield Deployments |
    3. 6.3 Clinical Data Monetisation and Real-World Evidence |
    4. 6.4 Ambient Documentation and Autonomous Workflow |
    5. 6.5 Asset Utilisation and Capacity Recovery |
    6. 6.6 Industry Value Chain Analysis |
    7. 6.7 Porter's Five Forces Analysis
  7. 7 Regional Analysis |
    1. 7.1 North America | |
      1. 7.1.1 US | |
      2. 7.1.2 Canada | |
      3. 7.1.3 Mexico |
    2. 7.2 Europe | |
      1. 7.2.1 Germany | |
      2. 7.2.2 UK | |
      3. 7.2.3 France | |
      4. 7.2.4 Italy | |
      5. 7.2.5 Spain | |
      6. 7.2.6 Nordic Countries | |
      7. 7.2.7 Russia | |
      8. 7.2.8 Rest of Europe |
    3. 7.3 Asia-Pacific | |
      1. 7.3.1 China | |
      2. 7.3.2 India | |
      3. 7.3.3 Japan | |
      4. 7.3.4 South Korea | |
      5. 7.3.5 ASEAN | |
      6. 7.3.6 Rest of Asia-Pacific |
    4. 7.4 South America | |
      1. 7.4.1 Brazil | |
      2. 7.4.2 Argentina | |
      3. 7.4.3 Rest of South America |
    5. 7.5 Middle East & Africa | |
      1. 7.5.1 Saudi Arabia | |
      2. 7.5.2 UAE | |
      3. 7.5.3 South Africa | |
      4. 7.5.4 Egypt | |
      5. 7.5.5 Rest of Middle East & Africa
  8. 8 Future Outlook (2026–2035) |
    1. 8.1 Autonomous Clinical Operations |
    2. 8.2 Platform Economics and Vendor Consolidation |
    3. 8.3 Care Delivery Beyond the Building |
    4. 8.4 Sustainability and Energy Reporting
  9. 9 Market Segmentation Analysis |
    1. 9.1 By Component | |
      1. 9.1.1 Hardware | |
      2. 9.1.2 Software | |
      3. 9.1.3 Services |
    2. 9.2 By Application | |
      1. 9.2.1 Electronic Health Record | |
      2. 9.2.2 Remote Patient Monitoring | |
      3. 9.2.3 Pharmacy Automation | |
      4. 9.2.4 Medical Asset Tracking | |
      5. 9.2.5 Others (Smart Beds, Wayfinding, OR Integration) |
    3. 9.3 By End User | |
      1. 9.3.1 Private Hospitals | |
      2. 9.3.2 Public / Government Hospitals | |
      3. 9.3.3 Specialty Clinics & Ambulatory Surgical Centres | |
      4. 9.3.4 Academic Medical Centres
  10. 10 Competitive Landscape |
    1. 10.1 Market Concentration Analysis (2026) |
    2. 10.2 Competitive Benchmarking Matrix |
    3. 10.3 Company Profiles | |
      1. 10.3.1 Koninklijke Philips N.V. | |
      2. 10.3.2 Siemens Healthineers AG | |
      3. 10.3.3 GE HealthCare | |
      4. 10.3.4 Oracle Health | |
      5. 10.3.5 Cisco Systems, Inc. | |
      6. 10.3.6 Medtronic plc | |
      7. 10.3.7 Honeywell International Inc. | |
      8. 10.3.8 Johnson Controls International | |
      9. 10.3.9 Baxter International (Hillrom) | |
      10. 10.3.10 Microsoft Corporation | |
      11. 10.3.11 Schneider Electric SE | |
      12. 10.3.12 Securitas Healthcare
  11. 11 Recent News & Developments
  12. 12 Report Scope & Methodology |
    1. 12.1 Study Period & Base Year |
    2. 12.2 Valuation Currency & Assumptions
  13. 13 Detailed Sources & Citations |
    1. 13.1 Data Sources |
    2. 13.2 Abbreviations
  14. 14 Frequently Asked Questions (FAQs)
  15. 15 LIST OF TABLES |
  16. TABLE 1 Global Smart Hospital Market Size & Forecast, by Revenue (USD Billion), 2021–2035 |
  17. TABLE 2 Global Smart Hospital Market — Year-over-Year Growth Analysis, 2021–2035 |
  18. TABLE 3 Driver Impact Analysis — Global Smart Hospital Market, 2026–2035 |
  19. TABLE 4 Restraint Impact Analysis — Global Smart Hospital Market, 2026–2035 |
  20. TABLE 5 Global Smart Hospital Market Size, by Component, 2021–2035 (USD Billion) |
  21. TABLE 6 Global Smart Hospital Market Size, by Application, 2021–2035 (USD Billion) |
  22. TABLE 7 Global Smart Hospital Market Size, by End User, 2021–2035 (USD Billion) |
  23. TABLE 8 Global Smart Hospital Market Size, by Region, 2021–2035 (USD Billion) |
  24. TABLE 9 North America Smart Hospital Market Size, by Country, 2021–2035 (USD Billion) |
  25. TABLE 10 Europe Smart Hospital Market Size, by Country, 2021–2035 (USD Billion) |
  26. TABLE 11 Asia-Pacific Smart Hospital Market Size, by Country, 2021–2035 (USD Billion) |
  27. TABLE 12 South America Smart Hospital Market Size, by Country, 2021–2035 (USD Billion) |
  28. TABLE 13 Middle East & Africa Smart Hospital Market Size, by Country, 2021–2035 (USD Billion) |
  29. TABLE 14 North America Smart Hospital Market Size, by Component, 2021–2035 (USD Billion) |
  30. TABLE 15 North America Smart Hospital Market Size, by Application, 2021–2035 (USD Billion) |
  31. TABLE 16 Europe Smart Hospital Market Size, by Component, 2021–2035 (USD Billion) |
  32. TABLE 17 Europe Smart Hospital Market Size, by Application, 2021–2035 (USD Billion) |
  33. TABLE 18 Asia-Pacific Smart Hospital Market Size, by Component, 2021–2035 (USD Billion) |
  34. TABLE 19 Asia-Pacific Smart Hospital Market Size, by Application, 2021–2035 (USD Billion) |
  35. TABLE 20 South America Smart Hospital Market Size, by Component, 2021–2035 (USD Billion) |
  36. TABLE 21 Middle East & Africa Smart Hospital Market Size, by Component, 2021–2035 (USD Billion) |
  37. TABLE 22 US Smart Hospital Market Size, by Application, 2021–2035 (USD Billion) |
  38. TABLE 23 Germany Smart Hospital Market Size, by Application, 2021–2035 (USD Billion) |
  39. TABLE 24 China Smart Hospital Market Size, by Application, 2021–2035 (USD Billion) |
  40. TABLE 25 India Smart Hospital Market Size, by Application, 2021–2035 (USD Billion) |
  41. TABLE 26 Competitive Benchmarking Matrix — Global Smart Hospital Market, 2026 |
  42. TABLE 27 Company Profiles — Key Players, Global Smart Hospital Market |
  43. TABLE 28 Recent Developments & Strategic Announcements, 2023–2025 |
  44. TABLE 29 Report Scope & Methodology Summary |
  45. TABLE 30 Detailed Sources and Citations Index
  46. 16 LIST OF FIGURES |
  47. FIGURE 1 Global Smart Hospital Market — Market Dynamics Overview (Drivers, Restraints, Opportunities) |
  48. FIGURE 2 Industry Value Chain Analysis — Smart Hospital Ecosystem |
  49. FIGURE 3 Porter's Five Forces Analysis — Global Smart Hospital Market |
  50. FIGURE 4 Global Smart Hospital Market Size Trend, 2021–2035 (USD Billion) |
  51. FIGURE 5 Year-over-Year Growth Trend, 2022–2035 (%) |
  52. FIGURE 6 Market Share by Component, 2025 vs 2035 (%) |
  53. FIGURE 7 Market Share by Application, 2025 vs 2035 (%) |
  54. FIGURE 8 Market Share by End User, 2025 (%) |
  55. FIGURE 9 Regional Share Distribution, 2025 (%) |
  56. FIGURE 10 Regional Share Distribution, 2035 (%) |
  57. FIGURE 11 Regional CAGR Comparison, 2026–2035 (%) |
  58. FIGURE 12 North America Country-Level Share, 2025 (%) |
  59. FIGURE 13 Europe Country-Level Share, 2025 (%) |
  60. FIGURE 14 Asia-Pacific Country-Level Share, 2025 (%) |
  61. FIGURE 15 Competitive Landscape — Estimated Revenue Share Ranges, 2026 (%) |
  62. FIGURE 16 Competitive Positioning Matrix — Capability vs Geographic Reach |
  63. FIGURE 17 Driver Impact Contribution Chart, 2026–2035 |
  64. FIGURE 18 Restraint Impact Contribution Chart, 2026–2035

Segmentation Quick Reference

DimensionSub-SegmentsDominant SegmentFastest Growing Segment
By ComponentHardware; Software; ServicesHardwareServices
By ApplicationElectronic Health Record; Remote Patient Monitoring; Pharmacy Automation; Medical Asset Tracking; Others (Smart Beds, Wayfinding, OR Integration)Electronic Health RecordRemote Patient Monitoring
By End UserPrivate Hospitals; Public / Government Hospitals; Specialty Clinics & Ambulatory Surgical Centres; Academic Medical CentresPrivate HospitalsSpecialty Clinics & Ambulatory Surgical Centres
By GeographyNorth America; Europe; Asia-Pacific; South America; Middle East & AfricaNorth AmericaAsia-Pacific


Market Segmentation Overview

By Component

Sub-SegmentKey Trend
HardwareSensor-instrumented beds and edge gateways replace passive fixtures; refresh cycles shorten to five years.
SoftwareOrchestration layers displace point applications as buyers consolidate contracts.
ServicesPer-bed managed subscriptions absorb integration, monitoring and cyber operations.


Component economics are inverting. Capital purchases once dominated hospital budgets; contracted capability now grows fastest because facilities cannot recruit the operational staff that ownership demands.

By Application

Sub-SegmentKey Trend
Electronic Health RecordCertification and information-blocking rules drive replacement rather than net-new adoption.
Remote Patient MonitoringReimbursement expansion converts monitoring into a recurring revenue line for providers.
Pharmacy AutomationClosed-loop dispensing spreads from tertiary centres into community facilities.
Medical Asset TrackingLocation networks recover 12–18% of nominal equipment fleets, deferring capital purchases.
Others (Smart Beds, Wayfinding, OR Integration)Patient-experience and theatre-throughput investments gain board-level visibility.


Applications tied to patients rather than buildings compound faster. Every enrolled monitoring patient generates recurring device, connectivity and analytics revenue, whereas record migrations are one-time events followed by long maintenance plateaus.

By End User

Sub-SegmentKey Trend
Private HospitalsDigital capability used as differentiation in payer and patient competition
Public / Government HospitalsNational grant programmes tie funding to measurable digital maturity scores.
Specialty Clinics & Ambulatory Surgical CentresProcedure migration out of acute settings pulls platform spending downstream.
Academic Medical CentresResearch data infrastructure and trial recruitment justify premium architectures.


Buying behaviour tracks balance-sheet strength more than clinical ambition. Private groups move first, public systems move at grant cadence, and ambulatory settings expand fastest as procedures shift out of inpatient facilities.

By Geography

Sub-SegmentKey Trend
North AmericaEnforcement-driven platform renewal and cyber-insurance conditionality
EuropeCross-border data infrastructure obligations with a binding 2030 horizon
Asia-PacificFoundational digitisation plus greenfield hospital construction at scale
South AmericaPublic-hospital record modernisation constrained by budget-cycle volatility
Middle East & AfricaPurpose-built medical cities specifying integrated platforms at design stage


Regional divergence rests on funding structure. Where capital arrives centrally and on schedule, deployment is deep but slow; where it arrives commercially, adoption is fast and uneven.




Download PDF ×

We do not share your information with anyone. However, we may send you emails based on your report interest from time to time. You may contact us at any time to opt-out.