×
  • Cat-intel
  • MedIntelliX
  • Resources
  • About Us
  • Hero Background
    English
    Chinese
    French
    Japanese
    Korean
    German
    Spanish

    Shale Gas Market Analysis

    ID: MRFR/E&P/10258-HCR
    128 Pages
    Priya Nagrale
    October 2025

    Shale Gas Market Research Report By Application (Power Generation, Heating, Chemical Feedstock, Transportation, Industrial Processes), By End Use (Residential, Commercial, Industrial, Utilities), By Method of Extraction (Hydraulic Fracturing, Horizontal Drilling, Vertical Drilling, Combination Techniques), By Market Player Type (Independent Producers, Major Oil and Gas Companies, Service Provid...

    Share:
    Download PDF ×

    We do not share your information with anyone. However, we may send you emails based on your report interest from time to time. You may contact us at any time to opt-out.

    Shale Gas Market Infographic
    Purchase Options

    Market Analysis

    In-depth Analysis of Shale Gas Market Industry Landscape

    Given the changes in the law, the shale gas market has gone through huge changes. Shield gas could help governments meet their energy needs while also reducing their reliance on fossil fuels. By changing their rules, some places have made it easier to look for and create shale gas. But in some places, the rules have become stricter because people are worried about the effects on the environment, such as water use and the chance of polluting groundwater. The regulatory scene is always changing because of how pro-business policies and environmental factors interact with each other. These environmental factors have a big impact on how the market works. Shallow gas businesses are also affected by changes in technology in a big way. Better fracking methods make the process much faster and cheaper, which leads to more shale gas being produced. Drilling horizontally is a new and advanced technique that has opened up new gas resources that were previously out of reach. By raising the number of viable supplies and lowering production costs, these improvements make shale gas a more desirable energy source. Another thing that affects the growth rate is the level of competition in the business. More and more businesses in the industry use market share, backup numbers, and expert know-how as their main measures. Because of the competition, the industry has become very strong and busy, which has led to more efficiency and new ideas. On top of that, changes in the economy and politics of one area affect the production and prices of shale gas around the world because the energy markets are so connected. Shale gas is a business that is growing because the world needs more energy. Because more and more people want to use cleaner and better environmental energy sources, shale gas has become the most popular intermediate fuel. As a result of its flexibility in both production and use, it has become more important for countries that want to reduce their carbon output and broaden their energy sources. It is good for businesses to find a balance between making sure there is a steady flow of energy and taking care of environmental problems. Questions of social and environmental duty have a big effect on the growth and share of the global market. Communities, users, and investors are among the groups pushing shale gas companies to be more open and responsible.

    Author
    Priya Nagrale
    Senior Research Analyst

    With an experience of over five years in market research industry (Chemicals & Materials domain), I gather and analyze market data from diverse sources to produce results, which are then presented back to a client. Also, provide recommendations based on the findings. As a Senior Research Analyst, I perform quality checks (QC) for market estimations, QC for reports, and handle queries and work extensively on client customizations. Also, handle the responsibilities of client proposals, report planning, report finalization, and execution

    Leave a Comment

    FAQs

    What is the current valuation of the Shale Gas Market as of 2024?

    The Shale Gas Market was valued at 64.81 USD Billion in 2024.

    What is the projected market valuation for the Shale Gas Market in 2035?

    The market is projected to reach a valuation of 121.79 USD Billion by 2035.

    What is the expected CAGR for the Shale Gas Market during the forecast period 2025 - 2035?

    The expected CAGR for the Shale Gas Market during the forecast period 2025 - 2035 is 5.9%.

    Which companies are considered key players in the Shale Gas Market?

    Key players in the Shale Gas Market include ExxonMobil, Chevron, ConocoPhillips, and EQT Corporation, among others.

    What are the primary applications of shale gas and their respective market values?

    In 2024, the primary applications included Power Generation at 20.0 USD Billion and Heating at 15.0 USD Billion, with projections indicating growth.

    How does the end-use segment of the Shale Gas Market break down in terms of valuation?

    The end-use segment in 2024 included Industrial at 24.0 USD Billion and Utilities at 19.21 USD Billion, with expected increases by 2035.

    What extraction methods are utilized in the Shale Gas Market and their market values?

    Extraction methods in 2024 included Hydraulic Fracturing at 32.41 USD Billion and Horizontal Drilling at 16.2 USD Billion, with anticipated growth.

    What is the market value for independent producers in the Shale Gas Market?

    Independent producers were valued at 12.96 USD Billion in 2024, with projections suggesting further growth by 2035.

    How do major oil and gas companies contribute to the Shale Gas Market?

    Major oil and gas companies were valued at 25.0 USD Billion in 2024, indicating a substantial role in the market's dynamics.

    What trends are expected in the Shale Gas Market by 2035?

    By 2035, trends suggest a continued increase in market valuation across all segments, driven by advancements in extraction techniques and rising demand.

    Market Summary

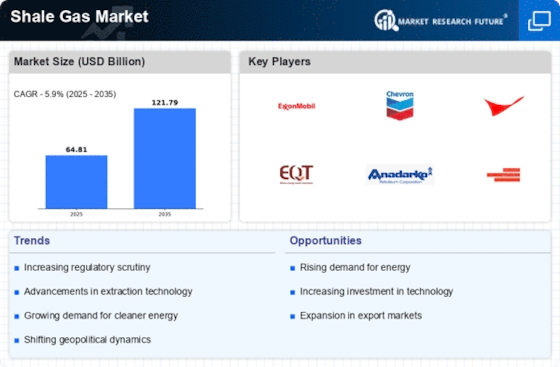
    As per MRFR analysis, the Shale Gas Market Size was estimated at 64.81 USD Billion in 2024. The Shale Gas industry is projected to grow from 68.64 USD Billion in 2025 to 121.79 USD Billion by 2035, exhibiting a compound annual growth rate (CAGR) of 5.9 during the forecast period 2025 - 2035.

    Key Market Trends & Highlights

    The Shale Gas Market is poised for growth driven by technological advancements and rising energy demand.

    • North America remains the largest market for shale gas, primarily due to its established infrastructure and technological expertise.
    • Asia-Pacific is emerging as the fastest-growing region, fueled by increasing energy needs and investments in shale gas exploration.
    • The power generation segment continues to dominate the market, while the chemical feedstock segment is experiencing rapid growth.
    • Rising energy demand and technological innovations are key drivers propelling the shale gas market forward.

    Market Size & Forecast

    2024 Market Size 64.81 (USD Billion)
    2035 Market Size 121.79 (USD Billion)
    CAGR (2025 - 2035) 5.9%
    Largest Regional Market Share in 2024 North America

    Major Players

    <p>ExxonMobil (US), Chevron (US), ConocoPhillips (US), EQT Corporation (US), Anadarko Petroleum (US), Devon Energy (US), Range Resources (US), Cabot Oil & Gas (US), Pioneer Natural Resources (US)</p>

    Market Trends

    The Shale Gas Market is currently experiencing a transformative phase characterized by evolving technologies and shifting regulatory landscapes. Innovations in extraction methods, particularly hydraulic fracturing and horizontal drilling, have enhanced the efficiency of gas recovery from shale formations. This has led to increased production levels, which in turn influences global energy dynamics. Furthermore, the growing emphasis on cleaner energy sources is prompting a reevaluation of shale gas's role in the energy mix, as it is often viewed as a bridge fuel towards more sustainable alternatives. In addition to technological advancements, geopolitical factors are also shaping the Shale Gas Market. Countries rich in shale resources are exploring ways to leverage these assets for energy independence and economic growth. However, environmental concerns and public opposition to fracking practices remain significant challenges. As the market evolves, stakeholders must navigate these complexities while seeking to balance economic benefits with environmental stewardship. The future of the Shale Gas Market appears to hinge on the ability to innovate responsibly and adapt to changing societal expectations.

    Technological Advancements

    Recent innovations in extraction techniques are revolutionizing the Shale Gas Market. Enhanced methods such as advanced hydraulic fracturing and improved drilling technologies are increasing recovery rates and reducing operational costs. These advancements not only boost production but also contribute to more efficient resource management.

    Regulatory Changes

    The Shale Gas Market is influenced by evolving regulations aimed at addressing environmental concerns. Governments are implementing stricter guidelines to ensure sustainable practices in extraction and production. This regulatory landscape is likely to shape investment strategies and operational practices within the industry.

    Market Dynamics and Geopolitical Factors

    Geopolitical considerations are playing a crucial role in the Shale Gas Market. Nations with abundant shale resources are seeking to enhance energy security and reduce dependence on imports. This drive for energy independence may lead to increased exploration and production activities, impacting global supply chains.

    Shale Gas Market Market Drivers

    Rising Energy Demand

    The Shale Gas Market is experiencing a surge in energy demand, driven by industrial growth and urbanization. As economies expand, the need for reliable and affordable energy sources becomes paramount. Shale gas, with its abundant reserves, offers a viable solution to meet this increasing demand. In 2025, the demand for natural gas is projected to rise by approximately 3.5 percent annually, indicating a robust market for shale gas. This trend is further supported by the transition towards cleaner energy sources, as shale gas emits fewer greenhouse gases compared to coal. Consequently, the Shale Gas Market is poised to benefit from this shift, as more countries seek to diversify their energy portfolios and reduce carbon footprints.

    Geopolitical Influences

    Geopolitical factors significantly impact the Shale Gas Market, as energy security becomes a focal point for many nations. Countries rich in shale gas reserves are strategically positioned to influence global energy dynamics. The ongoing shifts in trade policies and international relations can create both opportunities and challenges for the industry. For instance, nations seeking to reduce dependence on imported energy may invest heavily in domestic shale gas production. In 2025, it is expected that geopolitical tensions will continue to shape energy strategies, with countries prioritizing energy independence. This trend could lead to increased investments in the Shale Gas Market, as nations strive to secure their energy futures.

    Investment Opportunities

    The Shale Gas Market presents numerous investment opportunities, attracting both domestic and foreign investors. As the demand for natural gas rises, the potential for lucrative returns on investment becomes apparent. In 2025, the market is projected to grow at a compound annual growth rate of approximately 4 percent, driven by increasing consumption and technological advancements. Investors are particularly interested in regions with established shale formations, where production costs are lower and infrastructure is already in place. Furthermore, the ongoing development of new technologies may enhance profitability, making the Shale Gas Market an appealing prospect for investment. This influx of capital could further stimulate growth and innovation within the sector.

    Technological Innovations

    Technological advancements play a crucial role in the Shale Gas Market, enhancing extraction and production efficiency. Innovations such as hydraulic fracturing and horizontal drilling have revolutionized the way shale gas is harvested, significantly reducing costs and increasing output. In recent years, the average production per well has seen a notable increase, with some regions reporting up to 50 percent higher yields due to improved techniques. These advancements not only make shale gas more economically viable but also attract investments into the sector. As technology continues to evolve, the Shale Gas Market is likely to witness further enhancements in production capabilities, thereby solidifying its position in the energy landscape.

    Environmental Considerations

    The Shale Gas Market is increasingly influenced by environmental considerations, as stakeholders seek to balance energy needs with ecological impacts. The shift towards cleaner energy sources has prompted a reevaluation of shale gas's role in the energy mix. While shale gas is often touted for its lower emissions compared to coal, concerns regarding water usage and potential contamination persist. Regulatory bodies are now focusing on establishing stringent guidelines to mitigate these risks. In 2025, it is anticipated that the industry will adopt more sustainable practices, such as water recycling and reduced flaring, to address environmental concerns. This proactive approach may enhance the public perception of the Shale Gas Market, fostering greater acceptance and support.

    Market Segment Insights

    By Application: Power Generation (Largest) vs. Chemical Feedstock (Fastest-Growing)

    <p>The application segment of the shale gas market is characterized by its diverse usage, with power generation holding the largest share amongst various applications. This sector benefits from the growing shift toward cleaner energy sources, where shale gas serves as a viable alternative to coal. Following power generation, the chemical feedstock segment also holds significant share, owing to its utilization in producing various chemicals essential for industrial processes.</p>

    <p>Power Generation (Dominant) vs. Chemical Feedstock (Emerging)</p>

    <p>Power generation is a dominant force in the shale gas market, leveraging advancements in gas turbine technology and infrastructure improvements to effectively utilize natural gas for electricity generation. The inherent efficiency and lower emissions of gas-fired plants position power generation at the forefront of the energy transition. Conversely, the emerging chemical feedstock segment is gaining traction due to its critical role in supplying inputs for petrochemicals and fertilizers. The increasing demand for these products, driven by global population growth and urbanization, positions chemical feedstock as a vital component of the shale gas market, spurring investments and innovation in this sector.</p>

    By End Use: Residential (Largest) vs. Utilities (Fastest-Growing)

    <p>In the Shale Gas Market, the end-use segment is diverse, featuring residential, commercial, industrial, and utilities. Among these, the residential sector holds the largest market share, reflecting the growing trend of utilizing shale gas for heating, cooking, and other domestic needs. Utilities are rapidly gaining traction as a critical segment as they adopt natural gas solutions to transition towards cleaner energy sources. This duality enhances both stability and growth potential across the segment.</p>

    <p>Residential (Dominant) vs. Utilities (Emerging)</p>

    <p>The residential segment is characterized by its substantial demand for shale gas, driven by the need for efficient heating and cooking solutions. This segment benefits from increased consumer awareness and preference for cleaner energy options, leading to sustained growth. In contrast, the utilities segment is emerging as a key player, motivated by regulatory shifts toward green energy. Utilities are increasingly integrating shale gas into their energy mix, leveraging it as a bridge fuel to replace coal and oil. This transition aligns with global sustainability goals, positioning utilities as a fast-growing segment in the Shale Gas Market.</p>

    By Method of Extraction: Hydraulic Fracturing (Largest) vs. Horizontal Drilling (Fastest-Growing)

    <p>In the Shale Gas Market, the method of extraction plays a critical role in determining operational efficiency and yield. Hydraulic fracturing currently dominates the segment, holding the largest market share due to its effectiveness in enhancing gas flow from shale formations. Horizontal drilling is emerging as a significant player, increasingly capturing market attention due to its capacity to reach multiple resource zones and optimize production rates.</p>

    <p>Hydraulic Fracturing (Dominant) vs. Horizontal Drilling (Emerging)</p>

    <p>Hydraulic fracturing is the dominant method in the shale gas extraction market, characterized by its ability to fracture rock layers and release trapped gas. This technique leverages high-pressure fluid injection, allowing for significant extraction efficiency. Conversely, horizontal drilling represents an emerging trend, known for its adaptability and efficiency in reaching extensive gas reserves. As operators seek to maximize recovery rates and reduce costs, horizontal drilling's scalability and effectiveness make it an appealing choice, particularly in deeper shale formations where traditional vertical methods may fall short.</p>

    By Player Type: Independent Producers (Largest) vs. Major Oil and Gas Companies (Fastest-Growing)

    <p>The Shale Gas Market exhibits a dynamic landscape characterized by a diverse array of player types. 'Independent Producers' currently dominate the market share, leveraging their specialized approaches and adaptability to local conditions. Their focus on specific niches within shale plays allows for optimized operations and cost-effective exploration methods, solidifying their significant presence in the market. Conversely, 'Major Oil and Gas Companies' are rapidly expanding their footprint in the shale gas sector, capitalizing on technological advancements and economies of scale to enhance efficiency. This competitive growth strategy positions them as a compelling force within the market as more emphasis is placed on utilizing shale gas resources effectively. In terms of growth trends, independent producers are increasingly integrating innovative technologies, which enhance their extraction capabilities and efficiency, contributing to sustained competitive advantages. Meanwhile, the shift towards renewable energy sources is prompting major companies to diversify their portfolios, including substantial investments in shale gas ventures. This interplay between traditional and emerging player types reflects a broader trend toward market maturation, with collaborative efforts between independents and major firms likely driving further growth and innovation in the shale gas landscape.</p>

    <p>Independent Producers (Dominant) vs. Service Providers (Emerging)</p>

    <p>In the Shale Gas Market, 'Independent Producers' are well-established entities that prioritize flexible operations and local expertise, allowing them to capitalize on specific shale formations. They often adopt advanced technologies to maximize recovery rates while minimizing costs. Their proficiency in navigating regulatory frameworks and community relationships enables them to sustain operations efficiently, thus supporting their dominant position. In contrast, 'Service Providers' are emerging players who offer specialized support and solutions to production companies. As the demand for enhanced exploration and drilling technologies rises, service providers are stepping in to fill this gap. Their innovative approaches and collaboration with independent producers enhance operational efficiency and safety, thereby carving a sustainable niche for themselves in this rapidly evolving market.</p>

    Get more detailed insights about Shale Gas Market Research Report - Forecast till 2035

    Regional Insights

    North America : Shale Gas Powerhouse

    North America remains the largest market for shale gas, accounting for approximately 75% of global production. The region's growth is driven by technological advancements in hydraulic fracturing and horizontal drilling, alongside favorable regulatory frameworks that encourage investment. The U.S. leads this market, followed by Canada, which holds about 15% of the market share. The increasing demand for cleaner energy sources and the push for energy independence further bolster this sector. The competitive landscape is dominated by major players such as ExxonMobil, Chevron, and ConocoPhillips, which have established significant operations across key shale formations like the Permian Basin and Marcellus Shale. These companies are continuously investing in innovative technologies to enhance extraction efficiency and reduce environmental impact. The presence of a robust infrastructure and skilled workforce further supports the region's leading position in the shale gas market.

    Europe : Emerging Shale Gas Market

    Europe's shale gas market is gradually emerging, with countries like Poland and the UK showing significant potential. The region's market share is currently around 5%, but this is expected to grow as regulatory frameworks evolve to support exploration and production. The European Union's commitment to energy diversification and reducing reliance on imports serves as a catalyst for shale gas development. However, environmental concerns and public opposition pose challenges to rapid expansion. Leading countries in this sector include Poland, which has made strides in exploration, and the UK, where the government is exploring regulatory reforms to facilitate shale gas extraction. The competitive landscape is still developing, with several smaller companies and partnerships forming to navigate the regulatory environment. The presence of major oil and gas companies is also increasing as they seek to capitalize on the region's untapped resources.

    Asia-Pacific : Growing Interest in Shale Gas

    The Asia-Pacific region is witnessing a growing interest in shale gas, with countries like China and Australia leading the charge. Currently, the market share is approximately 10%, driven by the need for energy security and cleaner fuel alternatives. China's significant shale reserves and ongoing investments in extraction technologies are pivotal for future growth. Regulatory support is gradually improving, although challenges remain in terms of environmental regulations and public acceptance. China is the largest player in the region, with substantial investments in shale gas exploration, while Australia is also making strides in developing its shale resources. The competitive landscape includes both local and international companies, with key players looking to establish a foothold in this emerging market. The region's potential for shale gas development is significant, but it requires careful navigation of regulatory and environmental hurdles to realize its full potential.

    Middle East and Africa : Untapped Shale Gas Resources

    The Middle East and Africa region holds untapped shale gas resources, with countries like South Africa and Algeria showing promise. Currently, the market share is around 5%, but this is expected to increase as exploration efforts intensify. The region's energy diversification strategies and the need for sustainable energy sources are driving interest in shale gas development. However, regulatory frameworks are still in the early stages, which may hinder rapid growth. South Africa is emerging as a key player, with ongoing efforts to develop its shale gas potential, while Algeria is exploring its vast reserves. The competitive landscape is characterized by a mix of local and international companies looking to invest in exploration and production. The presence of established oil and gas firms can facilitate the development of infrastructure and technology needed to harness these resources effectively.

    Key Players and Competitive Insights

    The Shale Gas Market is currently characterized by a dynamic competitive landscape, driven by a confluence of technological advancements, regulatory shifts, and evolving consumer demands. Major players such as ExxonMobil (US), Chevron (US), and EQT Corporation (US) are strategically positioning themselves to capitalize on these growth drivers. ExxonMobil (US) has been focusing on enhancing its operational efficiency through digital transformation initiatives, while Chevron (US) emphasizes sustainable practices and carbon capture technologies. EQT Corporation (US), on the other hand, is concentrating on expanding its production capabilities in the Appalachian Basin, which is pivotal for its growth strategy. Collectively, these strategies not only enhance their competitive edge but also shape the overall market dynamics, fostering a landscape where innovation and sustainability are paramount.

    In terms of business tactics, companies are increasingly localizing their operations and optimizing supply chains to mitigate risks and enhance responsiveness to market fluctuations. The Shale Gas Market appears moderately fragmented, with a mix of large integrated companies and smaller independent operators. This structure allows for a diverse range of competitive strategies, where key players leverage their strengths to influence market trends and consumer preferences.

    In August 2025, ExxonMobil (US) announced a significant investment in a new digital platform aimed at optimizing its shale gas production processes. This initiative is expected to enhance operational efficiencies and reduce costs, thereby positioning ExxonMobil (US) as a leader in the digital transformation of the energy sector. The strategic importance of this move lies in its potential to streamline operations and improve decision-making through data analytics, which could yield substantial competitive advantages in the long run.

    Similarly, in September 2025, Chevron (US) unveiled a partnership with a leading technology firm to develop advanced carbon capture and storage solutions. This collaboration underscores Chevron's (US) commitment to sustainability and its proactive approach to addressing environmental concerns associated with shale gas extraction. The strategic implications of this partnership are profound, as it not only enhances Chevron's (US) sustainability profile but also positions the company favorably in a market increasingly driven by environmental considerations.

    In October 2025, EQT Corporation (US) launched a new initiative aimed at increasing its production capacity by 20% over the next two years, focusing on the Marcellus Shale region. This ambitious plan reflects EQT's (US) intent to solidify its market position and respond to the growing demand for natural gas. The strategic significance of this expansion is twofold: it not only aims to meet rising energy needs but also enhances EQT's (US) competitive stance against other major players in the region.

    As of October 2025, the Shale Gas Market is witnessing a shift towards digitalization, sustainability, and the integration of artificial intelligence in operational processes. Strategic alliances are increasingly shaping the competitive landscape, enabling companies to pool resources and expertise to tackle complex challenges. Looking ahead, competitive differentiation is likely to evolve from traditional price-based competition to a focus on innovation, technological advancements, and supply chain reliability. This transition suggests that companies that prioritize these elements will be better positioned to thrive in an increasingly competitive and environmentally conscious market.

    Key Companies in the Shale Gas Market market include

    Industry Developments

    The Shale Gas Market has seen significant developments recently, notably impacted by fluctuating energy prices and evolving policies surrounding energy independence. Companies such as ConocoPhillips and Devon Energy have reported increased production levels as a response to a surge in worldwide energy demand.

    In 2025, ExxonMobil implemented sophisticated drilling technologies to enhance the efficiency of shale gas extraction and reduce operational costs by approximately 12%, all while simultaneously minimizing its environmental impact.

    Aiming to reduce emissions by 15% through the implementation of healthier technologies and enhanced processes, Chevron initiated a 2025 initiative that concentrated on sustainable shale gas production.

    In 2025, Range Resources leveraged sensor technology to optimize operations and reduce disruption by approximately 10% by implementing a real-time monitoring system for wells.

    In 2025, Antero Resources implemented a novel water-treatment solution to improve the recycling of hydraulic fracturing water, resulting in a 20% increase in reuse efficiency.

    Future Outlook

    Shale Gas Market Future Outlook

    <p>The Shale Gas Market is projected to grow at a 5.9% CAGR from 2024 to 2035, driven by technological advancements, increasing energy demand, and environmental considerations.</p>

    New opportunities lie in:

    • <p>Investment in advanced hydraulic fracturing technologies</p>
    • <p>Development of integrated supply chain solutions</p>
    • <p>Expansion into emerging markets with untapped shale reserves</p>

    <p>By 2035, the Shale Gas Market is expected to solidify its position as a key energy source globally.</p>

    Market Segmentation

    Shale Gas Market End Use Outlook

    • Residential
    • Commercial
    • Industrial
    • Utilities

    Shale Gas Market Application Outlook

    • Power Generation
    • Heating
    • Chemical Feedstock
    • Transportation
    • Industrial Processes

    Shale Gas Market Player Type Outlook

    • Independent Producers
    • Major Oil and Gas Companies
    • Service Providers
    • Government Entities

    Shale Gas Market Method of Extraction Outlook

    • Hydraulic Fracturing
    • Horizontal Drilling
    • Vertical Drilling
    • Combination Techniques

    Report Scope

    MARKET SIZE 202464.81(USD Billion)
    MARKET SIZE 202568.64(USD Billion)
    MARKET SIZE 2035121.79(USD Billion)
    COMPOUND ANNUAL GROWTH RATE (CAGR)5.9% (2024 - 2035)
    REPORT COVERAGERevenue Forecast, Competitive Landscape, Growth Factors, and Trends
    BASE YEAR2024
    Market Forecast Period2025 - 2035
    Historical Data2019 - 2024
    Market Forecast UnitsUSD Billion
    Key Companies ProfiledMarket analysis in progress
    Segments CoveredMarket segmentation analysis in progress
    Key Market OpportunitiesAdvancements in extraction technologies enhance efficiency in the Shale Gas Market.
    Key Market DynamicsTechnological advancements in extraction methods are reshaping competitive dynamics within the Shale Gas Market.
    Countries CoveredNorth America, Europe, APAC, South America, MEA

    FAQs

    What is the current valuation of the Shale Gas Market as of 2024?

    The Shale Gas Market was valued at 64.81 USD Billion in 2024.

    What is the projected market valuation for the Shale Gas Market in 2035?

    The market is projected to reach a valuation of 121.79 USD Billion by 2035.

    What is the expected CAGR for the Shale Gas Market during the forecast period 2025 - 2035?

    The expected CAGR for the Shale Gas Market during the forecast period 2025 - 2035 is 5.9%.

    Which companies are considered key players in the Shale Gas Market?

    Key players in the Shale Gas Market include ExxonMobil, Chevron, ConocoPhillips, and EQT Corporation, among others.

    What are the primary applications of shale gas and their respective market values?

    In 2024, the primary applications included Power Generation at 20.0 USD Billion and Heating at 15.0 USD Billion, with projections indicating growth.

    How does the end-use segment of the Shale Gas Market break down in terms of valuation?

    The end-use segment in 2024 included Industrial at 24.0 USD Billion and Utilities at 19.21 USD Billion, with expected increases by 2035.

    What extraction methods are utilized in the Shale Gas Market and their market values?

    Extraction methods in 2024 included Hydraulic Fracturing at 32.41 USD Billion and Horizontal Drilling at 16.2 USD Billion, with anticipated growth.

    What is the market value for independent producers in the Shale Gas Market?

    Independent producers were valued at 12.96 USD Billion in 2024, with projections suggesting further growth by 2035.

    How do major oil and gas companies contribute to the Shale Gas Market?

    Major oil and gas companies were valued at 25.0 USD Billion in 2024, indicating a substantial role in the market's dynamics.

    What trends are expected in the Shale Gas Market by 2035?

    By 2035, trends suggest a continued increase in market valuation across all segments, driven by advancements in extraction techniques and rising demand.

    1. SECTION I: EXECUTIVE SUMMARY AND KEY HIGHLIGHTS
      1. | 1.1 EXECUTIVE SUMMARY
      2. | | 1.1.1 Market Overview
      3. | | 1.1.2 Key Findings
      4. | | 1.1.3 Market Segmentation
      5. | | 1.1.4 Competitive Landscape
      6. | | 1.1.5 Challenges and Opportunities
      7. | | 1.1.6 Future Outlook
    2. SECTION II: SCOPING, METHODOLOGY AND MARKET STRUCTURE
      1. | 2.1 MARKET INTRODUCTION
      2. | | 2.1.1 Definition
      3. | | 2.1.2 Scope of the study
      4. | | | 2.1.2.1 Research Objective
      5. | | | 2.1.2.2 Assumption
      6. | | | 2.1.2.3 Limitations
      7. | 2.2 RESEARCH METHODOLOGY
      8. | | 2.2.1 Overview
      9. | | 2.2.2 Data Mining
      10. | | 2.2.3 Secondary Research
      11. | | 2.2.4 Primary Research
      12. | | | 2.2.4.1 Primary Interviews and Information Gathering Process
      13. | | | 2.2.4.2 Breakdown of Primary Respondents
      14. | | 2.2.5 Forecasting Model
      15. | | 2.2.6 Market Size Estimation
      16. | | | 2.2.6.1 Bottom-Up Approach
      17. | | | 2.2.6.2 Top-Down Approach
      18. | | 2.2.7 Data Triangulation
      19. | | 2.2.8 Validation
    3. SECTION III: QUALITATIVE ANALYSIS
      1. | 3.1 MARKET DYNAMICS
      2. | | 3.1.1 Overview
      3. | | 3.1.2 Drivers
      4. | | 3.1.3 Restraints
      5. | | 3.1.4 Opportunities
      6. | 3.2 MARKET FACTOR ANALYSIS
      7. | | 3.2.1 Value chain Analysis
      8. | | 3.2.2 Porter's Five Forces Analysis
      9. | | | 3.2.2.1 Bargaining Power of Suppliers
      10. | | | 3.2.2.2 Bargaining Power of Buyers
      11. | | | 3.2.2.3 Threat of New Entrants
      12. | | | 3.2.2.4 Threat of Substitutes
      13. | | | 3.2.2.5 Intensity of Rivalry
      14. | | 3.2.3 COVID-19 Impact Analysis
      15. | | | 3.2.3.1 Market Impact Analysis
      16. | | | 3.2.3.2 Regional Impact
      17. | | | 3.2.3.3 Opportunity and Threat Analysis
    4. SECTION IV: QUANTITATIVE ANALYSIS
      1. | 4.1 Energy & Power, BY Application (USD Billion)
      2. | | 4.1.1 Power Generation
      3. | | 4.1.2 Heating
      4. | | 4.1.3 Chemical Feedstock
      5. | | 4.1.4 Transportation
      6. | | 4.1.5 Industrial Processes
      7. | 4.2 Energy & Power, BY End Use (USD Billion)
      8. | | 4.2.1 Residential
      9. | | 4.2.2 Commercial
      10. | | 4.2.3 Industrial
      11. | | 4.2.4 Utilities
      12. | 4.3 Energy & Power, BY Method of Extraction (USD Billion)
      13. | | 4.3.1 Hydraulic Fracturing
      14. | | 4.3.2 Horizontal Drilling
      15. | | 4.3.3 Vertical Drilling
      16. | | 4.3.4 Combination Techniques
      17. | 4.4 Energy & Power, BY Player Type (USD Billion)
      18. | | 4.4.1 Independent Producers
      19. | | 4.4.2 Major Oil and Gas Companies
      20. | | 4.4.3 Service Providers
      21. | | 4.4.4 Government Entities
      22. | 4.5 Energy & Power, BY Region (USD Billion)
      23. | | 4.5.1 North America
      24. | | | 4.5.1.1 US
      25. | | | 4.5.1.2 Canada
      26. | | 4.5.2 Europe
      27. | | | 4.5.2.1 Germany
      28. | | | 4.5.2.2 UK
      29. | | | 4.5.2.3 France
      30. | | | 4.5.2.4 Russia
      31. | | | 4.5.2.5 Italy
      32. | | | 4.5.2.6 Spain
      33. | | | 4.5.2.7 Rest of Europe
      34. | | 4.5.3 APAC
      35. | | | 4.5.3.1 China
      36. | | | 4.5.3.2 India
      37. | | | 4.5.3.3 Japan
      38. | | | 4.5.3.4 South Korea
      39. | | | 4.5.3.5 Malaysia
      40. | | | 4.5.3.6 Thailand
      41. | | | 4.5.3.7 Indonesia
      42. | | | 4.5.3.8 Rest of APAC
      43. | | 4.5.4 South America
      44. | | | 4.5.4.1 Brazil
      45. | | | 4.5.4.2 Mexico
      46. | | | 4.5.4.3 Argentina
      47. | | | 4.5.4.4 Rest of South America
      48. | | 4.5.5 MEA
      49. | | | 4.5.5.1 GCC Countries
      50. | | | 4.5.5.2 South Africa
      51. | | | 4.5.5.3 Rest of MEA
    5. SECTION V: COMPETITIVE ANALYSIS
      1. | 5.1 Competitive Landscape
      2. | | 5.1.1 Overview
      3. | | 5.1.2 Competitive Analysis
      4. | | 5.1.3 Market share Analysis
      5. | | 5.1.4 Major Growth Strategy in the Energy & Power
      6. | | 5.1.5 Competitive Benchmarking
      7. | | 5.1.6 Leading Players in Terms of Number of Developments in the Energy & Power
      8. | | 5.1.7 Key developments and growth strategies
      9. | | | 5.1.7.1 New Product Launch/Service Deployment
      10. | | | 5.1.7.2 Merger & Acquisitions
      11. | | | 5.1.7.3 Joint Ventures
      12. | | 5.1.8 Major Players Financial Matrix
      13. | | | 5.1.8.1 Sales and Operating Income
      14. | | | 5.1.8.2 Major Players R&D Expenditure. 2023
      15. | 5.2 Company Profiles
      16. | | 5.2.1 ExxonMobil (US)
      17. | | | 5.2.1.1 Financial Overview
      18. | | | 5.2.1.2 Products Offered
      19. | | | 5.2.1.3 Key Developments
      20. | | | 5.2.1.4 SWOT Analysis
      21. | | | 5.2.1.5 Key Strategies
      22. | | 5.2.2 Chevron (US)
      23. | | | 5.2.2.1 Financial Overview
      24. | | | 5.2.2.2 Products Offered
      25. | | | 5.2.2.3 Key Developments
      26. | | | 5.2.2.4 SWOT Analysis
      27. | | | 5.2.2.5 Key Strategies
      28. | | 5.2.3 ConocoPhillips (US)
      29. | | | 5.2.3.1 Financial Overview
      30. | | | 5.2.3.2 Products Offered
      31. | | | 5.2.3.3 Key Developments
      32. | | | 5.2.3.4 SWOT Analysis
      33. | | | 5.2.3.5 Key Strategies
      34. | | 5.2.4 EQT Corporation (US)
      35. | | | 5.2.4.1 Financial Overview
      36. | | | 5.2.4.2 Products Offered
      37. | | | 5.2.4.3 Key Developments
      38. | | | 5.2.4.4 SWOT Analysis
      39. | | | 5.2.4.5 Key Strategies
      40. | | 5.2.5 Anadarko Petroleum (US)
      41. | | | 5.2.5.1 Financial Overview
      42. | | | 5.2.5.2 Products Offered
      43. | | | 5.2.5.3 Key Developments
      44. | | | 5.2.5.4 SWOT Analysis
      45. | | | 5.2.5.5 Key Strategies
      46. | | 5.2.6 Devon Energy (US)
      47. | | | 5.2.6.1 Financial Overview
      48. | | | 5.2.6.2 Products Offered
      49. | | | 5.2.6.3 Key Developments
      50. | | | 5.2.6.4 SWOT Analysis
      51. | | | 5.2.6.5 Key Strategies
      52. | | 5.2.7 Range Resources (US)
      53. | | | 5.2.7.1 Financial Overview
      54. | | | 5.2.7.2 Products Offered
      55. | | | 5.2.7.3 Key Developments
      56. | | | 5.2.7.4 SWOT Analysis
      57. | | | 5.2.7.5 Key Strategies
      58. | | 5.2.8 Cabot Oil & Gas (US)
      59. | | | 5.2.8.1 Financial Overview
      60. | | | 5.2.8.2 Products Offered
      61. | | | 5.2.8.3 Key Developments
      62. | | | 5.2.8.4 SWOT Analysis
      63. | | | 5.2.8.5 Key Strategies
      64. | | 5.2.9 Pioneer Natural Resources (US)
      65. | | | 5.2.9.1 Financial Overview
      66. | | | 5.2.9.2 Products Offered
      67. | | | 5.2.9.3 Key Developments
      68. | | | 5.2.9.4 SWOT Analysis
      69. | | | 5.2.9.5 Key Strategies
      70. | 5.3 Appendix
      71. | | 5.3.1 References
      72. | | 5.3.2 Related Reports
    6. LIST OF FIGURES
      1. | 6.1 MARKET SYNOPSIS
      2. | 6.2 NORTH AMERICA MARKET ANALYSIS
      3. | 6.3 US MARKET ANALYSIS BY APPLICATION
      4. | 6.4 US MARKET ANALYSIS BY END USE
      5. | 6.5 US MARKET ANALYSIS BY METHOD OF EXTRACTION
      6. | 6.6 US MARKET ANALYSIS BY PLAYER TYPE
      7. | 6.7 CANADA MARKET ANALYSIS BY APPLICATION
      8. | 6.8 CANADA MARKET ANALYSIS BY END USE
      9. | 6.9 CANADA MARKET ANALYSIS BY METHOD OF EXTRACTION
      10. | 6.10 CANADA MARKET ANALYSIS BY PLAYER TYPE
      11. | 6.11 EUROPE MARKET ANALYSIS
      12. | 6.12 GERMANY MARKET ANALYSIS BY APPLICATION
      13. | 6.13 GERMANY MARKET ANALYSIS BY END USE
      14. | 6.14 GERMANY MARKET ANALYSIS BY METHOD OF EXTRACTION
      15. | 6.15 GERMANY MARKET ANALYSIS BY PLAYER TYPE
      16. | 6.16 UK MARKET ANALYSIS BY APPLICATION
      17. | 6.17 UK MARKET ANALYSIS BY END USE
      18. | 6.18 UK MARKET ANALYSIS BY METHOD OF EXTRACTION
      19. | 6.19 UK MARKET ANALYSIS BY PLAYER TYPE
      20. | 6.20 FRANCE MARKET ANALYSIS BY APPLICATION
      21. | 6.21 FRANCE MARKET ANALYSIS BY END USE
      22. | 6.22 FRANCE MARKET ANALYSIS BY METHOD OF EXTRACTION
      23. | 6.23 FRANCE MARKET ANALYSIS BY PLAYER TYPE
      24. | 6.24 RUSSIA MARKET ANALYSIS BY APPLICATION
      25. | 6.25 RUSSIA MARKET ANALYSIS BY END USE
      26. | 6.26 RUSSIA MARKET ANALYSIS BY METHOD OF EXTRACTION
      27. | 6.27 RUSSIA MARKET ANALYSIS BY PLAYER TYPE
      28. | 6.28 ITALY MARKET ANALYSIS BY APPLICATION
      29. | 6.29 ITALY MARKET ANALYSIS BY END USE
      30. | 6.30 ITALY MARKET ANALYSIS BY METHOD OF EXTRACTION
      31. | 6.31 ITALY MARKET ANALYSIS BY PLAYER TYPE
      32. | 6.32 SPAIN MARKET ANALYSIS BY APPLICATION
      33. | 6.33 SPAIN MARKET ANALYSIS BY END USE
      34. | 6.34 SPAIN MARKET ANALYSIS BY METHOD OF EXTRACTION
      35. | 6.35 SPAIN MARKET ANALYSIS BY PLAYER TYPE
      36. | 6.36 REST OF EUROPE MARKET ANALYSIS BY APPLICATION
      37. | 6.37 REST OF EUROPE MARKET ANALYSIS BY END USE
      38. | 6.38 REST OF EUROPE MARKET ANALYSIS BY METHOD OF EXTRACTION
      39. | 6.39 REST OF EUROPE MARKET ANALYSIS BY PLAYER TYPE
      40. | 6.40 APAC MARKET ANALYSIS
      41. | 6.41 CHINA MARKET ANALYSIS BY APPLICATION
      42. | 6.42 CHINA MARKET ANALYSIS BY END USE
      43. | 6.43 CHINA MARKET ANALYSIS BY METHOD OF EXTRACTION
      44. | 6.44 CHINA MARKET ANALYSIS BY PLAYER TYPE
      45. | 6.45 INDIA MARKET ANALYSIS BY APPLICATION
      46. | 6.46 INDIA MARKET ANALYSIS BY END USE
      47. | 6.47 INDIA MARKET ANALYSIS BY METHOD OF EXTRACTION
      48. | 6.48 INDIA MARKET ANALYSIS BY PLAYER TYPE
      49. | 6.49 JAPAN MARKET ANALYSIS BY APPLICATION
      50. | 6.50 JAPAN MARKET ANALYSIS BY END USE
      51. | 6.51 JAPAN MARKET ANALYSIS BY METHOD OF EXTRACTION
      52. | 6.52 JAPAN MARKET ANALYSIS BY PLAYER TYPE
      53. | 6.53 SOUTH KOREA MARKET ANALYSIS BY APPLICATION
      54. | 6.54 SOUTH KOREA MARKET ANALYSIS BY END USE
      55. | 6.55 SOUTH KOREA MARKET ANALYSIS BY METHOD OF EXTRACTION
      56. | 6.56 SOUTH KOREA MARKET ANALYSIS BY PLAYER TYPE
      57. | 6.57 MALAYSIA MARKET ANALYSIS BY APPLICATION
      58. | 6.58 MALAYSIA MARKET ANALYSIS BY END USE
      59. | 6.59 MALAYSIA MARKET ANALYSIS BY METHOD OF EXTRACTION
      60. | 6.60 MALAYSIA MARKET ANALYSIS BY PLAYER TYPE
      61. | 6.61 THAILAND MARKET ANALYSIS BY APPLICATION
      62. | 6.62 THAILAND MARKET ANALYSIS BY END USE
      63. | 6.63 THAILAND MARKET ANALYSIS BY METHOD OF EXTRACTION
      64. | 6.64 THAILAND MARKET ANALYSIS BY PLAYER TYPE
      65. | 6.65 INDONESIA MARKET ANALYSIS BY APPLICATION
      66. | 6.66 INDONESIA MARKET ANALYSIS BY END USE
      67. | 6.67 INDONESIA MARKET ANALYSIS BY METHOD OF EXTRACTION
      68. | 6.68 INDONESIA MARKET ANALYSIS BY PLAYER TYPE
      69. | 6.69 REST OF APAC MARKET ANALYSIS BY APPLICATION
      70. | 6.70 REST OF APAC MARKET ANALYSIS BY END USE
      71. | 6.71 REST OF APAC MARKET ANALYSIS BY METHOD OF EXTRACTION
      72. | 6.72 REST OF APAC MARKET ANALYSIS BY PLAYER TYPE
      73. | 6.73 SOUTH AMERICA MARKET ANALYSIS
      74. | 6.74 BRAZIL MARKET ANALYSIS BY APPLICATION
      75. | 6.75 BRAZIL MARKET ANALYSIS BY END USE
      76. | 6.76 BRAZIL MARKET ANALYSIS BY METHOD OF EXTRACTION
      77. | 6.77 BRAZIL MARKET ANALYSIS BY PLAYER TYPE
      78. | 6.78 MEXICO MARKET ANALYSIS BY APPLICATION
      79. | 6.79 MEXICO MARKET ANALYSIS BY END USE
      80. | 6.80 MEXICO MARKET ANALYSIS BY METHOD OF EXTRACTION
      81. | 6.81 MEXICO MARKET ANALYSIS BY PLAYER TYPE
      82. | 6.82 ARGENTINA MARKET ANALYSIS BY APPLICATION
      83. | 6.83 ARGENTINA MARKET ANALYSIS BY END USE
      84. | 6.84 ARGENTINA MARKET ANALYSIS BY METHOD OF EXTRACTION
      85. | 6.85 ARGENTINA MARKET ANALYSIS BY PLAYER TYPE
      86. | 6.86 REST OF SOUTH AMERICA MARKET ANALYSIS BY APPLICATION
      87. | 6.87 REST OF SOUTH AMERICA MARKET ANALYSIS BY END USE
      88. | 6.88 REST OF SOUTH AMERICA MARKET ANALYSIS BY METHOD OF EXTRACTION
      89. | 6.89 REST OF SOUTH AMERICA MARKET ANALYSIS BY PLAYER TYPE
      90. | 6.90 MEA MARKET ANALYSIS
      91. | 6.91 GCC COUNTRIES MARKET ANALYSIS BY APPLICATION
      92. | 6.92 GCC COUNTRIES MARKET ANALYSIS BY END USE
      93. | 6.93 GCC COUNTRIES MARKET ANALYSIS BY METHOD OF EXTRACTION
      94. | 6.94 GCC COUNTRIES MARKET ANALYSIS BY PLAYER TYPE
      95. | 6.95 SOUTH AFRICA MARKET ANALYSIS BY APPLICATION
      96. | 6.96 SOUTH AFRICA MARKET ANALYSIS BY END USE
      97. | 6.97 SOUTH AFRICA MARKET ANALYSIS BY METHOD OF EXTRACTION
      98. | 6.98 SOUTH AFRICA MARKET ANALYSIS BY PLAYER TYPE
      99. | 6.99 REST OF MEA MARKET ANALYSIS BY APPLICATION
      100. | 6.100 REST OF MEA MARKET ANALYSIS BY END USE
      101. | 6.101 REST OF MEA MARKET ANALYSIS BY METHOD OF EXTRACTION
      102. | 6.102 REST OF MEA MARKET ANALYSIS BY PLAYER TYPE
      103. | 6.103 KEY BUYING CRITERIA OF ENERGY & POWER
      104. | 6.104 RESEARCH PROCESS OF MRFR
      105. | 6.105 DRO ANALYSIS OF ENERGY & POWER
      106. | 6.106 DRIVERS IMPACT ANALYSIS: ENERGY & POWER
      107. | 6.107 RESTRAINTS IMPACT ANALYSIS: ENERGY & POWER
      108. | 6.108 SUPPLY / VALUE CHAIN: ENERGY & POWER
      109. | 6.109 ENERGY & POWER, BY APPLICATION, 2024 (% SHARE)
      110. | 6.110 ENERGY & POWER, BY APPLICATION, 2024 TO 2035 (USD Billion)
      111. | 6.111 ENERGY & POWER, BY END USE, 2024 (% SHARE)
      112. | 6.112 ENERGY & POWER, BY END USE, 2024 TO 2035 (USD Billion)
      113. | 6.113 ENERGY & POWER, BY METHOD OF EXTRACTION, 2024 (% SHARE)
      114. | 6.114 ENERGY & POWER, BY METHOD OF EXTRACTION, 2024 TO 2035 (USD Billion)
      115. | 6.115 ENERGY & POWER, BY PLAYER TYPE, 2024 (% SHARE)
      116. | 6.116 ENERGY & POWER, BY PLAYER TYPE, 2024 TO 2035 (USD Billion)
      117. | 6.117 BENCHMARKING OF MAJOR COMPETITORS
    7. LIST OF TABLES
      1. | 7.1 LIST OF ASSUMPTIONS
      2. | | 7.1.1
      3. | 7.2 North America MARKET SIZE ESTIMATES; FORECAST
      4. | | 7.2.1 BY APPLICATION, 2025-2035 (USD Billion)
      5. | | 7.2.2 BY END USE, 2025-2035 (USD Billion)
      6. | | 7.2.3 BY METHOD OF EXTRACTION, 2025-2035 (USD Billion)
      7. | | 7.2.4 BY PLAYER TYPE, 2025-2035 (USD Billion)
      8. | 7.3 US MARKET SIZE ESTIMATES; FORECAST
      9. | | 7.3.1 BY APPLICATION, 2025-2035 (USD Billion)
      10. | | 7.3.2 BY END USE, 2025-2035 (USD Billion)
      11. | | 7.3.3 BY METHOD OF EXTRACTION, 2025-2035 (USD Billion)
      12. | | 7.3.4 BY PLAYER TYPE, 2025-2035 (USD Billion)
      13. | 7.4 Canada MARKET SIZE ESTIMATES; FORECAST
      14. | | 7.4.1 BY APPLICATION, 2025-2035 (USD Billion)
      15. | | 7.4.2 BY END USE, 2025-2035 (USD Billion)
      16. | | 7.4.3 BY METHOD OF EXTRACTION, 2025-2035 (USD Billion)
      17. | | 7.4.4 BY PLAYER TYPE, 2025-2035 (USD Billion)
      18. | 7.5 Europe MARKET SIZE ESTIMATES; FORECAST
      19. | | 7.5.1 BY APPLICATION, 2025-2035 (USD Billion)
      20. | | 7.5.2 BY END USE, 2025-2035 (USD Billion)
      21. | | 7.5.3 BY METHOD OF EXTRACTION, 2025-2035 (USD Billion)
      22. | | 7.5.4 BY PLAYER TYPE, 2025-2035 (USD Billion)
      23. | 7.6 Germany MARKET SIZE ESTIMATES; FORECAST
      24. | | 7.6.1 BY APPLICATION, 2025-2035 (USD Billion)
      25. | | 7.6.2 BY END USE, 2025-2035 (USD Billion)
      26. | | 7.6.3 BY METHOD OF EXTRACTION, 2025-2035 (USD Billion)
      27. | | 7.6.4 BY PLAYER TYPE, 2025-2035 (USD Billion)
      28. | 7.7 UK MARKET SIZE ESTIMATES; FORECAST
      29. | | 7.7.1 BY APPLICATION, 2025-2035 (USD Billion)
      30. | | 7.7.2 BY END USE, 2025-2035 (USD Billion)
      31. | | 7.7.3 BY METHOD OF EXTRACTION, 2025-2035 (USD Billion)
      32. | | 7.7.4 BY PLAYER TYPE, 2025-2035 (USD Billion)
      33. | 7.8 France MARKET SIZE ESTIMATES; FORECAST
      34. | | 7.8.1 BY APPLICATION, 2025-2035 (USD Billion)
      35. | | 7.8.2 BY END USE, 2025-2035 (USD Billion)
      36. | | 7.8.3 BY METHOD OF EXTRACTION, 2025-2035 (USD Billion)
      37. | | 7.8.4 BY PLAYER TYPE, 2025-2035 (USD Billion)
      38. | 7.9 Russia MARKET SIZE ESTIMATES; FORECAST
      39. | | 7.9.1 BY APPLICATION, 2025-2035 (USD Billion)
      40. | | 7.9.2 BY END USE, 2025-2035 (USD Billion)
      41. | | 7.9.3 BY METHOD OF EXTRACTION, 2025-2035 (USD Billion)
      42. | | 7.9.4 BY PLAYER TYPE, 2025-2035 (USD Billion)
      43. | 7.10 Italy MARKET SIZE ESTIMATES; FORECAST
      44. | | 7.10.1 BY APPLICATION, 2025-2035 (USD Billion)
      45. | | 7.10.2 BY END USE, 2025-2035 (USD Billion)
      46. | | 7.10.3 BY METHOD OF EXTRACTION, 2025-2035 (USD Billion)
      47. | | 7.10.4 BY PLAYER TYPE, 2025-2035 (USD Billion)
      48. | 7.11 Spain MARKET SIZE ESTIMATES; FORECAST
      49. | | 7.11.1 BY APPLICATION, 2025-2035 (USD Billion)
      50. | | 7.11.2 BY END USE, 2025-2035 (USD Billion)
      51. | | 7.11.3 BY METHOD OF EXTRACTION, 2025-2035 (USD Billion)
      52. | | 7.11.4 BY PLAYER TYPE, 2025-2035 (USD Billion)
      53. | 7.12 Rest of Europe MARKET SIZE ESTIMATES; FORECAST
      54. | | 7.12.1 BY APPLICATION, 2025-2035 (USD Billion)
      55. | | 7.12.2 BY END USE, 2025-2035 (USD Billion)
      56. | | 7.12.3 BY METHOD OF EXTRACTION, 2025-2035 (USD Billion)
      57. | | 7.12.4 BY PLAYER TYPE, 2025-2035 (USD Billion)
      58. | 7.13 APAC MARKET SIZE ESTIMATES; FORECAST
      59. | | 7.13.1 BY APPLICATION, 2025-2035 (USD Billion)
      60. | | 7.13.2 BY END USE, 2025-2035 (USD Billion)
      61. | | 7.13.3 BY METHOD OF EXTRACTION, 2025-2035 (USD Billion)
      62. | | 7.13.4 BY PLAYER TYPE, 2025-2035 (USD Billion)
      63. | 7.14 China MARKET SIZE ESTIMATES; FORECAST
      64. | | 7.14.1 BY APPLICATION, 2025-2035 (USD Billion)
      65. | | 7.14.2 BY END USE, 2025-2035 (USD Billion)
      66. | | 7.14.3 BY METHOD OF EXTRACTION, 2025-2035 (USD Billion)
      67. | | 7.14.4 BY PLAYER TYPE, 2025-2035 (USD Billion)
      68. | 7.15 India MARKET SIZE ESTIMATES; FORECAST
      69. | | 7.15.1 BY APPLICATION, 2025-2035 (USD Billion)
      70. | | 7.15.2 BY END USE, 2025-2035 (USD Billion)
      71. | | 7.15.3 BY METHOD OF EXTRACTION, 2025-2035 (USD Billion)
      72. | | 7.15.4 BY PLAYER TYPE, 2025-2035 (USD Billion)
      73. | 7.16 Japan MARKET SIZE ESTIMATES; FORECAST
      74. | | 7.16.1 BY APPLICATION, 2025-2035 (USD Billion)
      75. | | 7.16.2 BY END USE, 2025-2035 (USD Billion)
      76. | | 7.16.3 BY METHOD OF EXTRACTION, 2025-2035 (USD Billion)
      77. | | 7.16.4 BY PLAYER TYPE, 2025-2035 (USD Billion)
      78. | 7.17 South Korea MARKET SIZE ESTIMATES; FORECAST
      79. | | 7.17.1 BY APPLICATION, 2025-2035 (USD Billion)
      80. | | 7.17.2 BY END USE, 2025-2035 (USD Billion)
      81. | | 7.17.3 BY METHOD OF EXTRACTION, 2025-2035 (USD Billion)
      82. | | 7.17.4 BY PLAYER TYPE, 2025-2035 (USD Billion)
      83. | 7.18 Malaysia MARKET SIZE ESTIMATES; FORECAST
      84. | | 7.18.1 BY APPLICATION, 2025-2035 (USD Billion)
      85. | | 7.18.2 BY END USE, 2025-2035 (USD Billion)
      86. | | 7.18.3 BY METHOD OF EXTRACTION, 2025-2035 (USD Billion)
      87. | | 7.18.4 BY PLAYER TYPE, 2025-2035 (USD Billion)
      88. | 7.19 Thailand MARKET SIZE ESTIMATES; FORECAST
      89. | | 7.19.1 BY APPLICATION, 2025-2035 (USD Billion)
      90. | | 7.19.2 BY END USE, 2025-2035 (USD Billion)
      91. | | 7.19.3 BY METHOD OF EXTRACTION, 2025-2035 (USD Billion)
      92. | | 7.19.4 BY PLAYER TYPE, 2025-2035 (USD Billion)
      93. | 7.20 Indonesia MARKET SIZE ESTIMATES; FORECAST
      94. | | 7.20.1 BY APPLICATION, 2025-2035 (USD Billion)
      95. | | 7.20.2 BY END USE, 2025-2035 (USD Billion)
      96. | | 7.20.3 BY METHOD OF EXTRACTION, 2025-2035 (USD Billion)
      97. | | 7.20.4 BY PLAYER TYPE, 2025-2035 (USD Billion)
      98. | 7.21 Rest of APAC MARKET SIZE ESTIMATES; FORECAST
      99. | | 7.21.1 BY APPLICATION, 2025-2035 (USD Billion)
      100. | | 7.21.2 BY END USE, 2025-2035 (USD Billion)
      101. | | 7.21.3 BY METHOD OF EXTRACTION, 2025-2035 (USD Billion)
      102. | | 7.21.4 BY PLAYER TYPE, 2025-2035 (USD Billion)
      103. | 7.22 South America MARKET SIZE ESTIMATES; FORECAST
      104. | | 7.22.1 BY APPLICATION, 2025-2035 (USD Billion)
      105. | | 7.22.2 BY END USE, 2025-2035 (USD Billion)
      106. | | 7.22.3 BY METHOD OF EXTRACTION, 2025-2035 (USD Billion)
      107. | | 7.22.4 BY PLAYER TYPE, 2025-2035 (USD Billion)
      108. | 7.23 Brazil MARKET SIZE ESTIMATES; FORECAST
      109. | | 7.23.1 BY APPLICATION, 2025-2035 (USD Billion)
      110. | | 7.23.2 BY END USE, 2025-2035 (USD Billion)
      111. | | 7.23.3 BY METHOD OF EXTRACTION, 2025-2035 (USD Billion)
      112. | | 7.23.4 BY PLAYER TYPE, 2025-2035 (USD Billion)
      113. | 7.24 Mexico MARKET SIZE ESTIMATES; FORECAST
      114. | | 7.24.1 BY APPLICATION, 2025-2035 (USD Billion)
      115. | | 7.24.2 BY END USE, 2025-2035 (USD Billion)
      116. | | 7.24.3 BY METHOD OF EXTRACTION, 2025-2035 (USD Billion)
      117. | | 7.24.4 BY PLAYER TYPE, 2025-2035 (USD Billion)
      118. | 7.25 Argentina MARKET SIZE ESTIMATES; FORECAST
      119. | | 7.25.1 BY APPLICATION, 2025-2035 (USD Billion)
      120. | | 7.25.2 BY END USE, 2025-2035 (USD Billion)
      121. | | 7.25.3 BY METHOD OF EXTRACTION, 2025-2035 (USD Billion)
      122. | | 7.25.4 BY PLAYER TYPE, 2025-2035 (USD Billion)
      123. | 7.26 Rest of South America MARKET SIZE ESTIMATES; FORECAST
      124. | | 7.26.1 BY APPLICATION, 2025-2035 (USD Billion)
      125. | | 7.26.2 BY END USE, 2025-2035 (USD Billion)
      126. | | 7.26.3 BY METHOD OF EXTRACTION, 2025-2035 (USD Billion)
      127. | | 7.26.4 BY PLAYER TYPE, 2025-2035 (USD Billion)
      128. | 7.27 MEA MARKET SIZE ESTIMATES; FORECAST
      129. | | 7.27.1 BY APPLICATION, 2025-2035 (USD Billion)
      130. | | 7.27.2 BY END USE, 2025-2035 (USD Billion)
      131. | | 7.27.3 BY METHOD OF EXTRACTION, 2025-2035 (USD Billion)
      132. | | 7.27.4 BY PLAYER TYPE, 2025-2035 (USD Billion)
      133. | 7.28 GCC Countries MARKET SIZE ESTIMATES; FORECAST
      134. | | 7.28.1 BY APPLICATION, 2025-2035 (USD Billion)
      135. | | 7.28.2 BY END USE, 2025-2035 (USD Billion)
      136. | | 7.28.3 BY METHOD OF EXTRACTION, 2025-2035 (USD Billion)
      137. | | 7.28.4 BY PLAYER TYPE, 2025-2035 (USD Billion)
      138. | 7.29 South Africa MARKET SIZE ESTIMATES; FORECAST
      139. | | 7.29.1 BY APPLICATION, 2025-2035 (USD Billion)
      140. | | 7.29.2 BY END USE, 2025-2035 (USD Billion)
      141. | | 7.29.3 BY METHOD OF EXTRACTION, 2025-2035 (USD Billion)
      142. | | 7.29.4 BY PLAYER TYPE, 2025-2035 (USD Billion)
      143. | 7.30 Rest of MEA MARKET SIZE ESTIMATES; FORECAST
      144. | | 7.30.1 BY APPLICATION, 2025-2035 (USD Billion)
      145. | | 7.30.2 BY END USE, 2025-2035 (USD Billion)
      146. | | 7.30.3 BY METHOD OF EXTRACTION, 2025-2035 (USD Billion)
      147. | | 7.30.4 BY PLAYER TYPE, 2025-2035 (USD Billion)
      148. | 7.31 PRODUCT LAUNCH/PRODUCT DEVELOPMENT/APPROVAL
      149. | | 7.31.1
      150. | 7.32 ACQUISITION/PARTNERSHIP
      151. | | 7.32.1

    Shale Gas Market Segmentation

    • Shale Gas Market By Application (USD Billion, 2019-2035) 
      • Power Generation
      • Heating
      • Chemical Feedstock
      • Transportation
      • Industrial Processes


    • Shale Gas Market By End Use (USD Billion, 2019-2035) 
      • Residential
      • Commercial
      • Industrial
      • Utilities


    • Shale Gas Market By Method of Extraction (USD Billion, 2019-2035) 
      • Hydraulic Fracturing
      • Horizontal Drilling
      • Vertical Drilling
      • Combination Techniques


    • Shale Gas Market By Market Player Type (USD Billion, 2019-2035) 
      • Independent Producers
      • Major Oil and Gas Companies
      • Service Providers
      • Government Entities


    • Shale Gas Market By Regional (USD Billion, 2019-2035) 
      • North America
      • Europe
      • South America
      • Asia Pacific
      • Middle East and Africa


    Shale Gas Market Regional Outlook (USD Billion, 2019-2035)


    • North America Outlook (USD Billion, 2019-2035)
      • North America Shale Gas Market by Application Type
        • Power Generation
        • Heating
        • Chemical Feedstock
        • Transportation
        • Industrial Processes
      • North America Shale Gas Market by End Use Type
        • Residential
        • Commercial
        • Industrial
        • Utilities
      • North America Shale Gas Market by Method of Extraction Type
        • Hydraulic Fracturing
        • Horizontal Drilling
        • Vertical Drilling
        • Combination Techniques
      • North America Shale Gas Market by Market Player Type
        • Independent Producers
        • Major Oil and Gas Companies
        • Service Providers
        • Government Entities
      • North America Shale Gas Market by Regional Type
        • US
        • Canada
      • US Outlook (USD Billion, 2019-2035)
      • US Shale Gas Market by Application Type
        • Power Generation
        • Heating
        • Chemical Feedstock
        • Transportation
        • Industrial Processes
      • US Shale Gas Market by End Use Type
        • Residential
        • Commercial
        • Industrial
        • Utilities
      • US Shale Gas Market by Method of Extraction Type
        • Hydraulic Fracturing
        • Horizontal Drilling
        • Vertical Drilling
        • Combination Techniques
      • US Shale Gas Market by Market Player Type
        • Independent Producers
        • Major Oil and Gas Companies
        • Service Providers
        • Government Entities
      • CANADA Outlook (USD Billion, 2019-2035)
      • CANADA Shale Gas Market by Application Type
        • Power Generation
        • Heating
        • Chemical Feedstock
        • Transportation
        • Industrial Processes
      • CANADA Shale Gas Market by End Use Type
        • Residential
        • Commercial
        • Industrial
        • Utilities
      • CANADA Shale Gas Market by Method of Extraction Type
        • Hydraulic Fracturing
        • Horizontal Drilling
        • Vertical Drilling
        • Combination Techniques
      • CANADA Shale Gas Market by Market Player Type
        • Independent Producers
        • Major Oil and Gas Companies
        • Service Providers
        • Government Entities
      • Europe Outlook (USD Billion, 2019-2035)
        • Europe Shale Gas Market by Application Type
          • Power Generation
          • Heating
          • Chemical Feedstock
          • Transportation
          • Industrial Processes
        • Europe Shale Gas Market by End Use Type
          • Residential
          • Commercial
          • Industrial
          • Utilities
        • Europe Shale Gas Market by Method of Extraction Type
          • Hydraulic Fracturing
          • Horizontal Drilling
          • Vertical Drilling
          • Combination Techniques
        • Europe Shale Gas Market by Market Player Type
          • Independent Producers
          • Major Oil and Gas Companies
          • Service Providers
          • Government Entities
        • Europe Shale Gas Market by Regional Type
          • Germany
          • UK
          • France
          • Russia
          • Italy
          • Spain
          • Rest of Europe
        • GERMANY Outlook (USD Billion, 2019-2035)
        • GERMANY Shale Gas Market by Application Type
          • Power Generation
          • Heating
          • Chemical Feedstock
          • Transportation
          • Industrial Processes
        • GERMANY Shale Gas Market by End Use Type
          • Residential
          • Commercial
          • Industrial
          • Utilities
        • GERMANY Shale Gas Market by Method of Extraction Type
          • Hydraulic Fracturing
          • Horizontal Drilling
          • Vertical Drilling
          • Combination Techniques
        • GERMANY Shale Gas Market by Market Player Type
          • Independent Producers
          • Major Oil and Gas Companies
          • Service Providers
          • Government Entities
        • UK Outlook (USD Billion, 2019-2035)
        • UK Shale Gas Market by Application Type
          • Power Generation
          • Heating
          • Chemical Feedstock
          • Transportation
          • Industrial Processes
        • UK Shale Gas Market by End Use Type
          • Residential
          • Commercial
          • Industrial
          • Utilities
        • UK Shale Gas Market by Method of Extraction Type
          • Hydraulic Fracturing
          • Horizontal Drilling
          • Vertical Drilling
          • Combination Techniques
        • UK Shale Gas Market by Market Player Type
          • Independent Producers
          • Major Oil and Gas Companies
          • Service Providers
          • Government Entities
        • FRANCE Outlook (USD Billion, 2019-2035)
        • FRANCE Shale Gas Market by Application Type
          • Power Generation
          • Heating
          • Chemical Feedstock
          • Transportation
          • Industrial Processes
        • FRANCE Shale Gas Market by End Use Type
          • Residential
          • Commercial
          • Industrial
          • Utilities
        • FRANCE Shale Gas Market by Method of Extraction Type
          • Hydraulic Fracturing
          • Horizontal Drilling
          • Vertical Drilling
          • Combination Techniques
        • FRANCE Shale Gas Market by Market Player Type
          • Independent Producers
          • Major Oil and Gas Companies
          • Service Providers
          • Government Entities
        • RUSSIA Outlook (USD Billion, 2019-2035)
        • RUSSIA Shale Gas Market by Application Type
          • Power Generation
          • Heating
          • Chemical Feedstock
          • Transportation
          • Industrial Processes
        • RUSSIA Shale Gas Market by End Use Type
          • Residential
          • Commercial
          • Industrial
          • Utilities
        • RUSSIA Shale Gas Market by Method of Extraction Type
          • Hydraulic Fracturing
          • Horizontal Drilling
          • Vertical Drilling
          • Combination Techniques
        • RUSSIA Shale Gas Market by Market Player Type
          • Independent Producers
          • Major Oil and Gas Companies
          • Service Providers
          • Government Entities
        • ITALY Outlook (USD Billion, 2019-2035)
        • ITALY Shale Gas Market by Application Type
          • Power Generation
          • Heating
          • Chemical Feedstock
          • Transportation
          • Industrial Processes
        • ITALY Shale Gas Market by End Use Type
          • Residential
          • Commercial
          • Industrial
          • Utilities
        • ITALY Shale Gas Market by Method of Extraction Type
          • Hydraulic Fracturing
          • Horizontal Drilling
          • Vertical Drilling
          • Combination Techniques
        • ITALY Shale Gas Market by Market Player Type
          • Independent Producers
          • Major Oil and Gas Companies
          • Service Providers
          • Government Entities
        • SPAIN Outlook (USD Billion, 2019-2035)
        • SPAIN Shale Gas Market by Application Type
          • Power Generation
          • Heating
          • Chemical Feedstock
          • Transportation
          • Industrial Processes
        • SPAIN Shale Gas Market by End Use Type
          • Residential
          • Commercial
          • Industrial
          • Utilities
        • SPAIN Shale Gas Market by Method of Extraction Type
          • Hydraulic Fracturing
          • Horizontal Drilling
          • Vertical Drilling
          • Combination Techniques
        • SPAIN Shale Gas Market by Market Player Type
          • Independent Producers
          • Major Oil and Gas Companies
          • Service Providers
          • Government Entities
        • REST OF EUROPE Outlook (USD Billion, 2019-2035)
        • REST OF EUROPE Shale Gas Market by Application Type
          • Power Generation
          • Heating
          • Chemical Feedstock
          • Transportation
          • Industrial Processes
        • REST OF EUROPE Shale Gas Market by End Use Type
          • Residential
          • Commercial
          • Industrial
          • Utilities
        • REST OF EUROPE Shale Gas Market by Method of Extraction Type
          • Hydraulic Fracturing
          • Horizontal Drilling
          • Vertical Drilling
          • Combination Techniques
        • REST OF EUROPE Shale Gas Market by Market Player Type
          • Independent Producers
          • Major Oil and Gas Companies
          • Service Providers
          • Government Entities
        • APAC Outlook (USD Billion, 2019-2035)
          • APAC Shale Gas Market by Application Type
            • Power Generation
            • Heating
            • Chemical Feedstock
            • Transportation
            • Industrial Processes
          • APAC Shale Gas Market by End Use Type
            • Residential
            • Commercial
            • Industrial
            • Utilities
          • APAC Shale Gas Market by Method of Extraction Type
            • Hydraulic Fracturing
            • Horizontal Drilling
            • Vertical Drilling
            • Combination Techniques
          • APAC Shale Gas Market by Market Player Type
            • Independent Producers
            • Major Oil and Gas Companies
            • Service Providers
            • Government Entities
          • APAC Shale Gas Market by Regional Type
            • China
            • India
            • Japan
            • South Korea
            • Malaysia
            • Thailand
            • Indonesia
            • Rest of APAC
          • CHINA Outlook (USD Billion, 2019-2035)
          • CHINA Shale Gas Market by Application Type
            • Power Generation
            • Heating
            • Chemical Feedstock
            • Transportation
            • Industrial Processes
          • CHINA Shale Gas Market by End Use Type
            • Residential
            • Commercial
            • Industrial
            • Utilities
          • CHINA Shale Gas Market by Method of Extraction Type
            • Hydraulic Fracturing
            • Horizontal Drilling
            • Vertical Drilling
            • Combination Techniques
          • CHINA Shale Gas Market by Market Player Type
            • Independent Producers
            • Major Oil and Gas Companies
            • Service Providers
            • Government Entities
          • INDIA Outlook (USD Billion, 2019-2035)
          • INDIA Shale Gas Market by Application Type
            • Power Generation
            • Heating
            • Chemical Feedstock
            • Transportation
            • Industrial Processes
          • INDIA Shale Gas Market by End Use Type
            • Residential
            • Commercial
            • Industrial
            • Utilities
          • INDIA Shale Gas Market by Method of Extraction Type
            • Hydraulic Fracturing
            • Horizontal Drilling
            • Vertical Drilling
            • Combination Techniques
          • INDIA Shale Gas Market by Market Player Type
            • Independent Producers
            • Major Oil and Gas Companies
            • Service Providers
            • Government Entities
          • JAPAN Outlook (USD Billion, 2019-2035)
          • JAPAN Shale Gas Market by Application Type
            • Power Generation
            • Heating
            • Chemical Feedstock
            • Transportation
            • Industrial Processes
          • JAPAN Shale Gas Market by End Use Type
            • Residential
            • Commercial
            • Industrial
            • Utilities
          • JAPAN Shale Gas Market by Method of Extraction Type
            • Hydraulic Fracturing
            • Horizontal Drilling
            • Vertical Drilling
            • Combination Techniques
          • JAPAN Shale Gas Market by Market Player Type
            • Independent Producers
            • Major Oil and Gas Companies
            • Service Providers
            • Government Entities
          • SOUTH KOREA Outlook (USD Billion, 2019-2035)
          • SOUTH KOREA Shale Gas Market by Application Type
            • Power Generation
            • Heating
            • Chemical Feedstock
            • Transportation
            • Industrial Processes
          • SOUTH KOREA Shale Gas Market by End Use Type
            • Residential
            • Commercial
            • Industrial
            • Utilities
          • SOUTH KOREA Shale Gas Market by Method of Extraction Type
            • Hydraulic Fracturing
            • Horizontal Drilling
            • Vertical Drilling
            • Combination Techniques
          • SOUTH KOREA Shale Gas Market by Market Player Type
            • Independent Producers
            • Major Oil and Gas Companies
            • Service Providers
            • Government Entities
          • MALAYSIA Outlook (USD Billion, 2019-2035)
          • MALAYSIA Shale Gas Market by Application Type
            • Power Generation
            • Heating
            • Chemical Feedstock
            • Transportation
            • Industrial Processes
          • MALAYSIA Shale Gas Market by End Use Type
            • Residential
            • Commercial
            • Industrial
            • Utilities
          • MALAYSIA Shale Gas Market by Method of Extraction Type
            • Hydraulic Fracturing
            • Horizontal Drilling
            • Vertical Drilling
            • Combination Techniques
          • MALAYSIA Shale Gas Market by Market Player Type
            • Independent Producers
            • Major Oil and Gas Companies
            • Service Providers
            • Government Entities
          • THAILAND Outlook (USD Billion, 2019-2035)
          • THAILAND Shale Gas Market by Application Type
            • Power Generation
            • Heating
            • Chemical Feedstock
            • Transportation
            • Industrial Processes
          • THAILAND Shale Gas Market by End Use Type
            • Residential
            • Commercial
            • Industrial
            • Utilities
          • THAILAND Shale Gas Market by Method of Extraction Type
            • Hydraulic Fracturing
            • Horizontal Drilling
            • Vertical Drilling
            • Combination Techniques
          • THAILAND Shale Gas Market by Market Player Type
            • Independent Producers
            • Major Oil and Gas Companies
            • Service Providers
            • Government Entities
          • INDONESIA Outlook (USD Billion, 2019-2035)
          • INDONESIA Shale Gas Market by Application Type
            • Power Generation
            • Heating
            • Chemical Feedstock
            • Transportation
            • Industrial Processes
          • INDONESIA Shale Gas Market by End Use Type
            • Residential
            • Commercial
            • Industrial
            • Utilities
          • INDONESIA Shale Gas Market by Method of Extraction Type
            • Hydraulic Fracturing
            • Horizontal Drilling
            • Vertical Drilling
            • Combination Techniques
          • INDONESIA Shale Gas Market by Market Player Type
            • Independent Producers
            • Major Oil and Gas Companies
            • Service Providers
            • Government Entities
          • REST OF APAC Outlook (USD Billion, 2019-2035)
          • REST OF APAC Shale Gas Market by Application Type
            • Power Generation
            • Heating
            • Chemical Feedstock
            • Transportation
            • Industrial Processes
          • REST OF APAC Shale Gas Market by End Use Type
            • Residential
            • Commercial
            • Industrial
            • Utilities
          • REST OF APAC Shale Gas Market by Method of Extraction Type
            • Hydraulic Fracturing
            • Horizontal Drilling
            • Vertical Drilling
            • Combination Techniques
          • REST OF APAC Shale Gas Market by Market Player Type
            • Independent Producers
            • Major Oil and Gas Companies
            • Service Providers
            • Government Entities
          • South America Outlook (USD Billion, 2019-2035)
            • South America Shale Gas Market by Application Type
              • Power Generation
              • Heating
              • Chemical Feedstock
              • Transportation
              • Industrial Processes
            • South America Shale Gas Market by End Use Type
              • Residential
              • Commercial
              • Industrial
              • Utilities
            • South America Shale Gas Market by Method of Extraction Type
              • Hydraulic Fracturing
              • Horizontal Drilling
              • Vertical Drilling
              • Combination Techniques
            • South America Shale Gas Market by Market Player Type
              • Independent Producers
              • Major Oil and Gas Companies
              • Service Providers
              • Government Entities
            • South America Shale Gas Market by Regional Type
              • Brazil
              • Mexico
              • Argentina
              • Rest of South America
            • BRAZIL Outlook (USD Billion, 2019-2035)
            • BRAZIL Shale Gas Market by Application Type
              • Power Generation
              • Heating
              • Chemical Feedstock
              • Transportation
              • Industrial Processes
            • BRAZIL Shale Gas Market by End Use Type
              • Residential
              • Commercial
              • Industrial
              • Utilities
            • BRAZIL Shale Gas Market by Method of Extraction Type
              • Hydraulic Fracturing
              • Horizontal Drilling
              • Vertical Drilling
              • Combination Techniques
            • BRAZIL Shale Gas Market by Market Player Type
              • Independent Producers
              • Major Oil and Gas Companies
              • Service Providers
              • Government Entities
            • MEXICO Outlook (USD Billion, 2019-2035)
            • MEXICO Shale Gas Market by Application Type
              • Power Generation
              • Heating
              • Chemical Feedstock
              • Transportation
              • Industrial Processes
            • MEXICO Shale Gas Market by End Use Type
              • Residential
              • Commercial
              • Industrial
              • Utilities
            • MEXICO Shale Gas Market by Method of Extraction Type
              • Hydraulic Fracturing
              • Horizontal Drilling
              • Vertical Drilling
              • Combination Techniques
            • MEXICO Shale Gas Market by Market Player Type
              • Independent Producers
              • Major Oil and Gas Companies
              • Service Providers
              • Government Entities
            • ARGENTINA Outlook (USD Billion, 2019-2035)
            • ARGENTINA Shale Gas Market by Application Type
              • Power Generation
              • Heating
              • Chemical Feedstock
              • Transportation
              • Industrial Processes
            • ARGENTINA Shale Gas Market by End Use Type
              • Residential
              • Commercial
              • Industrial
              • Utilities
            • ARGENTINA Shale Gas Market by Method of Extraction Type
              • Hydraulic Fracturing
              • Horizontal Drilling
              • Vertical Drilling
              • Combination Techniques
            • ARGENTINA Shale Gas Market by Market Player Type
              • Independent Producers
              • Major Oil and Gas Companies
              • Service Providers
              • Government Entities
            • REST OF SOUTH AMERICA Outlook (USD Billion, 2019-2035)
            • REST OF SOUTH AMERICA Shale Gas Market by Application Type
              • Power Generation
              • Heating
              • Chemical Feedstock
              • Transportation
              • Industrial Processes
            • REST OF SOUTH AMERICA Shale Gas Market by End Use Type
              • Residential
              • Commercial
              • Industrial
              • Utilities
            • REST OF SOUTH AMERICA Shale Gas Market by Method of Extraction Type
              • Hydraulic Fracturing
              • Horizontal Drilling
              • Vertical Drilling
              • Combination Techniques
            • REST OF SOUTH AMERICA Shale Gas Market by Market Player Type
              • Independent Producers
              • Major Oil and Gas Companies
              • Service Providers
              • Government Entities
            • MEA Outlook (USD Billion, 2019-2035)
              • MEA Shale Gas Market by Application Type
                • Power Generation
                • Heating
                • Chemical Feedstock
                • Transportation
                • Industrial Processes
              • MEA Shale Gas Market by End Use Type
                • Residential
                • Commercial
                • Industrial
                • Utilities
              • MEA Shale Gas Market by Method of Extraction Type
                • Hydraulic Fracturing
                • Horizontal Drilling
                • Vertical Drilling
                • Combination Techniques
              • MEA Shale Gas Market by Market Player Type
                • Independent Producers
                • Major Oil and Gas Companies
                • Service Providers
                • Government Entities
              • MEA Shale Gas Market by Regional Type
                • GCC Countries
                • South Africa
                • Rest of MEA
              • GCC COUNTRIES Outlook (USD Billion, 2019-2035)
              • GCC COUNTRIES Shale Gas Market by Application Type
                • Power Generation
                • Heating
                • Chemical Feedstock
                • Transportation
                • Industrial Processes
              • GCC COUNTRIES Shale Gas Market by End Use Type
                • Residential
                • Commercial
                • Industrial
                • Utilities
              • GCC COUNTRIES Shale Gas Market by Method of Extraction Type
                • Hydraulic Fracturing
                • Horizontal Drilling
                • Vertical Drilling
                • Combination Techniques
              • GCC COUNTRIES Shale Gas Market by Market Player Type
                • Independent Producers
                • Major Oil and Gas Companies
                • Service Providers
                • Government Entities
              • SOUTH AFRICA Outlook (USD Billion, 2019-2035)
              • SOUTH AFRICA Shale Gas Market by Application Type
                • Power Generation
                • Heating
                • Chemical Feedstock
                • Transportation
                • Industrial Processes
              • SOUTH AFRICA Shale Gas Market by End Use Type
                • Residential
                • Commercial
                • Industrial
                • Utilities
              • SOUTH AFRICA Shale Gas Market by Method of Extraction Type
                • Hydraulic Fracturing
                • Horizontal Drilling
                • Vertical Drilling
                • Combination Techniques
              • SOUTH AFRICA Shale Gas Market by Market Player Type
                • Independent Producers
                • Major Oil and Gas Companies
                • Service Providers
                • Government Entities
              • REST OF MEA Outlook (USD Billion, 2019-2035)
              • REST OF MEA Shale Gas Market by Application Type
                • Power Generation
                • Heating
                • Chemical Feedstock
                • Transportation
                • Industrial Processes
              • REST OF MEA Shale Gas Market by End Use Type
                • Residential
                • Commercial
                • Industrial
                • Utilities
              • REST OF MEA Shale Gas Market by Method of Extraction Type
                • Hydraulic Fracturing
                • Horizontal Drilling
                • Vertical Drilling
                • Combination Techniques
              • REST OF MEA Shale Gas Market by Market Player Type
                • Independent Producers
                • Major Oil and Gas Companies
                • Service Providers
                • Government Entities


    Infographic

    Free Sample Request

    Kindly complete the form below to receive a free sample of this Report

    Get Free Sample

    Customer Strories

    “I am very pleased with how market segments have been defined in a relevant way for my purposes (such as "Portable Freezers & refrigerators" and "last-mile"). In general the report is well structured. Thanks very much for your efforts.”

    Victoria Milne

    Founder
    Case Study
    Chemicals and Materials

    Compare Licence

    ×
    Features License Type
    Single User Multiuser License Enterprise User
    Price $4,950 $5,950 $7,250
    Maximum User Access Limit 1 User Upto 10 Users Unrestricted Access Throughout the Organization
    Free Customization
    Direct Access to Analyst
    Deliverable Format
    Platform Access
    Discount on Next Purchase 10% 15% 15%
    Printable Versions