ID: MRFR/A&D/3188-HCR | | Region: Global | 100 pages
Market Scenario
Satellite propulsion is a method used to accelerate a satellite. Satellite propulsion or in-space propulsion exclusively deals with propulsion systems used in the vacuum of space.
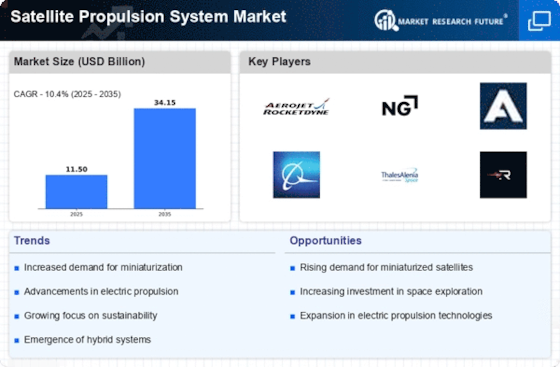
The advent of low-cost satellites and development of reusable space launch vehicles are some of the major factors driving the growth of the market. The usage of new-generation and reusable launch vehicles are paving the way for another successful and cost-effective makeover of the domain of satellite systems. In recent years, a number of countries are focused on innovative, profitable satellite launches.
Also, satellite launches are mostly done using expendable launch vehicles (ELV) that carry a payload to the orbit and can be used only once. The majority of the satellite launch cost comes from building the rocket, which gets used for a single mission. However, instead of an ELV, a reusable space launch vehicle can substantially reduce the cost of access to space, if the rockets could be effectively used for multiple missions, similar to that of airplanes. Companies such as SpaceX have been working to develop such reusable space launch vehicles that can re-enter the earth without burning and return to the launchpad for a vertical landing.
Also, the rapid deployment of CubeSats is one of the newest trends in the market. With the growing demand for nano and microsatellite, it is expected that the manufacturing base of satellites will widen to various regions of the world. Many of the developing nations have also shown a keen interest in the utilization of satellites such as CubeSats (U-class spacecraft). These satellites use enhanced electro-optical/infrared (EO/IR) sensor systems to obtain images of Earth. Earth Observation (EO) from such nanosatellite platforms will revolutionize the scope of the EO/IR sensors. These satellites are majorly accelerated using all-electric propulsion systems, which widens their mission capabilities, reduce their weight, and lessen their launch costs.
Segmentation of the Global Satellite Propulsion System Market
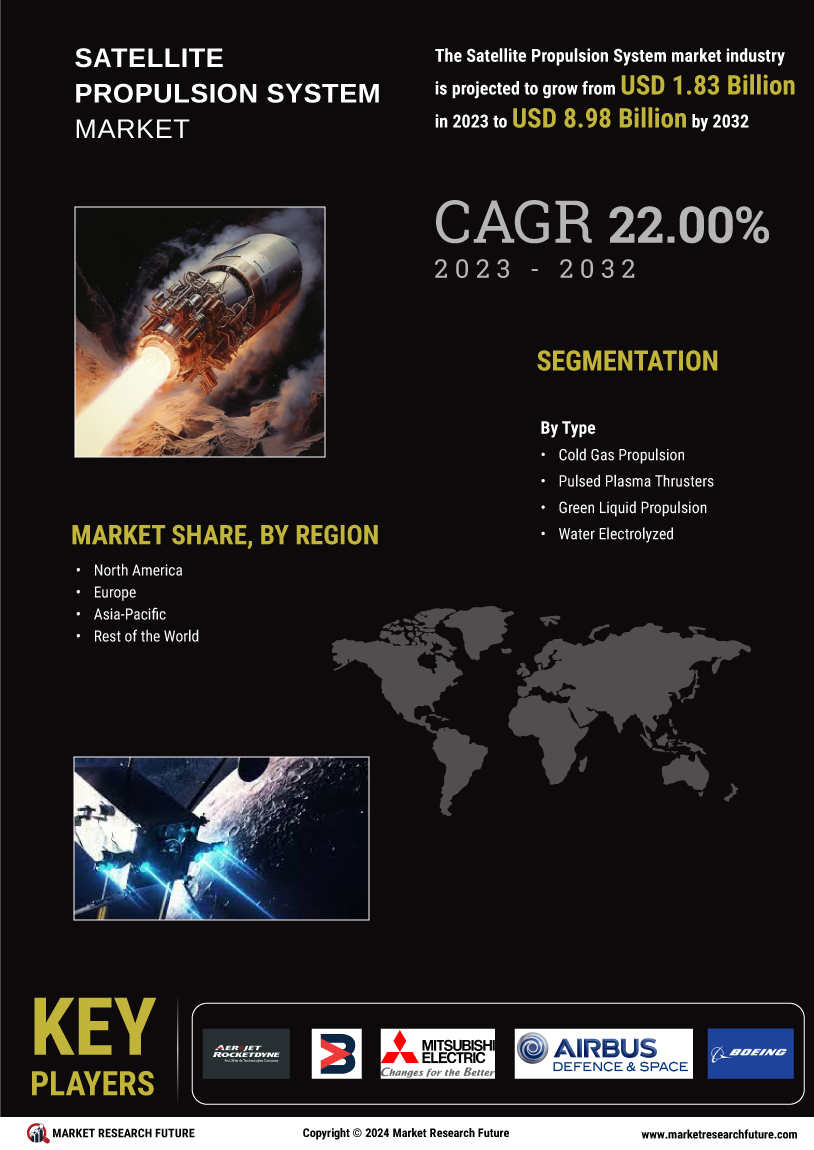
Based on propulsion type, the market has been segmented into cold gas propulsion, pulsed plasma thrusters, green liquid propulsion, water electrolyzed, hydrazine, micro electrospray propulsion, iodine hall propulsion, solar sail propulsion, and ambipolar thruster. The ambipolar thruster segment dominated the market in 2018 and is expected to grow at the highest CAGR from 2019 to 2025. An ambipolar thruster is the type of a thruster designed as a propulsion system for CubeSats. The increasing adoption of CubeSats by various countries such as the US, China, India, and others is driving the growth of the segment.
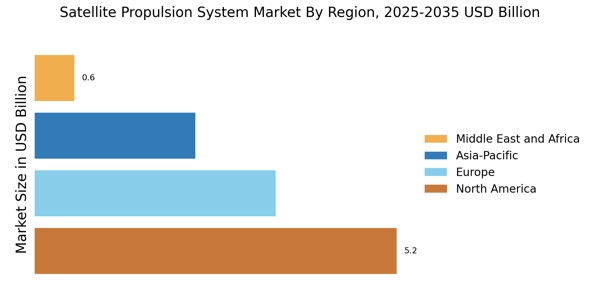
Based on the region, the market has been categorized as North America, Europe, Asia-Pacific, and rest of the world. North America is estimated to acquire the most significant market share in 2018 and is expected to grow at the highest CAGR during the forecast period. The presence of prominent space organizations such as the National Aeronautics and Space Administration (NASA) is driving the market growth in the region. Furthermore, the presence of leading satellite propulsion system providers such as Boeing, and Aerojet Rocketdyne is also boosting the market growth in the region.
Intended Audience
Table of Contents
1. Executive Summary
1.1. Market Attractiveness Analysis
1.1.1. Global Satellite Propulsion System Market, by Propulsion Type
1.1.2. Global Satellite Propulsion System Market, by Region
2. Market Introduction
2.1. Market Definition
2.2. Scope of the Study
2.3. Market Structure
2.4. Key Buying Criteria
2.5. Market Factor Indicator Analysis
3. Research Methodology
3.1. Research Process
3.2. Primary Research
3.3. Secondary Research
3.4. Market Size Estimation
3.5. Forecast Model
3.6. List of Assumptions
4. Market Insights
5. Market Dynamics
5.1. Introduction
5.2. Drivers
5.3. Restraints
5.4. Opportunities
5.5. Challenges
5.6. Market/Technological Trends
5.7. Patent Trends
5.8. Regulatory Landscape/Standards
6. Market Factor Analysis
6.1. Value Chain/Supply Chain Analysis
6.1.1. R&D
6.1.2. Manufacturing
6.1.3. Distribution & Sales
6.1.4. Post–Sales Monitoring
6.2. Porter’s Five Forces Analysis
6.2.1. Threat of New Entrants
6.2.2. Bargaining Power of Buyers
6.2.3. Threat of Substitutes
6.2.4. Rivalry
6.2.5. Bargaining Power of Supplies
7. Global Satellite Propulsion System Market, by Propulsion Type
7.1. Introduction
7.2. Cold Gas Propulsion
7.2.1. Market Estimates & Forecast, 2019–2025
7.2.2. Market Estimates & Forecast, by Region, 2019–2025
7.3. Pulsed Plasma Thrusters
7.3.1. Market Estimates & Forecast, 2019–2025
7.3.2. Market Estimates & Forecast, by Region, 2019–2025
7.4. Green Liquid Propulsion
7.4.1. Market Estimates & Forecast, 2019–2025
7.4.2. Market Estimates & Forecast, by Region, 2019–2025
7.5. Water Electrolyzed
7.5.1. Market Estimates & Forecast, 2019–2025
7.5.2. Market Estimates & Forecast, by Region, 2019–2025
7.6. Hydrazine
7.6.1. Market Estimates & Forecast, 2019–2025
7.6.2. Market Estimates & Forecast, by Region, 2019–2025
7.7. Micro Electrospray Propulsion
7.7.1. Market Estimates & Forecast, 2019–2025
7.7.2. Market Estimates & Forecast, by Region, 2019–2025
7.8. Iodine Hall Propulsion
7.8.1. Market Estimates & Forecast, 2019–2025
7.8.2. Market Estimates & Forecast, by Region, 2019–2025
7.9. Solar Sail Propulsion
7.9.1. Market Estimates & Forecast, 2019–2025
7.9.2. Market Estimates & Forecast, by Region, 2019–2025
7.10. Ambipolar Thruster
7.10.1. Market Estimates & Forecast, 2019–2025
7.10.2. Market Estimates & Forecast, by Region, 2019–2025
8. Global Satellite Propulsion System Market, by Region
8.1. Introduction
8.2. North America
8.2.1. Market Estimates & Forecast, by Country, 2019–2025
8.2.2. Market Estimates & Forecast, by Propulsion Type, 2019–2025
8.2.3. US
8.2.3.1. Market Estimates & Forecast, by Propulsion Type, 2019–2025
8.2.4. Canada
8.2.4.1. Market Estimates & Forecast, by Propulsion Type, 2019–2025
8.3. Europe
8.3.1. Market Estimates & Forecast, by Country, 2019–2025
8.3.2. Market Estimates & Forecast, by Propulsion Type, 2019–2025
8.3.3. UK
8.3.3.1. Market Estimates & Forecast, by Propulsion Type, 2019–2025
8.3.4. Germany
8.3.4.1. Market Estimates & Forecast, by Propulsion Type, 2019–2025
8.3.5. France
8.3.5.1. Market Estimates & Forecast, by Propulsion Type, 2019–2025
8.3.6. Italy
8.3.6.1. Market Estimates & Forecast, by Propulsion Type, 2019–2025
8.3.7. Russia
8.3.7.1. Market Estimates & Forecast, by Propulsion Type, 2019–2025
8.3.8. Rest of Europe
8.3.8.1. Market Estimates & Forecast, by Propulsion Type, 2019–2025
8.4. Asia-Pacific
8.4.1. Market Estimates & Forecast, by Country, 2019–2025
8.4.2. Market Estimates & Forecast, by Propulsion Type, 2019–2025
8.4.3. China
8.4.3.1. Market Estimates & Forecast, by Propulsion Type, 2019–2025
8.4.4. Japan
8.4.4.1. Market Estimates & Forecast, by Propulsion Type, 2019–2025
8.4.5. India
8.4.5.1. Market Estimates & Forecast, by Propulsion Type, 2019–2025
8.4.6. Rest of Asia-Pacific
8.4.6.1. Market Estimates & Forecast, by Propulsion Type, 2019–2025
8.5. Rest of the World
8.5.1. Market Estimates & Forecast, by Region, 2019–2025
8.5.2. Market Estimates & Forecast, by Propulsion Type, 2019–2025
8.5.3. Middle East & Africa
8.5.3.1. Market Estimates & Forecast, by Propulsion Type, 2019–2025
8.5.4. Latin America
8.5.4.1. Market Estimates & Forecast, by Propulsion Type, 2019–2025
9. Competitive Landscape
9.1. Competitive Overview
9.2. Competitor Dashboard
9.3. Major Growth Strategies in the Global Satellite Propulsion System Market
9.4. Competitive Benchmarking
9.5. Market Share Analysis
9.6. Airbus SAS: The Leading Player in Terms of Number of Developments in the Global Satellite Propulsion System Market
9.7. Key Developments & Growth Strategies
9.7.1. Product Launches/Service Deployments
9.7.2. Mergers & Acquisitions
9.7.3. Joint Ventures
10. Company Profiles
10.1. Aerojet Rocketdyne
10.1.1. Company Overview
10.1.2. Products/Services Offered
10.1.3. Financial Overview
10.1.4. Key Developments
10.1.5. SWOT Analysis
10.1.6. Key Strategies
10.2. Airbus SAS
10.2.1. Company Overview
10.2.2. Products/Services Offered
10.2.3. Financial Overview
10.2.4. Key Developments
10.2.5. SWOT Analysis
10.2.6. Key Strategies
10.3. BALL CORPORATION
10.3.1. Company Overview
10.3.2. Products/Services Offered
10.3.3. Financial Overview
10.3.4. Key Developments
10.3.5. SWOT Analysis
10.3.6. Key Strategies
10.4. Bellatrix Aerospace Private Limited
10.4.1. Company Overview
10.4.2. Products/Services Offered
10.4.3. Financial Overview
10.4.4. Key Developments
10.4.5. SWOT Analysis
10.4.6. Key Strategies
10.5. Boeing
10.5.1. Company Overview
10.5.2. Products/Services Offered
10.5.3. Financial Overview
10.5.4. Key Developments
10.5.5. SWOT Analysis
10.5.6. Key Strategies
10.6. Busek Co. Inc.
10.6.1. Company Overview
10.6.2. Products/Services Offered
10.6.3. Financial Overview
10.6.4. Key Developments
10.6.5. SWOT Analysis
10.6.6. Key Strategies
10.7. Cobham PLC
10.7.1. Company Overview
10.7.2. Products/Services Offered
10.7.3. Financial Overview
10.7.4. Key Developments
10.7.5. SWOT Analysis
10.7.6. Key Strategies
10.8. CU Aerospace
10.8.1. Company Overview
10.8.2. Products/Services Offered
10.8.3. Financial Overview
10.8.4. Key Developments
10.8.5. SWOT Analysis
10.8.6. Key Strategies
10.9. ENPULSION GmbH
10.9.1. Company Overview
10.9.2. Products/Services Offered
10.9.3. Financial Overview
10.9.4. Key Developments
10.9.5. SWOT Analysis
10.9.6. Key Strategies
10.10. Exotrail SA
10.10.1. Company Overview
10.10.2. Products/Services Offered
10.10.3. Financial Overview
10.10.4. Key Developments
10.10.5. SWOT Analysis
10.10.6. Key Strategies
10.11. Mitsubishi Electric Corporation
10.11.1. Company Overview
10.11.2. Products/Services Offered
10.11.3. Financial Overview
10.11.4. Key Developments
10.11.5. SWOT Analysis
10.11.6. Key Strategies
10.12. MOOG INC.
10.12.1. Company Overview
10.12.2. Products/Services Offered
10.12.3. Financial Overview
10.12.4. Key Developments
10.12.5. SWOT Analysis
10.12.6. Key Strategies
10.13. Northrop Grumman Corporation
10.13.1. Company Overview
10.13.2. Products/Services Offered
10.13.3. Financial Overview
10.13.4. Key Developments
10.13.5. SWOT Analysis
10.13.6. Key Strategies
10.14. OHB System AG
10.14.1. Company Overview
10.14.2. Products/Services Offered
10.14.3. Financial Overview
10.14.4. Key Developments
10.14.5. SWOT Analysis
10.14.6. Key Strategies
10.15. Safran SA
10.15.1. Company Overview
10.15.2. Products/Services Offered
10.15.3. Financial Overview
10.15.4. Key Developments
10.15.5. SWOT Analysis
10.15.6. Key Strategies
11. Appendix
11.1. References
11.2. Related Reports
11.3. List of Abbreviations
12. Industry Insights
Note: This table of contents is tentative and subject to change as the research progresses.
List of Tables
Table 1 Global Satellite Propulsion System Market, by Region, 2019–2025
Table 2 North America: Satellite Propulsion System Market, by Country, 2019–2025
Table 3 Europe: Satellite Propulsion System Market, by Country, 2019–2025
Table 4 Asia-Pacific: Satellite Propulsion System Market, by Country, 2019–2025
Table 5 Rest of the World: Satellite Propulsion System Market, by Region, 2019–2025
Table 6 Global Satellite Propulsion System Market Size, by Region, 2019–2025
Table 7 North America: Satellite Propulsion System Market Size, by Country, 2019–2025
Table 8 Europe: Satellite Propulsion System Market Size, by Country, 2019–2025
Table 9 Asia-Pacific: Satellite Propulsion System Market Size, by Country, 2019–2025
Table 10 Rest of the World: Satellite Propulsion System Market Size, by Region, 2019–2025
Table 11 Global Satellite Propulsion System Propulsion Type Market, by Region, 2019–2025
Table 12 North America: Satellite Propulsion System Propulsion Type Market, by Country, 2019–2025
Table 13 Europe: Satellite Propulsion System Propulsion Type Market, by Country, 2019–2025
Table 14 Asia-Pacific: Satellite Propulsion System Propulsion Type Market, by Country, 2019–2025
Table 15 Rest of the World: Satellite Propulsion System Propulsion Type Market, by Region, 2019–2025
Table 16 Global Satellite Propulsion System Market, by Region, 2019–2025
Table 17 North America: Satellite Propulsion System Market, by Country, 2019–2025
Table 18 Europe: Satellite Propulsion System Market, by Country, 2019–2025
Table 19 Asia-Pacific: Satellite Propulsion System Market, by Country, 2019–2025
Table 20 Rest of the World: Satellite Propulsion System Market, by Region, 2019–2025
Table 21 Global Satellite Propulsion System Market, by Region, 2019–2025
Table 22 Global Satellite Propulsion System Market, by Propulsion Type, 2019–2025
Table 23 North America: Satellite Propulsion System Market, by Country, 2019–2025
Table 24 North America: Satellite Propulsion System Market, by Propulsion Type, 2019–2025
Table 25 Europe: Satellite Propulsion System Market, by Country, 2019–2025
Table 26 Europe: Satellite Propulsion System Market, by Propulsion Type, 2019–2025
Table 27 Asia-Pacific: Satellite Propulsion System Market, by Country, 2019–2025
Table 28 Asia-Pacific: Satellite Propulsion System Market, by Propulsion Type, 2019–2025
Table 29 Rest of the World: Satellite Propulsion System Market, by Region, 2019–2025
Table 30 Rest of the World: Satellite Propulsion System Market, by Propulsion Type, 2019–2025
List of Figures
FIGURE 1 Research Process of MRFR
FIGURE 2 Top-Down & Bottom-Up Approaches
FIGURE 3 Market Dynamics
FIGURE 4 Impact Analysis: Market Drivers
FIGURE 5 Impact Analysis: Market Restraints
FIGURE 6 Porter's Five Forces Analysis
FIGURE 7 Value Chain Analysis
FIGURE 8 Global Satellite Propulsion System Market Share, by Propulsion Type, 2018 (%)
FIGURE 9 Global Satellite Propulsion System Market, by Propulsion Type, 2019–2025 (USD Million)
FIGURE 10 Global Satellite Propulsion System Market Share (%), by Region, 2018
FIGURE 11 Global Satellite Propulsion System Market, by Region, 2019–2025 (USD Million)
FIGURE 12 North America: Satellite Propulsion System Market Share (%), 2018
FIGURE 13 North America: Satellite Propulsion System Market, by Country, 2019–2025 (USD Million)
FIGURE 14 Europe: Satellite Propulsion System Market Share (%), 2018
FIGURE 15 Europe: Satellite Propulsion System Market, by Country, 2019–2025 (USD Million)
FIGURE 16 Asia-Pacific: Satellite Propulsion System Market Share (%), 2018
FIGURE 17 Asia-Pacific: Satellite Propulsion System Market, by Country, 2019–2025 (USD Million)
FIGURE 18 Rest of the World: Satellite Propulsion System Market Share (%), 2018
FIGURE 19 Rest of the World: Satellite Propulsion System Market, by Region, 2019–2025 (USD Million)