ID: MRFR/A&D/6925-HCR | February 2021 | Region: Global | 133 pages
Market Scenario
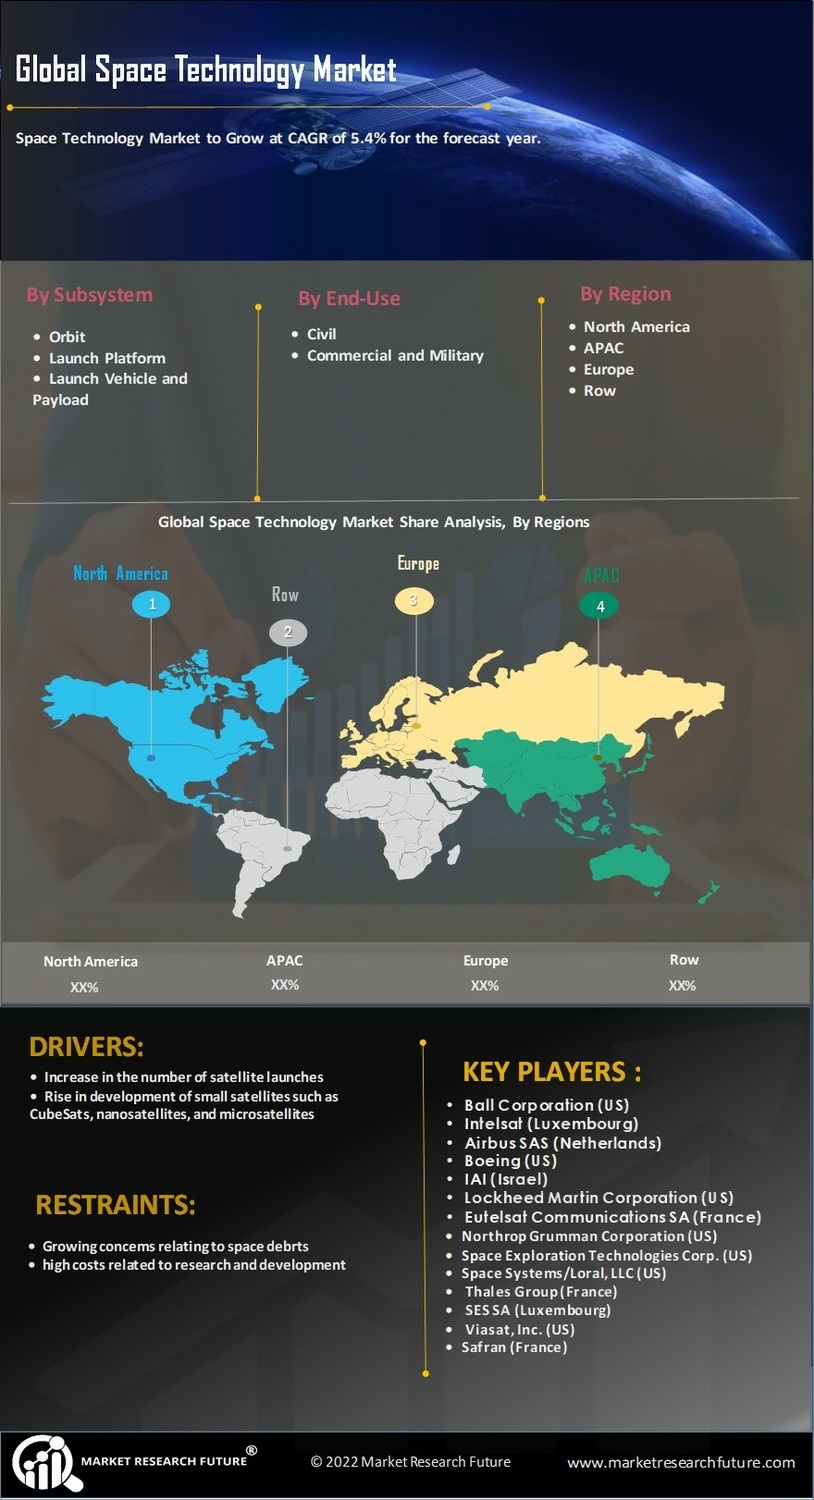
Innovations in the manufacture and launch of satellites are driving the evolution of the space industry. The expansion of the global space technology market is attributed to factors such as increase in the number of satellites launches by countries such as the US, Russia, China, and India and rise in development of small satellites such as CubeSats, nanosatellites, and microsatellites. Additionally, the growing adoption of space farming by prominent space organizations such as NASA and the development of space hotels are expected to drive the growth of the market.
Furthermore, the growing demand for satellites by the military forces for secured communications is expected to drive the market growth. For example, in August 2019, The United Launch Alliance (ULA) launched an Atlas V rocket carrying a satellite to provide jam-resistant secure communication to the US Army.However, growing concerns relating to space debris, high costs related to research and development, and stringent government regulations regarding satellite manufacturing are expected to hamper the growth of the market.
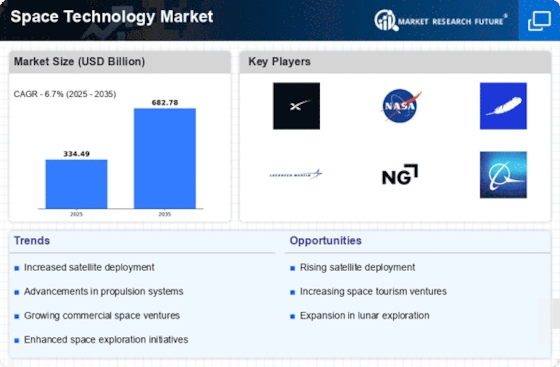
The Global Space Technology Market is estimated to register a CAGR of nearly 5.4% between 2019 and 2025.
Segmentation of the Global Space Technology Market
On the basis of subsystem, the global space technology market has been divided into orbit, launch platform, launch vehicle, and payload. The payload segment dominated the global market in 2018. However, the launch vehicle segment is projected to expand at the highest CAGR during the forecast period. Increasing developments in the field of satellite launch vehicles are expected to drive the growth of the segment. For instance, the Indian Space Research Organisation (ISRO) developed a small satellite launch vehicle (SSLV). The vehicle has a payload capacity of 500 kg and can support multiple orbital drop-offs.
Based on end use, the market has been divided into civil, commercial, and military. The commercial segment dominated the market in 2018 and is expected to register the highest CAGR during the forecast period owing to the increase in the number of satellites being launched by companies worldwide. For example, in May 2019, SpaceX launched 60 Starlink satellites to offer high-speed Internet connectivity across the globe. Furthermore, the growing concept of space tourism is expected to drive the growth of the segment.
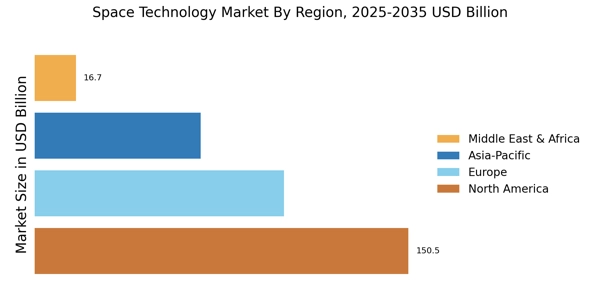
In terms of region, the global space technology market has been divided into North America, Europe, Asia-Pacific, and the rest of the World. The North American market dominated the global space technology market in 2018 owing to the presence of prominent space organizations such as NASA. However, Asia-Pacific is expected to be the fastest-growing market during the forecast period. The availability of low-cost satellites and advanced technology are driving the growth of the market in the region. Furthermore, increasing number of space technology start-ups such as Bellatrix Aerospace (India) Private Limited and Exseed Space (India) is anticipated to drive the growth of the market in the region.
Key Players
The key players in the global space technology market include Ball Corporation (US), Intelsat (Luxembourg), Airbus SAS (Netherlands), Boeing (US), IAI (Israel), Lockheed Martin Corporation (US), Eutelsat Communications SA (France), Northrop Grumman Corporation (US), Space Exploration Technologies Corp. (US), Space Systems/Loral, LLC (US), Thales Group (France), SES SA (Luxembourg), Viasat, Inc. (US), Safran (France), Leonardo SpA (Italy), General Electric (US), Honeywell International Inc. (US), United Technologies Corporation (US), Teledyne Technologies Incorporated (US), Transdigm Group, Inc. (US), and NEC Corporation (Japan).
Research Methodology
The market values and forecasts are derived using MRFR research methodology, which includes secondary research, primary interviews, data triangulation, and validation from an in-house data repository and statistical modeling tools.
In this process, data is collected from various secondary sources including annual reports, SEC filings, journals, government associations, aerospace & defense magazines, white papers, corporate presentations, company websites, and paid databases.
In this process, both the demand- and supply-side parties are interviewed to extract facts and insights into the market forecast, production, trends, and projected market growth. Industry stakeholders such as CEOs, VPs, directors, and marketing executives across the value chain are approached to obtain key information.
Key Insights
Report Customization
MRFR offers report customization to valued customers. Below are the options available for customization:
In-depth profiling of additional market players (3 to 4 companies)
Detailed analysis of a country-level market and related segments as per the report scope (subject to data availability)
Intended Audience
Frequently Asked Questions (FAQ) :
Global Space Technology Market is projected to register a moderate 5.4% CAGR in the forecast period.
The services segment is expected to observe substantial demand over the review period.
Modernizations in the production and launch of satellites are fueling the evolution of the space technology market.
The OEM segment is slated to expand as the fastest-growing segment.
A few eminent market players operating in the global space technology market are Analytical Graphics (US), Etamax Space (Germany), Exoanalytic Solutions (US), among others.
Table of Contents
1. Executive Summary
1.1. Market Attractiveness Analysis
1.1.1. Global Space Technology Market, by Subsystem
1.1.2. Global Space Technology Market, by End Use
1.1.3. Global Space Technology Market, by Region
2. Market Introduction
2.1. Market Definition
2.2. Scope of the Study
2.3. Market Structure
2.4. Key Buying Criteria
2.5. Market Factor Indicator Analysis
3. Research Methodology
3.1. Research Process
3.2. Primary Research
3.3. Secondary Research
3.4. Market Size Estimation
3.5. Forecast Model
3.6. List of Assumptions
4. Market Insights
5. Market Dynamics
5.1. Introduction
5.2. Drivers
5.3. Restraints
5.4. Opportunities
5.5. Challenges
5.6. Market/Technological Trends
5.7. Patent Trends
5.8. Regulatory Landscape/Standards
6. Market Factor Analysis
6.1. Value Chain/Supply Chain Analysis
6.1.1. R&D
6.1.2. Manufacturing
6.1.3. Distribution & Sales
6.1.4. Post-Sales Monitoring
6.2. Porter’s Five Forces Analysis
6.2.1. Threat of New Entrants
6.2.2. Bargaining Power of Buyers
6.2.3. Threat of Substitutes
6.2.4. Rivalry
6.2.5. Bargaining Power of Suppliers
7. Global Space Technology Market, by Subsystem
7.1. Introduction
7.2. Orbit
7.2.1. Market Estimates & Forecast, 2019–2025
7.2.2. Market Estimates & Forecast, by Region, 2019–2025
7.3. Launch Platform
7.3.1. Market Estimates & Forecast, 2019–2025
7.3.2. Market Estimates & Forecast, by Region, 2019–2025
7.4. Launch Vehicle
7.4.1. Market Estimates & Forecast, 2019–2025
7.4.2. Market Estimates & Forecast, by Region, 2019–2025
7.5. Payload
7.5.1. Market Estimates & Forecast, 2019–2025
7.5.2. Market Estimates & Forecast, by Region, 2019–2025
8. Global Space Technology Market, by End Use
8.1. Introduction
8.2. Civil
8.2.1. Market Estimates & Forecast, 2019–2025
8.2.2. Market Estimates & Forecast, by Region, 2019–2025
8.3. Commercial
8.3.1. Market Estimates & Forecast, 2019–2025
8.3.2. Market Estimates & Forecast, by Region, 2019–2025
8.4. Military
8.4.1. Market Estimates & Forecast, 2019–2025
8.4.2. Market Estimates & Forecast, by Region, 2019–2025
9. Global Space Technology Market, by Region
9.1. Introduction
9.2. North America
9.2.1. Market Estimates & Forecast, by Country, 2019–2025
9.2.2. Market Estimates & Forecast, by End Use, 2019–2025
9.2.3. US
9.2.3.1. Market Estimates & Forecast, by Subsystem, 2019–2025
9.2.3.2. Market Estimates & Forecast, by End Use, 2019–2025
9.2.4. Canada
9.2.4.1. Market Estimates & Forecast, by Subsystem, 2019–2025
9.2.4.2. Market Estimates & Forecast, by End Use, 2019–2025
9.3. Europe
9.3.1. Market Estimates & Forecast, by Country, 2019–2025
9.3.2. Market Estimates & Forecast, by Subsystem, 2019–2025
9.3.3. Market Estimates & Forecast, by End Use, 2019–2025
9.3.4. UK
9.3.4.1. Market Estimates & Forecast, by Subsystem, 2019–2025
9.3.4.2. Market Estimates & Forecast, by End Use, 2019–2025
9.3.5. Germany
9.3.5.1. Market Estimates & Forecast, by Subsystem, 2019–2025
9.3.5.2. Market Estimates & Forecast, by End Use, 2019–2025
9.3.6. France
9.3.6.1. Market Estimates & Forecast, by Subsystem, 2019–2025
9.3.6.2. Market Estimates & Forecast, by End Use, 2019–2025
9.3.7. Russia
9.3.7.1. Market Estimates & Forecast, by Subsystem, 2019–2025
9.3.7.2. Market Estimates & Forecast, by End Use, 2019–2025
9.3.8. Rest of Europe
9.3.8.1. Market Estimates & Forecast, by Subsystem, 2019–2025
9.3.8.2. Market Estimates & Forecast, by End Use, 2019–2025
9.4. Asia-Pacific
9.4.1. Market Estimates & Forecast, by Country, 2019–2025
9.4.2. Market Estimates & Forecast, by Subsystem, 2019–2025
9.4.3. Market Estimates & Forecast, by End Use, 2019–2025
9.4.4. China
9.4.4.1. Market Estimates & Forecast, by Subsystem, 2019–2025
9.4.4.2. Market Estimates & Forecast, by End Use, 2019–2025
9.4.5. Japan
9.4.5.1. Market Estimates & Forecast, by Subsystem, 2019–2025
9.4.5.2. Market Estimates & Forecast, by End Use, 2019–2025
9.4.6. India
9.4.6.1. Market Estimates & Forecast, by Subsystem, 2019–2025
9.4.6.2. Market Estimates & Forecast, by End Use, 2019–2025
9.4.7. South Korea
9.4.7.1. Market Estimates & Forecast, by Subsystem, 2019–2025
9.4.7.2. Market Estimates & Forecast, by End Use, 2019–2025
9.4.8. Rest of Asia-Pacific
9.4.8.1. Market Estimates & Forecast, by Subsystem, 2019–2025
9.4.8.2. Market Estimates & Forecast, by End Use, 2019–2025
9.5. Rest of the World
9.5.1. Market Estimates & Forecast, by Region, 2019–2025
9.5.2. Market Estimates & Forecast, by Subsystem, 2019–2025
9.5.3. Market Estimates & Forecast, by End Use, 2019–2025
9.5.4. Middle East & Africa
9.5.4.1. Market Estimates & Forecast, by Subsystem, 2019–2025
9.5.4.2. Market Estimates & Forecast, by End Use, 2019–2025
9.5.5. Latin America
9.5.5.1. Market Estimates & Forecast, by Subsystem, 2019–2025
9.5.5.2. Market Estimates & Forecast, by End Use, 2019–2025
10. Competitive Landscape
10.1. Competitive Overview
10.2. Competitor Dashboard
10.3. Major Growth Strategies in the Global Space Technology Market
10.4. Competitive Benchmarking
10.5. Market Share Analysis
10.6. Lockheed Martin Corporation: The Leading Player in Terms of Number of Developments in the Global Space Technology Market
10.7. Key Developments & Growth Strategies
10.7.1. Product Launches/Service Deployments
10.7.2. Mergers & Acquisitions
10.7.3. Joint Ventures
11. Company Profiles
11.1. Airbus SAS
11.1.1. Company Overview
11.1.2. Products/Services Offered
11.1.3. Financial Overview
11.1.4. Key Developments
11.1.5. SWOT Analysis
11.1.6. Key Strategies
11.2. Ball Corporation
11.2.1. Company Overview
11.2.2. Products/Services Offered
11.2.3. Financial Overview
11.2.4. Key Developments
11.2.5. SWOT Analysis
11.2.6. Key Strategies
11.3. Boeing
11.3.1. Company Overview
11.3.2. Products/Services Offered
11.3.3. Financial Overview
11.3.4. Key Developments
11.3.5. SWOT Analysis
11.3.6. Key Strategies
11.4. Eutelsat Communications SA
11.4.1. Company Overview
11.4.2. Products/Services Offered
11.4.3. Financial Overview
11.4.4. Key Developments
11.4.5. SWOT Analysis
11.4.6. Key Strategies
11.5. General Electric
11.5.1. Company Overview
11.5.2. Products/Services Offered
11.5.3. Financial Overview
11.5.4. Key Developments
11.5.5. SWOT Analysis
11.5.6. Key Strategies
11.6. Honeywell International Inc.
11.6.1. Company Overview
11.6.2. Products/Services Offered
11.6.3. Financial Overview
11.6.4. Key Developments
11.6.5. SWOT Analysis
11.6.6. Key Strategies
11.7. Intelsat
11.7.1. Company Overview
11.7.2. Products/Services Offered
11.7.3. Financial Overview
11.7.4. Key Developments
11.7.5. SWOT Analysis
11.7.6. Key Strategies
11.8. IAI
11.8.1. Company Overview
11.8.2. Products/Services Offered
11.8.3. Financial Overview
11.8.4. Key Developments
11.8.5. SWOT Analysis
11.8.6. Key Strategies
11.9. Leonardo SpA
11.9.1. Company Overview
11.9.2. Products/Services Offered
11.9.3. Financial Overview
11.9.4. Key Developments
11.9.5. SWOT Analysis
11.9.6. Key Strategies
11.10. Lockheed Martin Corporation
11.10.1. Company Overview
11.10.2. Products/Services Offered
11.10.3. Financial Overview
11.10.4. Key Developments
11.10.5. SWOT Analysis
11.10.6. Key Strategies
11.11. NEC Corporation
11.11.1. Company Overview
11.11.2. Products/Services Offered
11.11.3. Financial Overview
11.11.4. Key Developments
11.11.5. SWOT Analysis
11.11.6. Key Strategies
11.12. Northrop Grumman Corporation
11.12.1. Company Overview
11.12.2. Products/Services Offered
11.12.3. Financial Overview
11.12.4. Key Developments
11.12.5. SWOT Analysis
11.12.6. Key Strategies
11.13. Safran
11.13.1. Company Overview
11.13.2. Products/Services Offered
11.13.3. Financial Overview
11.13.4. Key Developments
11.13.5. SWOT Analysis
11.13.6. Key Strategies
11.14. SES SA
11.14.1. Company Overview
11.14.2. Products/Services Offered
11.14.3. Financial Overview
11.14.4. Key Developments
11.14.5. SWOT Analysis
11.14.6. Key Strategies
11.15. Space Exploration Technologies Corp
11.15.1. Company Overview
11.15.2. Products/Services Offered
11.15.3. Financial Overview
11.15.4. Key Developments
11.15.5. SWOT Analysis
11.15.6. Key Strategies
11.16. Space Systems/Loral, LLC
11.16.1. Company Overview
11.16.2. Products/Services Offered
11.16.3. Financial Overview
11.16.4. Key Developments
11.16.5. SWOT Analysis
11.16.6. Key Strategies
11.17. Teledyne Technologies Incorporated
11.17.1. Company Overview
11.17.2. Products/Services Offered
11.17.3. Financial Overview
11.17.4. Key Developments
11.17.5. SWOT Analysis
11.17.6. Key Strategies
11.18. Thales Group
11.18.1. Company Overview
11.18.2. Products/Services Offered
11.18.3. Financial Overview
11.18.4. Key Developments
11.18.5. SWOT Analysis
11.18.6. Key Strategies
11.19. Transdigm Group, Inc.
11.19.1. Company Overview
11.19.2. Products/Services Offered
11.19.3. Financial Overview
11.19.4. Key Developments
11.19.5. SWOT Analysis
11.19.6. Key Strategies
11.20. United Technologies Corporation
11.20.1. Company Overview
11.20.2. Products/Services Offered
11.20.3. Financial Overview
11.20.4. Key Developments
11.20.5. SWOT Analysis
11.20.6. Key Strategies
11.21. Viasat, Inc.
11.21.1. Company Overview
11.21.2. Products/Services Offered
11.21.3. Financial Overview
11.21.4. Key Developments
11.21.5. SWOT Analysis
11.21.6. Key Strategies
12. Appendix
12.1. References
12.2. Related Reports
12.3. List of Abbreviations
13. Industry Insights
Note: This table of contents is tentative and subject to change as the research progresses.
List of Tables
Table 1 Global Space Technology Market, by Region, 2019–2025
Table 2 North America: Space Technology Market, by Country, 2019–2025
Table 3 Europe: Space Technology Market, by Country, 2019–2025
Table 4 Asia-Pacific: Space Technology Market, by Country, 2019–2025
Table 5 Rest of the World: Space Technology Market, by Region, 2019–2025
Table 6 Global Space Technology Market Size, by Region, 2019–2025
Table 7 North America: Space Technology Market Size, by Country, 2019–2025
Table 8 Europe: Space Technology Market Size, by Country, 2019–2025
Table 9 Asia-Pacific: Space Technology Market Size, by Country, 2019–2025
Table 10 Rest of the World: Space Technology Market Size, by Region, 2019–2025
Table 11 Global Space Technology Subsystem Market, by Region, 2019–2025
Table 12 North America: Space Technology Subsystem Market, by Country, 2019–2025
Table 13 Europe: Space Technology Subsystem Market, by Country, 2019–2025
Table 14 Asia-Pacific: Space Technology Subsystem Market, by Country, 2019–2025
Table 15 Rest of the World: Space Technology Subsystem Market, by Region, 2019–2025
Table 16 Global Space Technology End Use Market, by Region, 2019–2025
Table 17 North America: Space Technology End Use Market, by Country, 2019–2025
Table 18 Europe: Space Technology End Use Market, by Country, 2019–2025
Table 19 Asia-Pacific: Space Technology End Use Market, by Country, 2019–2025
Table 20 Rest of the World: Space Technology End Use Market, by Region, 2019–2025
Table 21 Global Space Technology Market, by Region, 2019–2025
Table 22 Global Space Technology Market, by Subsystem, 2019–2025
Table 23 Global Space Technology Market, by End Use, 2019–2025
Table 24 North America: Space Technology Market, by Country, 2019–2025
Table 25 North America: Space Technology Market, by Subsystem, 2019–2025
Table 26 North America: Space Technology Market, by End Use, 2019–2025
Table 27 Europe: Space Technology Market, by Country, 2019–2025
Table 28 Europe: Space Technology Market, by Subsystem, 2019–2025
Table 29 Europe: Space Technology Market, by End Use, 2019–2025
Table 30 Asia-Pacific: Space Technology Market, by Country, 2019–2025
Table 31 Asia-Pacific: Space Technology Market, by Subsystem, 2019–2025
Table 32 Asia-Pacific: Space Technology Market, by End Use, 2019–2025
Table 33 Rest of the World: Space Technology Market, by Region, 2019–2025
Table 34 Rest of the World: Space Technology Market, by Subsystem, 2019–2025
Table 35 Rest of the World: Space Technology Market, by End Use, 2019–2025
List of Figures
FIGURE 1 Research Process of MRFR
FIGURE 2 Top-Down & Bottom-Up Approaches
FIGURE 3 Market Dynamics
FIGURE 4 Impact Analysis: Market Drivers
FIGURE 5 Impact Analysis: Market Restraints
FIGURE 6 Porter's Five Forces Analysis
FIGURE 7 Value Chain Analysis
FIGURE 8 Global Space Technology Market Share, by Subsystem, 2018 (%)
FIGURE 9 Global Space Technology Market, by Subsystem, 2019–2025 (USD Million)
FIGURE 10 Global Space Technology Market Share, by End Use, 2018 (%)
FIGURE 11 Global Space Technology Market, by End Use, 2019–2025 (USD Million)
FIGURE 12 Global Space Technology Market Share, by Region, 2018 (%)
FIGURE 13 Global Space Technology Market, by Region, 2019–2025 (USD Million)
FIGURE 14 North America: Space Technology Market Share, 2018 (%)
FIGURE 15 North America: Space Technology Market, by Country, 2019–2025 (USD Million)
FIGURE 16 Europe: Space Technology Market Share, 2018 (%)
FIGURE 17 Europe: Space Technology Market, by Country, 2019–2025 (USD Million)
FIGURE 18 Asia-Pacific: Space Technology Market Share, 2018 (%)
FIGURE 19 Asia-Pacific: Space Technology Market, by Country, 2019–2025 (USD Million)
FIGURE 20 Rest of the World: Space Technology Market Share, 2018 (%)
FIGURE 21 Rest of the World: Space Technology Market, by Region, 2019–2025 (USD Million)