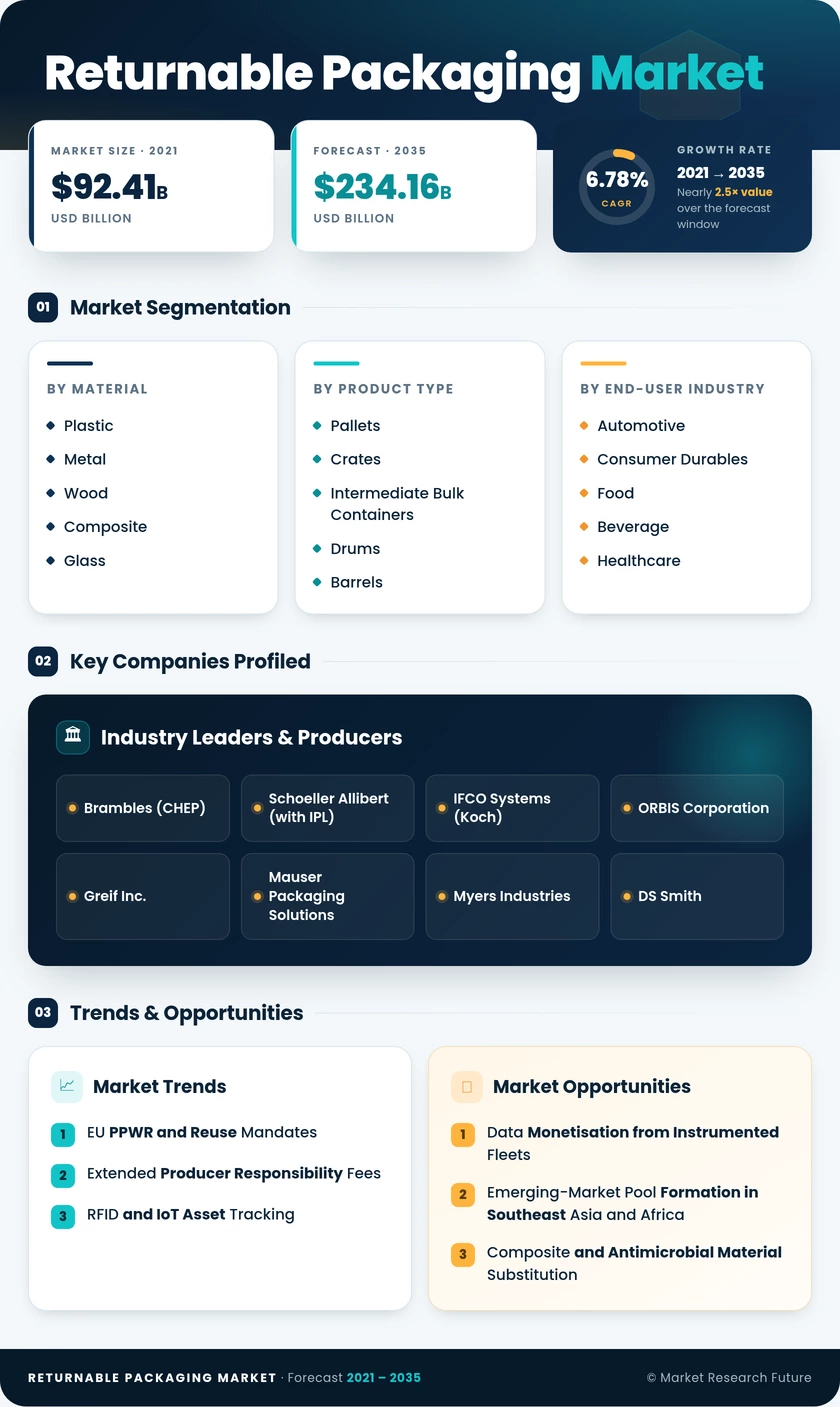
Returnable Packaging Market (2026 - 2035)

ID: MRFR/PCM/5428-HCR 100 Pages Snehal Singh Last Updated: October 19, 2026
Returnable Packaging Market Research Report Information By Material (Plastic, Metal, Wood, Composite, and Glass), By Product Type (Pallets, Crates, Intermediate Bulk Containers, Drums and Barrels, Dunnage and Racks, and Totes and Bins), By End-User Industry (Food and Beverage, Automotive, Healthcare and Pharmaceuticals, Consumer Durables, Retail and E-commerce, and Chemicals and Industrial), and By Ownership Model (Company-Owned Assets, Pooled/Leased, and Hybrid Managed Services) – Forecast Till 2035.
Returnable Packaging Market
Market Size
Forecast Period2026-2035
CAGR (2026-2035)6.78%
2025 Market SizeUSD 121.68 Billion
2035 Market SizeUSD 234.16 Billion
Key Players
Brambles
Schoeller Allibert
IFCO Systems
ORBIS Corporation
Greif Inc.
Mauser Packaging Solutions
Opportunities
  • Data Monetisation from Instrumented Fleets
  • Emerging-Market Pool Formation in Southeast Asia and Africa
  • Composite and Antimicrobial Material Substitution
  1. 1 Market Overview | |
    1. 1.1 Study Assumptions & Market Definition | |
    2. 1.2 Scope of the Study | |
    3. 1.3 Research Methodology | |
  2. 2 Market Summary & Key Takeaways | |
    1. 2.1 Key Takeaways by Material | |
    2. 2.2 Key Takeaways by Product Type and End User | |
    3. 2.3 Key Takeaways by Region | |
  3. 3 Global Market Size & Forecast (2021–2035) | |
    1. 3.1 Historical Market Size (2021–2024) | |
    2. 3.2 Base Year Estimation (2025) | |
    3. 3.3 Forecast Market Size (2026–2035) | |
    4. 3.4 Year-over-Year Growth Analysis | |
  4. 4 Market Drivers Analysis | |
    1. 4.1 EU PPWR and Reuse Mandates | |
    2. 4.2 Extended Producer Responsibility Fees | |
    3. 4.3 RFID and IoT Asset Tracking | |
    4. 4.4 E-commerce Reverse Logistics Scale | |
    5. 4.5 Automotive EV Platform Retooling | |
    6. 4.6 Pooling-as-a-Service Adoption | |
    7. 4.7 Cold-Chain and Pharma Compliance | |
  5. 5 Market Restraints Analysis | |
    1. 5.1 High Upfront Capital Intensity | |
    2. 5.2 Reverse Logistics Cost and Complexity | |
    3. 5.3 Asset Loss and Pool Imbalance | |
    4. 5.4 Hygiene and Wash-Cycle Overhead | |
    5. 5.5 Lack of Standardisation Across Pools | |
  6. 6 Market Opportunity Analysis | |
    1. 6.1 Data Monetisation from Instrumented Fleets | |
    2. 6.2 Emerging-Market Pool Formation in Southeast Asia and Africa | |
    3. 6.3 Composite and Antimicrobial Material Substitution | |
    4. 6.4 Pharmaceutical and Clinical Trial Containers | |
    5. 6.5 Hybrid Ownership and Asset-Light Financing | |
    6. 6.6 Industry Value Chain Analysis | |
    7. 6.7 Porter's Five Forces Analysis | |
  7. 7 Regional Analysis | |
    1. 7.1 North America | | |
      1. 7.1.1 US | | |
      2. 7.1.2 Canada | | |
      3. 7.1.3 Mexico | |
    2. 7.2 Europe | | |
      1. 7.2.1 Germany | | |
      2. 7.2.2 UK | | |
      3. 7.2.3 France | | |
      4. 7.2.4 Italy | | |
      5. 7.2.5 Spain | | |
      6. 7.2.6 Nordic Countries | | |
      7. 7.2.7 Russia | | |
      8. 7.2.8 Rest of Europe | |
    3. 7.3 Asia-Pacific | | |
      1. 7.3.1 China | | |
      2. 7.3.2 India | | |
      3. 7.3.3 Japan | | |
      4. 7.3.4 South Korea | | |
      5. 7.3.5 ASEAN | | |
      6. 7.3.6 Rest of Asia-Pacific | |
    4. 7.4 South America | | |
      1. 7.4.1 Brazil | | |
      2. 7.4.2 Argentina | | |
      3. 7.4.3 Rest of South America | |
    5. 7.5 Middle East & Africa | | |
      1. 7.5.1 Saudi Arabia | | |
      2. 7.5.2 UAE | | |
      3. 7.5.3 South Africa | | |
      4. 7.5.4 Egypt | | |
      5. 7.5.5 Rest of Middle East & Africa | |
  8. 8 Future Outlook (2026–2035) | |
    1. 8.1 Autonomous Warehousing and Asset Interoperability | |
    2. 8.2 Platform Economics and Pool Consolidation | |
    3. 8.3 Carbon Accounting and Scope 3 Disclosure | |
    4. 8.4 Material Science and Circular Feedstock | |
  9. 9 Segmentation Analysis | |
    1. 9.1 By Material | | |
      1. 9.1.1 Plastic | | |
      2. 9.1.2 Metal | | |
      3. 9.1.3 Wood | | |
      4. 9.1.4 Composite | | |
      5. 9.1.5 Glass | |
    2. 9.2 By Product Type | | |
      1. 9.2.1 Pallets | | |
      2. 9.2.2 Crates | | |
      3. 9.2.3 Intermediate Bulk Containers | | |
      4. 9.2.4 Drums and Barrels | | |
      5. 9.2.5 Dunnage and Racks | | |
      6. 9.2.6 Totes and Bins | |
    3. 9.3 By End-User Industry | | |
      1. 9.3.1 Food and Beverage | | |
      2. 9.3.2 Automotive | | |
      3. 9.3.3 Healthcare and Pharmaceuticals | | |
      4. 9.3.4 Consumer Durables | | |
      5. 9.3.5 Retail and E-commerce | | |
      6. 9.3.6 Chemicals and Industrial | |
    4. 9.4 By Ownership Model | | |
      1. 9.4.1 Company-Owned Assets | | |
      2. 9.4.2 Pooled/Leased | | |
      3. 9.4.3 Hybrid Managed Services | |
  10. 10 Competitive Landscape | |
    1. 10.1 Market Concentration Analysis (2026) | |
    2. 10.2 Competitive Benchmarking Matrix | |
    3. 10.3 Company Profiles | | |
      1. 10.3.1 Brambles (CHEP) | | |
      2. 10.3.2 Schoeller Allibert | | |
      3. 10.3.3 IFCO Systems | | |
      4. 10.3.4 ORBIS Corporation | | |
      5. 10.3.5 Greif Inc. | | |
      6. 10.3.6 Mauser Packaging Solutions | | |
      7. 10.3.7 Myers Industries | | |
      8. 10.3.8 DS Smith | | |
      9. 10.3.9 Nefab Group | | |
      10. 10.3.10 Rehrig Pacific Company | | |
      11. 10.3.11 Tosca Services | | |
      12. 10.3.12 CABKA Group | |
  11. 11 Recent Developments & News | |
  12. 12 Report Scope & Methodology | |
    1. 12.1 Study Period & Base Year | |
    2. 12.2 Valuation Currency & Assumptions | |
    3. 12.3 Abbreviations | |
  13. 13 Detailed Sources & Citations | |
  14. 14 Frequently Asked Questions | | LIST OF TABLES | |
  15. TABLE 1 Global Returnable Packaging Market Size & Forecast, by Revenue (USD Billion), 2021–2035 | |
  16. TABLE 2 Global Returnable Packaging Market – Year-over-Year Growth Analysis, 2021–2035 | |
  17. TABLE 3 Driver Impact Analysis Matrix, 2026–2035 | |
  18. TABLE 4 Restraint Impact Analysis Matrix, 2026–2035 | |
  19. TABLE 5 Global Returnable Packaging Market Size, by Material, 2021–2035 (USD Billion) | |
  20. TABLE 6 Global Returnable Packaging Market Size, by Product Type, 2021–2035 (USD Billion) | |
  21. TABLE 7 Global Returnable Packaging Market Size, by End-User Industry, 2021–2035 (USD Billion) | |
  22. TABLE 8 Global Returnable Packaging Market Size, by Ownership Model, 2021–2035 (USD Billion) | |
  23. TABLE 9 Global Returnable Packaging Market Size, by Region, 2021–2035 (USD Billion) | |
  24. TABLE 10 North America Returnable Packaging Market Size, by Country, 2021–2035 (USD Billion) | |
  25. TABLE 11 Europe Returnable Packaging Market Size, by Country, 2021–2035 (USD Billion) | |
  26. TABLE 12 Asia-Pacific Returnable Packaging Market Size, by Country, 2021–2035 (USD Billion) | |
  27. TABLE 13 South America Returnable Packaging Market Size, by Country, 2021–2035 (USD Billion) | |
  28. TABLE 14 Middle East & Africa Returnable Packaging Market Size, by Country, 2021–2035 (USD Billion) | |
  29. TABLE 15 North America Returnable Packaging Market Size, by Material, 2021–2035 (USD Billion) | |
  30. TABLE 16 North America Returnable Packaging Market Size, by Product Type, 2021–2035 (USD Billion) | |
  31. TABLE 17 North America Returnable Packaging Market Size, by End-User Industry, 2021–2035 (USD Billion) | |
  32. TABLE 18 Europe Returnable Packaging Market Size, by Material, 2021–2035 (USD Billion) | |
  33. TABLE 19 Europe Returnable Packaging Market Size, by Product Type, 2021–2035 (USD Billion) | |
  34. TABLE 20 Europe Returnable Packaging Market Size, by End-User Industry, 2021–2035 (USD Billion) | |
  35. TABLE 21 Asia-Pacific Returnable Packaging Market Size, by Material, 2021–2035 (USD Billion) | |
  36. TABLE 22 Asia-Pacific Returnable Packaging Market Size, by Product Type, 2021–2035 (USD Billion) | |
  37. TABLE 23 Asia-Pacific Returnable Packaging Market Size, by End-User Industry, 2021–2035 (USD Billion) | |
  38. TABLE 24 South America Returnable Packaging Market Size, by Material, 2021–2035 (USD Billion) | |
  39. TABLE 25 South America Returnable Packaging Market Size, by Product Type, 2021–2035 (USD Billion) | |
  40. TABLE 26 Middle East & Africa Returnable Packaging Market Size, by Material, 2021–2035 (USD Billion) | |
  41. TABLE 27 Middle East & Africa Returnable Packaging Market Size, by Product Type, 2021–2035 (USD Billion) | |
  42. TABLE 28 US Returnable Packaging Market Size, by Product Type, 2021–2035 (USD Billion) | |
  43. TABLE 29 Germany Returnable Packaging Market Size, by End-User Industry, 2021–2035 (USD Billion) | |
  44. TABLE 30 China Returnable Packaging Market Size, by Product Type, 2021–2035 (USD Billion) | |
  45. TABLE 31 India Returnable Packaging Market Size, by End-User Industry, 2021–2035 (USD Billion) | |
  46. TABLE 32 Competitive Benchmarking Matrix – Global Returnable Packaging Market, 2026 | |
  47. TABLE 33 Company Profiles – Key Players, Global Returnable Packaging Market | |
  48. TABLE 34 Recent Developments & Strategic Announcements, 2023–2025 | |
  49. TABLE 35 Report Scope & Methodology Summary | |
  50. TABLE 36 Detailed Sources & Citations Index | | LIST OF FIGURES | |
  51. FIGURE 1 Global Returnable Packaging Market – Market Dynamics Overview (Drivers, Restraints, Opportunities) | |
  52. FIGURE 2 Industry Value Chain Analysis – Returnable Asset Lifecycle | |
  53. FIGURE 3 Porter's Five Forces Analysis | |
  54. FIGURE 4 Global Market Size Trend & Forecast, 2021–2035 (USD Billion) | |
  55. FIGURE 5 Year-over-Year Growth Rate Trend, 2022–2035 (%) | |
  56. FIGURE 6 Market Share by Material, 2025 vs 2035 (%) | |
  57. FIGURE 7 Market Share by Product Type, 2025 (%) | |
  58. FIGURE 8 Market Share by End-User Industry, 2025 (%) | |
  59. FIGURE 9 Market Share by Ownership Model, 2025 vs 2035 (%) | |
  60. FIGURE 10 Regional Market Share, 2025 (%) | |
  61. FIGURE 11 Regional CAGR Comparison, 2026–2035 (%) | |
  62. FIGURE 12 North America Country-Level Share Distribution, 2025 (%) | |
  63. FIGURE 13 Europe Country-Level Share Distribution, 2025 (%) | |
  64. FIGURE 14 Asia-Pacific Country-Level Growth Comparison, 2026–2035 | |
  65. FIGURE 15 Competitive Landscape – Market Concentration Map, 2026 | |
  66. FIGURE 16 Competitive Positioning Matrix – Fleet Density vs Digital Capability | |
  67. FIGURE 17 Driver Impact Ranking, 2026–2035 | |
  68. FIGURE 18 Restraint Impact Ranking, 2026–2035

Segmentation Quick Reference

DimensionSub-SegmentsDominant SegmentFastest Growing Segment
By MaterialPlastic, Metal, Wood, Composite, GlassPlasticComposite
By Product TypePallets, Crates, Intermediate Bulk Containers, Drums and Barrels, Dunnage and Racks, Totes and BinsPalletsIntermediate Bulk Containers
By End-User IndustryAutomotive, Consumer Durables, Food and Beverage, Healthcare and Pharmaceuticals, Retail and E-commerce, Chemicals and IndustrialFood and BeverageHealthcare and Pharmaceuticals
By Ownership ModelPooled/Leased, Company-Owned Assets, Hybrid Managed ServicesCompany-Owned AssetsHybrid Managed Services
By RegionNorth America, Europe, Asia-Pacific, South America, Middle East & AfricaNorth AmericaAsia-Pacific


Market Segmentation Overview

By Material

Sub-SegmentKey Trend
PlasticRecycled-content HDPE and PP formulations scaling ahead of regulatory thresholds
MetalSteel and aluminium racking redesigned for battery and e-axle geometries
WoodPallet pools shifting toward heat-treated and repair-optimised designs
CompositeGlass-reinforced laminates extending service life past twelve years
GlassReturnable bottle systems stable in beverage markets with deposit infrastructure


Material choice ultimately reflects a trade-off between unit cost, trip count, and load requirement. Plastic wins on rotation economics, metal on load rating and durability, wood on initial affordability. Composite is displacing plastic at the premium end where cost per trip governs procurement rather than acquisition price.

By Product Type

Sub-SegmentKey Trend
PalletsPooling penetration deepening; RFID serialisation becoming standard specification
CratesFoldable and nestable designs reducing empty-return transport volume
Intermediate Bulk ContainersReconditioning networks expanding under tightening hazardous-goods documentation
Drums and BarrelsClosed-loop programmes replacing single-trip industrial containers
Dunnage and RacksBespoke tooling cycles driven by electrification platform launches
Totes and BinsAutomated fulfilment mandating dimensionally stable, robot-compatible formats


Product mix is diverging by handling environment. Automated nodes pull demand toward rigid, uniform totes and pallets, while manual and export-heavy lanes favour foldable crates that minimise empty-return cube. Bespoke dunnage remains the highest-value category per unit.

By End-User Industry

Sub-SegmentKey Trend
AutomotiveEV platform transitions triggering broad dunnage tooling replacement cycles
Consumer DurablesAppliance makers converting to reusable protective inserts and frames
Food and BeverageHygiene validation and high rotation frequency sustaining conversion momentum
Healthcare and PharmaceuticalsValidated reusable cold shippers replacing single-use insulated boxes
Retail and E-commerceConsolidated return hubs enabling reusable tote deployment at scale
Chemicals and IndustrialDocumented closed-loop container programmes becoming a procurement requirement


End-user economics vary sharply by rotation frequency and unit value. Food and beverage delivers volume through frequent turns, healthcare delivers margin through high specification, and automotive delivers both scale and engineering complexity that sustains supplier pricing power.

By Ownership Model

Sub-SegmentKey Trend
Pooled/LeasedSubscription pricing widening access for mid-sized and seasonal shippers
Company-Owned AssetsRetained where bespoke geometry or IP protection prevents pooling
Hybrid Managed ServicesOutsourced wash, repair, and repositioning paired with owned fleets


Ownership structure is increasingly a financing decision rather than an operational one. Shippers weigh balance-sheet treatment against control over asset specification, and hybrid arrangements have emerged precisely because they let organisations separate those two questions instead of resolving them together.




Download PDF ×

We do not share your information with anyone. However, we may send you emails based on your report interest from time to time. You may contact us at any time to opt-out.