ID: MRFR/PNT/5428-HCR | February 2021 | Region: Global | 100 pages
Market Synopsis of Global Returnable Packaging Market
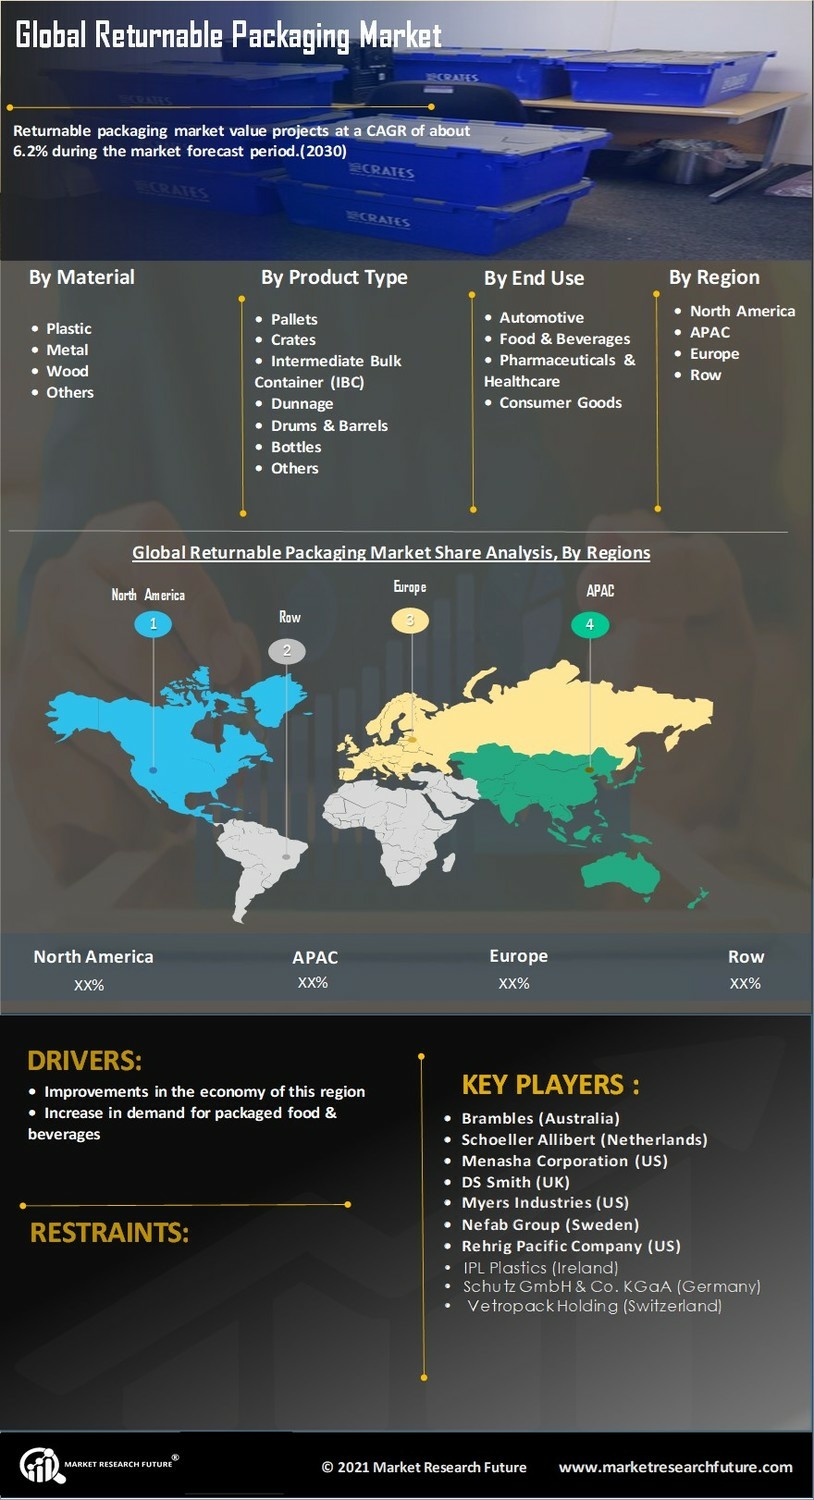
Returnable packaging is also termed as reusable packaging that is made of durable materials like polypropylene and corrugated plastics. It is designed for multiple trips and has extended shelf-life. Various features associated with returnable packaging are cost effectiveness, improved product safety and reusability. Returnable packaging is used in various end-use industries such as food & beverages, automotive, pharmaceuticals & healthcare, and consumer goods. Geographically, the global market for returnable packaging has been divided into four major regions — North America, Europe, Asia-Pacific, and the rest of the world. European region accounted for the largest market share, in 2017, followed by the North America and Asia-Pacific. Factors affecting the growth of this market are increased awareness about sustainable packaging and strong industrial base in this region. In addition, improvements in the economy of this region and increase in demand for packaged food & beverages driving the growth of the market.
Europe is expected to grow at the highest CAGR during the forecast period. Increasing awareness to reduce packaging waste and demand for bulk transportation are the major driving factors. North America is expected to be the fast growing market during the forecast period. Rapidly expanding consumer markets and abundantly available natural resources are the major factors driving the market in this region. In Asia-pacific, China and India are expected to contribute significantly during the forecast period mainly due to rapid growth in industrialization and manufacturing activities. In rest of the world, the Middle East & Africa is expected to grow due to increasing demand from food & beverage and consumer goods in Middle East and manufacturing sector in Africa. Global Returnable Packaging Market, By Segment
For the purpose of analysis, the global returnable packaging market has been divided on the basis of four segments: material, product type, end-use, and region. On the basis of material, the market has been segmented into plastic, metal, wood, and others. Under the material segment, plastic accounts for the largest market share. Plastic returnable packaging is preferred due to their extensive flexibility, reusability and cost effectiveness.
On the basis of product type, the market has been segmented as follows: pallets, crates, intermediate bulk containers (IBC), dunnage, drums & barrels, bottles and others. IBC containers to dominate the product type segment of the market and the same is expected to grow at the highest CAGR during the forecast period. Rise in demand from various end-use applications like food & beverages and petroleum & lubricants is driving the growth of this segment. IBC’s are preferred due various features such as high strength, durability and long span. Pallets segment is expected to contribute significantly during the forecast period mainly due to increase in demand for consumer goods.
On the basis of end-use, the market has been segmented as automotive, food & beverages, pharmaceuticals & healthcare, and consumer goods. Automotive dominates the end-use segment and is expected to grow at a highest CAGR during the forecast period. Increased us of returnable containers by automotive manufactures to transport different parts of automotive components to suppliers and the need for cost reduction for automotive manufactures to handle competition are the factors driving the growth of the market. Food & beverages segment is also expected to contribute significantly during the forecast period mainly due to increase in demand for storage and transportation of bulk food products and various beverages.
Hence, the global returnable packaging market is expected to grow at a CAGR of 5.8% during the forecast period.
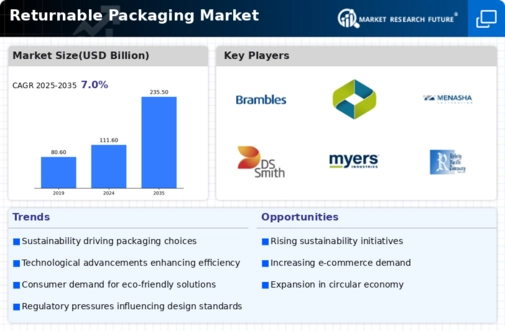
The prominent players in the returnable packaging market include Brambles (Australia), Schoeller Allibert (Netherlands), Menasha Corporation (US), DS Smith (UK), Myers Industries (US), Nefab Group (Sweden), Rehrig Pacific Company (US), IPL Plastics (Ireland), Schutz GmbH & Co. KGaA (Germany), and Vetropack Holding (Switzerland) among others.
Intended Audience:
End-Users
Government Associations
Research Institutes
Distribution vendors
Technology Innovators
Manufacturers
Frequently Asked Questions (FAQ) :
The global returnable packaging market is recorded a substantial market valuation by 2023.
The global returnable packaging market is projected to register a moderate 5.8% CAGR in the forecast period.
The plastic segment is slated to expand as the fastest-growing segment.
The pharmaceutical and healthcare segment is slated to expand as the fastest-growing segment.
A few major market players operating in the global returnable packaging market are Menasha Corporation (US), Brambles (Australia), Schoeller Allibert (Netherlands), DS Smith (UK), among others.
TABLE OF CONTENTS
1 Executive Summary
2 Scope of the Report
2.1 Market Definition
2.2 Scope of the Study
2.2.1 Definition
2.2.2 Research Objective
2.2.3 Assumptions
2.2.4 Limitations
2.3 Research Process
2.3.1 Primary Research
2.3.2 Secondary Research
2.4 Market size Estimation
2.5 Forecast Model
3 Market Landscape
3.1 Porter’s Five Forces Analysis
3.1.1 Threat of New Entrants
3.1.2 Bargaining power of buyers
3.1.3 Threat of substitutes
3.1.4 Segment rivalry
3.1.5 Bargaining Power of Buyers
3.2 Value Chain/Supply Chain Analysis
4 Market Dynamics
4.1 Introduction
4.2 Market Drivers
4.3 Market Restraints
4.4 Market Opportunities
4.5 Market Trends
5 Global Returnable Packaging Market, By Material
5.1 Introduction
5.2 Plastic
5.2.1 Market Estimates & Forecast, 2018–2023
5.2.2 Market Estimates & Forecast, by Region, 2018–2023
5.3 Metal
5.3.1 Market Estimates & Forecast, 2018–2023
5.3.2 Market Estimates & Forecast, by Region, 2018–2023
5.4 Wood
5.4.1 Market Estimates & Forecast, 2018–2023
5.4.2 Market Estimates & Forecast, by Region, 2018–2023
5.5 Others
5.5.1 Market Estimates & Forecast, 2018–2023
5.5.2 Market Estimates & Forecast, by Region, 2018–2023
6 Global Returnable Packaging Market, By Product Type
6.1 Introduction
6.2 Pallets
6.2.1 Market Estimates & Forecast, 2018–2023
6.2.2 Market Estimates & Forecast, by Region, 2018–2023
6.3 Crates
6.3.1 Market Estimates & Forecast, 2018–2023
6.3.2 Market Estimates & Forecast, by Region, 2018–2023
6.4 Intermediate Bulk Container (IBC)
6.4.1 Market Estimates & Forecast, 2018–2023
6.4.2 Market Estimates & Forecast, by Region, 2018–2023
6.5 Dunnage
6.5.1 Market Estimates & Forecast, 2018–2023
6.5.2 Market Estimates & Forecast, by Region, 2018–2023
6.6 Drums & Barrels
6.6.1 Market Estimates & Forecast, 2018–2023
6.6.2 Market Estimates & Forecast, by Region, 2018–2023
6.7 Bottles
6.7.1 Market Estimates & Forecast, 2018–2023
6.7.2 Market Estimates & Forecast, by Region, 2018–2023
6.8 Others
6.8.1 Market Estimates & Forecast, 2018–2023
6.8.2 Market Estimates & Forecast, by Region, 2018–2023
7 Global Returnable Packaging Market, By End–use
7.1 Introduction
7.2 Automotive
7.2.1 Market Estimates & Forecast, 2018–2023
7.2.2 Market Estimates & Forecast, by Region, 2018–2023
7.3 Food & Beverages
7.3.1 Market Estimates & Forecast, 2018–2023
7.3.2 Market Estimates & Forecast, by Region, 2018–2023
7.4 Pharmaceuticals & Healthcare
7.4.1 Market Estimates & Forecast, 2018–2023
7.4.2 Market Estimates & Forecast, by Region, 2018–2023
7.5 Consumer goods
7.5.1 Market Estimates & Forecast, 2018–2023
7.5.2 Market Estimates & Forecast, by Region, 2018–2023
9 Global Returnable Packaging Market, By Region
9.1 Introduction
9.2 North America
9.2.1 Market Estimates & Forecast, 2018–2023
9.2.2 Market Estimates & Forecast, by Material, 2018–2023
9.2.3 Market Estimates & Forecast, by Product Type, 2018–2023
9.2.4 Market Estimates & Forecast, by End–use, 2018–2023
9.2.5 US
9.2.5.1 Market Estimates & Forecast, 2018–2023
9.2.5.2 Market Estimates & Forecast, by Material, 2018–2023
9.2.5.3 Market Estimates & Forecast, by Product Type, 2018–2023
9.2.5.4 Market Estimates & Forecast, by End–use, 2018–2023
9.2.6 Canada
9.2.6.1 Market Estimates & Forecast, 2018–2023
9.2.6.2 Market Estimates & Forecast, by Material, 2018–2023
9.2.6.3 Market Estimates & Forecast, by Product Type, 2018–2023
9.2.6.4 Market Estimates & Forecast, by End–use, 2018–2023
9.3 Europe
9.3.1 Market Estimates & Forecast, 2018–2023
9.3.2 Market Estimates & Forecast, by Material, 2018–2023
9.3.3 Market Estimates & Forecast, by Product Type, 2018–2023
9.3.4 Market Estimates & Forecast, by End–use, 2018–2023
9.3.5 UK
9.3.5.1 Market Estimates & Forecast, 2018–2023
9.3.5.2 Market Estimates & Forecast, by Material, 2018–2023
9.2.5.3 Market Estimates & Forecast, by Product Type, 2018–2023
9.2.5.4 Market Estimates & Forecast, by End–use, 2018–2023
9.3.6 Germany
9.3.6.1 Market Estimates & Forecast, 2018–2023
9.3.6.2 Market Estimates & Forecast, by Material, 2018–2023
9.3.6.3 Market Estimates & Forecast, by Product Type, 2018–2023
9.3.6.4 Market Estimates & Forecast, by End–use, 2018–2023
9.3.7 France
9.3.7.1 Market Estimates & Forecast, 2018–2023
9.3.7.2 Market Estimates & Forecast, by Material, 2018–2023
9.3.7.3 Market Estimates & Forecast, by Product Type, 2018–2023
9.3.7.4 Market Estimates & Forecast, by End–use, 2018–2023
9.3.8 Italy
9.3.9.1 Market Estimates & Forecast, 2018–2023
9.3.9.2 Market Estimates & Forecast, by Material, 2018–2023
9.3.9.3 Market Estimates & Forecast, by Product Type, 2018–2023
9.3.9.4 Market Estimates & Forecast, by End–use, 2018–2023
9.3.9 Rest of Europe
9.3.9.1 Market Estimates & Forecast, 2018–2023
9.3.9.2 Market Estimates & Forecast, by Material, 2018–2023
9.3.9.3 Market Estimates & Forecast, by Product Type, 2018–2023
9.3.9.4 Market Estimates & Forecast, by End–use, 2018–2023
9.4 Asia Pacific
9.4.1 Market Estimates & Forecast, 2018–2023
9.4.2 Market Estimates & Forecast, by Material, 2018–2023
9.4.3 Market Estimates & Forecast, by Product Type, 2018–2023
9.4.4 Market Estimates & Forecast, by End–use, 2018–2023
9.4.5 China
9.4.5.1 Market Estimates & Forecast, 2018–2023
9.4.5.2 Market Estimates & Forecast, by Material, 2018–2023
9.4.5.3 Market Estimates & Forecast, by Product Type, 2018–2023
9.4.5.4 Market Estimates & Forecast, by End–use, 2018–2023
9.4.6 Japan
9.4.6.1 Market Estimates & Forecast, 2018–2023
9.4.6.2 Market Estimates & Forecast, by Material, 2018–2023
9.4.6.3 Market Estimates & Forecast, by Product Type, 2018–2023
9.4.6.4 Market Estimates & Forecast, by End–use, 2018–2023
9.4.7 India
9.4.7.1 Market Estimates & Forecast, 2018–2023
9.4.7.2 Market Estimates & Forecast, by Material, 2018–2023
9.4.7.3 Market Estimates & Forecast, by Product Type 2018–2023
9.4.7.4 Market Estimates & Forecast, by End–use 2018–2023
9.4.8 Rest of Asia Pacific
9.4.9.1 Market Estimates & Forecast, 2018–2023
9.4.9.2 Market Estimates & Forecast, by Material, 2018–2023
9.4.9.3 Market Estimates & Forecast, by Product Type, 2018–2023
9.4.9.4 Market Estimates & Forecast, by End–use, 2018–2023
9.5 Rest of the World
9.5.1 Market Estimates & Forecast, 2018–2023
9.5.2 Market Estimates & Forecast, by Material, 2018–2023
9.5.3 Market Estimates & Forecast, by Product Type, 2018–2023
9.5.4 Market Estimates & Forecast, by End–use, 2018–2023
10 Competitive Landscape
11 Company Profile
11.1 Brambles (Australia)
11.1.1 Company Overview
11.1.2 Products/Services Offering
11.1.3 Financial Overview
11.1.4 Key Developments
11.1.5 Strategy
11.1.6 SWOT Analysis
11.2 Schoeller Allibert (Netherlands)
11.2.1 Company Overview
11.2.2 Products/Services Offering
11.2.3 Financial Overview
11.2.4 Key Developments
11.2.5 Strategy
11.2.6 SWOT Analysis
11.3 Menasha Corporation (US)
11.3.1 Company Overview
11.3.2 Products/Services Offering
11.3.3 Financial Overview
11.3.4 Key Developments
11.3.5 Strategy
11.3.6 SWOT Analysis
11.4 DS Smith (UK)
11.4.1 Company Overview
11.4.2 Products/Services Offering
11.4.3 Financial Overview
11.4.4 Key Developments
11.4.5 Strategy
11.4.6 SWOT Analysis
11.5 Myers Industries (US)
11.5.1 Company Overview
11.5.2 Products/Services Offering
11.5.3 Financial Overview
11.5.4 Key Developments
11.5.5 Strategy
11.5.6 SWOT Analysis
11.6 Nefab Group (Sweden)
11.6.1 Company Overview
11.6.2 Products/Services Offering
11.6.3 Financial Overview
11.6.4 Key Developments
11.6.5 Strategy
11.6.6 SWOT Analysis
11.7 Rehrig Pacific Company (US)
11.7.1 Company Overview
11.7.2 Products/Services Offering
11.7.3 Financial Overview
11.7.4 Key Developments
11.7.5 Strategy
11.7.6 SWOT Analysis
11.8 IPL Plastics (Ireland)
11.8.1 Company Overview
11.8.2 Products/Services Offering
11.8.3 Financial Overview
11.8.4 Key Developments
11.8.5 Strategy
11.8.6 SWOT Analysis
11.9 Schutz GmbH & Co. KGaA (Germany)
11.9.1 Company Overview
11.9.2 Products/Services Offering
11.9.3 Financial Overview
11.9.4 Key Developments
11.9.5 Strategy
11.9.6 SWOT Analysis
11.10 Vetropack Holding (Switzerland)
11.10.1 Company Overview
11.10.2 Products/Services Offering
11.10.3 Financial Overview
11.10.4 Key Developments
11.10.5 Strategy
11.10.6 SWOT Analysis
LIST OF TABLES
Table 1 Global Returnable Packaging Market, by Region, 2018–2023
Table 2 North America: Returnable Packaging Market, by Country, 2018–2023
Table 3 Europe: Returnable Packaging Market, by Country, 2018–2023
Table 4 Asia Pacific: Returnable Packaging Market, by Country, 2018–2023
Table 5 RoW: Returnable Packaging Market, by Country, 2018–2023
Table 6 Global Returnable Packaging Market, by Material, by Regions, 2018–2023
Table 7 North America: Returnable Packaging Market, by Material, by Country, 2018–2023
Table 8 Europe: Returnable Packaging Market, by Material, by Country, 2018–2023
Table 9 Asia Pacific: Returnable Packaging Market by Material, by Country, 2018–2023
Table 10 RoW: Returnable Packaging Market by Material, by Country, 2018–2023
Table 11 Global Returnable Packaging by Product Type Market, by Region, 2018–2023
Table 12 North America: Returnable Packaging Market by Product Type, by Country, 2018–2023
Table 13 Europe: Returnable Packaging Market by Product Type, by Country, 2018–2023
Table 14 Asia Pacific: Returnable Packaging Market by Product Type, by Country, 2018–2023
Table 15 RoW: Returnable Packaging Market by Product Type: by Country, 2018–2023
Table 16 Global Returnable Packaging by End–use Market, by Region, 2018–2023
Table 17 North America: Returnable Packaging Market by End–use, by Country, 2018–2023
Table 18 Europe: Returnable Packaging Market by End–use, by Country, 2018–2023
Table 19 Asia Pacific: Returnable Packaging Market by End–use, by Country, 2018–2023
Table 20 RoW: Returnable Packaging Market by End–use, by Country, 2018–2023
Table 21 Global Returnable Packaging Market, by Region, 2018–2023
Table 22 Global Returnable Packaging Market, by Material, 2018–2023
Table 23 Global Returnable Packaging Market, by Product Type, 2018–2023
Table 24 Global Returnable Packaging Market, by End–use, 2018–2023
Table 25 North America: Returnable Packaging Market, by Country
Table 26 North America: Returnable Packaging Market, by Material
Table 27 North America: Returnable Packaging Market, by Product Type
Table 28 North America: Returnable Packaging Market, by End–use
Table 29 Europe: Returnable Packaging Market, by Country
Table 30 Europe: Returnable Packaging Market, by Material
Table 31 Europe: Returnable Packaging Market, by Product Type
Table 32 Europe: Returnable Packaging Market, by End–use
Table 33 Asia Pacific: Returnable Packaging Market, by Country
Table 32 Asia Pacific: Returnable Packaging Market, by Material
Table 35 Asia Pacific: Returnable Packaging Market, by Product Type
Table 36 Asia Pacific: Returnable Packaging Market, by End–use
Table 37 RoW: Returnable Packaging Market, by Region
Table 38 RoW: Returnable Packaging Market, by Material
Table 39 RoW: Returnable Packaging Market, by Product Type
Table 40 RoW: Returnable Packaging Market, by End–use
LIST OF FIGURES
FIGURE 1 Research Process of MRFR
FIGURE 2 Top down & Bottom up Approach
FIGURE 3 Market Dynamics
FIGURE 4 Impact analysis: market drivers
FIGURE 5 Impact analysis: market restraints
FIGURE 6 Porter’s five forces analysis
FIGURE 7 Value chain analysis
FIGURE 8 Global Returnable Packaging Market share, by Material, 2016 (%)
FIGURE 9 Global Returnable Packaging Market, by Material, 2015–2023 (USD MILLION)
FIGURE 12 Global Returnable Packaging Market share, by Product Type, 2016 (%)
FIGURE 13 Global Returnable Packaging Market, by Product Type, 2015–2023 (USD MILLION)
FIGURE 14 Global Returnable Packaging Market share, by End–use, 2016 (%)
FIGURE 15 Global Returnable Packaging Market, by End–use, 2015–2023 (USD MILLION
FIGURE 16 Global Returnable Packaging Market share (%), by Region, 2016
FIGURE 17 Global Returnable Packaging Market, by Region, 2015–2023 (USD MILLION)
FIGURE 18 North America: Returnable Packaging Market share (%), 2016
FIGURE 19 North America: Returnable Packaging Market by Country, 2015–2023 (USD MILLION)
FIGURE 20 Europe: Returnable Packaging Market share (%), 2016
FIGURE 21 Europe: Returnable Packaging Market by Country, 2015–2023 (USD MILLION)
FIGURE 22 Asia Pacific: Returnable Packaging Market share (%), 2016
FIGURE 23 Asia Pacific: Returnable Packaging Market by Country, 2015–2023 (USD MILLION)
FIGURE 24 Rest of the World: Returnable Packaging Market share (%), 2016
FIGURE 25 Rest of the World: Returnable Packaging Market by Country, 2015–2023 (USD MILLION)