ID: MRFR/SEM/2097-CR | 78 Pages | Author: Ankit Gupta | August 2017
1 MARKET INTRODUCTION
1.1 INTRODUCTION
1.2 SCOPE OF STUDY
1.2.1 RESEARCH OBJECTIVE
1.2.2 ASSUMPTIONS
1.2.3 LIMITATIONS
1.3 MARKET STRUCTURE
2 RESEARCH METHODOLOGY
2.1 RESEARCH NETWORK TYPE
2.2 PRIMARY RESEARCH
2.3 SECONDARY RESEARCH
2.4 FORECAST MODEL
2.4.1 MARKET DATA COLLECTION, ANALYSIS & FORECAST
2.4.2 MARKET SIZE ESTIMATION
3 MARKET DYNAMICS
3.1 INTRODUCTION
3.2 MARKET DRIVERS
3.3 MARKET CHALLENGES
3.4 MARKET OPPORTUNITIES
3.5 MARKET RESTRAINTS
4 EXECUTIVE SUMMARY
5 MARKET FACTOR ANALYSIS
5.1 PORTER’S FIVE FORCES ANALYSIS
5.2 SUPPLY CHAIN ANALYSIS
6 GLOBAL QLED MARKET, BY SEGMENTS
6.1 INTRODUCTION
6.2 MARKET STATISTICS
6.2.1 BY COMPONENT
6.2.1.1 TUBE
6.2.1.2 FILMS
6.2.1.3 LED
6.2.2 BY TYPE
6.2.2.1 QLED
6.2.2.2 QDEF
6.2.3 BY APPLICATION
6.2.3.1 TV
6.2.3.2 MONITOR
6.2.3.3 SMARTPHONES
6.2.3.4 TABLETS
6.2.4 BY GEOGRAPHY
6.2.4.1 NORTH AMERICA
6.2.4.2 EUROPE
6.2.4.3 ASIA-PACIFIC
6.2.4.4 REST OF THE WORLD
7 COMPETITIVE ANALYSIS
7.1 MARKET SHARE ANALYSIS
7.2 COMPANY PROFILES
7.2.1 SONY CORPORATION (JAPAN)
7.2.2 ALTAIRNANO (U.S.)
7.2.3 EVIDENT TECHNOLOGIES INC (U.S.)
7.2.4 LG DISPLAY (SOUTH KOREA)
7.2.5 SAMSUNG ELECTRONICS CO. LTD (SOUTH KOREA)
7.2.6 MICROVISION INC (U.S.)
7.2.7 QUANTUM MATERIALS CORPORATION (U.S)
7.2.8 OTHERS
8 List of Tables
TABLE 1 QLED MARKET, BY COMPONENT
TABLE 2 QLED MARKET, BY TYPE
TABLE 3 QLED MARKET, BY APPLICATION
TABLE 4 QLED MARKET, BY GEOGRAPHY
TABLE 5 NORTH AMERICA QLED MARKET, BY COMPONENT
TABLE 6 NORTH AMERICA QLED MARKET, BY TYPE
TABLE 7 NORTH AMERICA QLED MARKET, BY APPLICATION
TABLE 8 U.S QLED MARKET, BY COMPONENT
TABLE 9 U.S. QLED MARKET, BY TYPE
TABLE 10 U.S QLED MARKET, BY APPLICATION
TABLE 11 CANADA QLED MARKET, BY COMPONENT
TABLE 12 CANADA QLED MARKET, BY TYPE
TABLE 13 CANADA QLED MARKET, BY APPLICATION
TABLE 14 EUROPE QLED MARKET, BY COMPONENT
TABLE 15 EUROPE QLED MARKET, BY TYPE
TABLE 16 EUROPE QLED MARKET, BY APPLICATION
TABLE 17 GERMANY QLED MARKET, BY COMPONENT
TABLE 18 GERMANY QLED MARKET, BY TYPE
TABLE 19 GERMANY QLED MARKET, BY APPLICATION
TABLE 20 FRANCE QLED MARKET, BY COMPONENT
TABLE 21 FRANCE QLED MARKET, BY TYPE
TABLE 22 FRANCE QLED MARKET, BY APPLICATION
TABLE 23 U.K. QLED MARKET, BY COMPONENT
TABLE 24 U.K. QLED MARKET, BY TYPE
TABLE 25 U.K. QLED MARKET, BY APPLICATION
TABLE 26 REST OF EUROPE QLED MARKET, BY COMPONENT
TABLE 27 REST OF EUROPE QLED MARKET, BY TYPE
TABLE 28 REST OF EUROPE QLED MARKET, BY APPLICATION
TABLE 29 ASIA-PACIFIC QLED MARKET, BY COMPONENT
TABLE 30 ASIA-PACIFIC QLED MARKET, BY TYPE
TABLE 31 ASIA-PACIFIC QLED MARKET, BY APPLICATION
TABLE 32 REST OF THE WORLD QLED MARKET, BY COMPONENT
TABLE 33 REST OF THE WORLD QLED MARKET, BY TYPE
TABLE 34 REST OF THE WORLD QLED MARKET, BY APPLICATION
9 List of Figures
FIGURE 1 RESEARCH METHODOLOGY
FIGURE 2 QLED MARKET, BY COMPONENT (%)
FIGURE 3 QLED MARKET, BY TYPE (%)
FIGURE 4 QLED MARKET, BY APPLICATION (%)
FIGURE 5 QLED MARKET, BY REGIONS (%)
FIGURE 6 NORTH AMERICA QLED MARKET, BY COMPONENT (%)
FIGURE 7 NORTH AMERICA QLED MARKET, BY TYPE (%)
FIGURE 8 NORTH AMERICA QLED MARKET, BY APPLICATION (%)
FIGURE 9 EUROPE QLED MARKET, BY COMPONENT (%)
FIGURE 10 EUROPE QLED MARKET, BY TYPE (%)
FIGURE 11 EUROPE QLED MARKET, BY APPLICATION (%)
FIGURE 12 ASIA-PACIFIC QLED MARKET, BY COMPONENT (%)
FIGURE 13 ASIA-PACIFIC QLED MARKET, BY TYPE (%)
FIGURE 14 ASIA-PACIFIC QLED MARKET, BY APPLICATION (%)
FIGURE 15 REST OF THE WORLD QLED MARKET, BY COMPONENT (%)
FIGURE 16 REST OF THE WORLD QLED MARKET, BY TYPE (%)
FIGURE 17 REST OF THE WORLD QLED MARKET, BY APPLICATION (%)
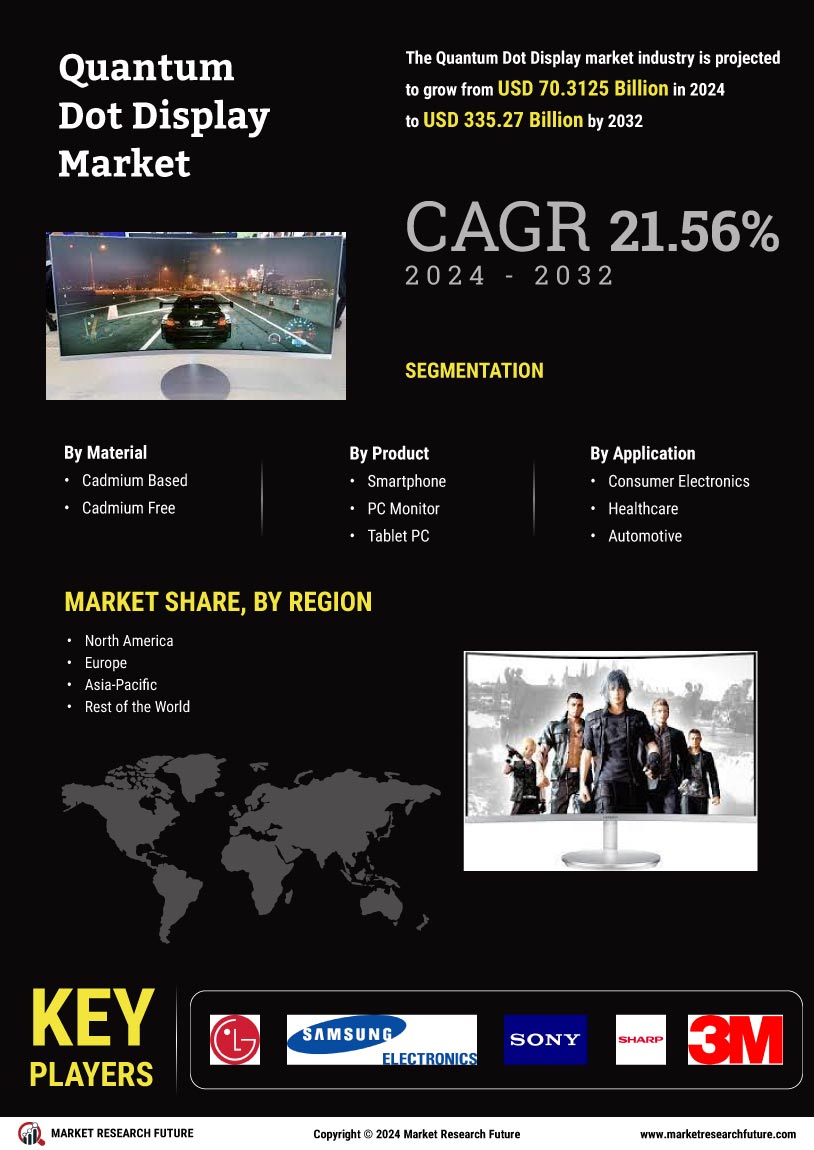
Quantum Dot Display Market Segmentation
Quantum Dot Display Material Outlook (USD Billion, 2018-2032)
Cadmium Based
Cadmium Free
Quantum Dot Display Product Outlook (USD Billion, 2018-2032)
Smartphones
PC Monitor
Tablet PC
TV
Quantum Dot Display Application Outlook (USD Billion, 2018-2032)
Consumer Electronics
Healthcare
Automotive
IT & Telecommunication
Quantum Dot Display Regional Outlook (USD Billion, 2018-2032)
North America Outlook (USD Billion, 2018-2032)
North America Quantum Dot Display by Material
Cadmium Based
Cadmium Free
North America Quantum Dot Display by Product
Smartphones
PC Monitor
Tablet PC
TV
North America Quantum Dot Display by Application
Consumer Electronics
Healthcare
Automotive
IT & Telecommunication
US Outlook (USD Billion, 2018-2032)
US Quantum Dot Display by Material
Cadmium Based
Cadmium Free
US Quantum Dot Display by Product
Smartphones
PC Monitor
Tablet PC
TV
US Quantum Dot Display by Application
Consumer Electronics
Healthcare
Automotive
IT & Telecommunication
CANADA Outlook (USD Billion, 2018-2032)
CANADA Quantum Dot Display by Material
Cadmium Based
Cadmium Free
CANADA Quantum Dot Display by Product
Smartphones
PC Monitor
Tablet PC
TV
CANADA Quantum Dot Display by Application
Consumer Electronics
Healthcare
Automotive
IT & Telecommunication
Europe Outlook (USD Billion, 2018-2032)
Europe Quantum Dot Display by Material
Cadmium Based
Cadmium Free
Europe Quantum Dot Display by Product
Smartphones
PC Monitor
Tablet PC
TV
Europe Quantum Dot Display by Application
Consumer Electronics
Healthcare
Automotive
IT & Telecommunication
Germany Outlook (USD Billion, 2018-2032)
Germany Quantum Dot Display by Material
Cadmium Based
Cadmium Free
Germany Quantum Dot Display by Product
Smartphones
PC Monitor
Tablet PC
TV
Germany Quantum Dot Display by Application
Consumer Electronics
Healthcare
Automotive
IT & Telecommunication
France Outlook (USD Billion, 2018-2032)
France Quantum Dot Display by Material
Cadmium Based
Cadmium Free
France Quantum Dot Display by Product
Smartphones
PC Monitor
Tablet PC
TV
France Quantum Dot Display by Application
Consumer Electronics
Healthcare
Automotive
IT & Telecommunication
UK Outlook (USD Billion, 2018-2032)
UK Quantum Dot Display by Material
Cadmium Based
Cadmium Free
UK Quantum Dot Display by Product
Smartphones
PC Monitor
Tablet PC
TV
UK Quantum Dot Display by Application
Consumer Electronics
Healthcare
Automotive
IT & Telecommunication
ITALY Outlook (USD Billion, 2018-2032)
ITALY Quantum Dot Display by Material
Cadmium Based
Cadmium Free
ITALY Quantum Dot Display by Product
Smartphones
PC Monitor
Tablet PC
TV
ITALY Quantum Dot Display by Application
Consumer Electronics
Healthcare
Automotive
IT & Telecommunication
SPAIN Outlook (USD Billion, 2018-2032)
Spain Quantum Dot Display by Material
Cadmium Based
Cadmium Free
Spain Quantum Dot Display by Product
Smartphones
PC Monitor
Tablet PC
TV
Spain Quantum Dot Display by Application
Consumer Electronics
Healthcare
Automotive
IT & Telecommunication
Rest Of Europe Outlook (USD Billion, 2018-2032)
Rest Of Europe Quantum Dot Display by Material
Cadmium Based
Cadmium Free
Rest Of Europe Quantum Dot Display by Product
Smartphones
PC Monitor
Tablet PC
TV
Rest Of Europe Quantum Dot Display by Application
Consumer Electronics
Healthcare
Automotive
IT & Telecommunication
Asia-Pacific Outlook (USD Billion, 2018-2032)
Asia-Pacific Quantum Dot Display by Material
Cadmium Based
Cadmium Free
Asia-Pacific Quantum Dot Display by Product
Smartphones
PC Monitor
Tablet PC
TV
Asia-Pacific Quantum Dot Display by Application
Consumer Electronics
Healthcare
Automotive
IT & Telecommunication
China Outlook (USD Billion, 2018-2032)
China Quantum Dot Display by Material
Cadmium Based
Cadmium Free
China Quantum Dot Display by Product
Smartphones
PC Monitor
Tablet PC
TV
China Quantum Dot Display by Application
Consumer Electronics
Healthcare
Automotive
IT & Telecommunication
Japan Outlook (USD Billion, 2018-2032)
Japan Quantum Dot Display by Material
Cadmium Based
Cadmium Free
Japan Quantum Dot Display by Product
Smartphones
PC Monitor
Tablet PC
TV
Japan Quantum Dot Display by Application
Consumer Electronics
Healthcare
Automotive
IT & Telecommunication
India Outlook (USD Billion, 2018-2032)
India Quantum Dot Display by Material
Cadmium Based
Cadmium Free
India Quantum Dot Display by Product
Smartphones
PC Monitor
Tablet PC
TV
India Quantum Dot Display by Application
Consumer Electronics
Healthcare
Automotive
IT & Telecommunication
Australia Outlook (USD Billion, 2018-2032)
Australia Quantum Dot Display by Material
Cadmium Based
Cadmium Free
Australia Quantum Dot Display by Product
Smartphones
PC Monitor
Tablet PC
TV
Australia Quantum Dot Display by Application
Consumer Electronics
Healthcare
Automotive
IT & Telecommunication
Rest of Asia-Pacific Outlook (USD Billion, 2018-2032)
Rest of Asia-Pacific Quantum Dot Display by Material
Cadmium Based
Cadmium Free
Rest of Asia-Pacific Quantum Dot Display by Product
Smartphones
PC Monitor
Tablet PC
TV
Rest of Asia-Pacific Quantum Dot Display by Application
Consumer Electronics
Healthcare
Automotive
IT & Telecommunication
Rest of the World Outlook (USD Billion, 2018-2032)
Rest of the World Quantum Dot Display by Material
Cadmium Based
Cadmium Free
Rest of the World Quantum Dot Display by Product
Smartphones
PC Monitor
Tablet PC
TV
Rest of the World Quantum Dot Display by Application
Consumer Electronics
Healthcare
Automotive
IT & Telecommunication
Middle East Outlook (USD Billion, 2018-2032)
Middle East Quantum Dot Display by Material
Cadmium Based
Cadmium Free
Middle East Quantum Dot Display by Product
Smartphones
PC Monitor
Tablet PC
TV
Middle East Quantum Dot Display by Application
Consumer Electronics
Healthcare
Automotive
IT & Telecommunication
Africa Outlook (USD Billion, 2018-2032)
Africa Quantum Dot Display by Material
Cadmium Based
Cadmium Free
Africa Quantum Dot Display by Product
Smartphones
PC Monitor
Tablet PC
TV
Africa Quantum Dot Display by Application
Consumer Electronics
Healthcare
Automotive
IT & Telecommunication
Latin America Outlook (USD Billion, 2018-2032)
Latin America Quantum Dot Display by Material
Cadmium Based
Cadmium Free
Latin America Quantum Dot Display by Product
Smartphones
PC Monitor
Tablet PC
TV
Latin America Quantum Dot Display by Application
Consumer Electronics
Healthcare
Automotive
IT & Telecommunication