×
  • Cat-intel
  • MedIntelliX
  • Resources
  • About Us
  • Hero Background
    English
    Chinese
    French
    Japanese
    Korean
    German
    Spanish

    Push Rod Sensor Market Share

    ID: MRFR/SEM/10885-HCR
    128 Pages
    Aarti Dhapte
    October 2025

    Push Rod Sensor Market Research Report Information By Product Type (Optical Sensor, Inductive Sensor, Capacitive Sensor, and Other), By Application (Automobile Industry, Aerospace, Machine Made, Medical Industry, and Other) And By Region (North America, Europe, Asia-Pacific, And Rest Of The World) –Industry Size, Share and Forecast Till 2035

    Share:
    Download PDF ×

    We do not share your information with anyone. However, we may send you emails based on your report interest from time to time. You may contact us at any time to opt-out.

    Push Rod Sensor Market Infographic
    Purchase Options

    Market Share

    Push Rod Sensor Market Share Analysis

    Market share positioning strategies are pivotal in determining the success and standing of companies within the Push Rod Sensor Market. One predominant strategy involves differentiation, where companies aim to set their products apart from competitors by offering unique features, better performance, or superior quality. This approach allows companies to build a distinct brand image and attract customers who value the specific attributes of their push rod sensors. Another essential strategy is cost leadership, where companies focus on becoming the low-cost provider in the market. This involves optimizing production processes, achieving economies of scale, and ultimately offering push rod sensors at competitive prices. Cost leadership can be particularly effective in price-sensitive markets, attracting budget-conscious consumers and gaining a larger market share.

    Furthermore, innovation plays a crucial role in market share positioning within the push rod sensor industry. Companies that invest in research and development to introduce cutting-edge technologies or improvements in sensor performance can gain a competitive edge. Innovations may include enhanced accuracy, increased sensitivity, or the development of sensors suitable for new applications. By staying at the forefront of technological advancements, companies position themselves as industry leaders, attracting customers seeking state-of-the-art solutions.

    Strategic partnerships and collaborations are also integral in market share positioning. By forming alliances with key players in related industries or establishing partnerships with distributors and suppliers, companies can expand their reach and access new markets. This not only facilitates increased sales but also strengthens the company's overall position in the push rod sensor market. Collaborations can lead to synergies, allowing companies to leverage complementary strengths and resources.

    Market segmentation is another strategy employed by companies to enhance their market share positioning. By identifying specific customer segments with unique needs and preferences, companies can tailor their push rod sensor offerings to meet these requirements effectively. This targeted approach enables companies to capture a larger share of niche markets and build a loyal customer base. Customization of products and services based on the distinct demands of different industries or applications is a key element in successful market segmentation strategies.

    Geographic expansion is a vital strategy for companies aiming to increase their market share in the push rod sensor industry. This involves entering new regions or countries where there is untapped potential. Adapting products to suit regional preferences, complying with local regulations, and establishing a strong distribution network are crucial steps in successful geographic expansion. By reaching diverse markets, companies can mitigate risks associated with dependency on specific regions and tap into emerging opportunities.

    Customer-centric strategies are essential for building and retaining market share. Companies that prioritize customer satisfaction, provide excellent post-sales support, and actively seek feedback can create a positive reputation in the market. Satisfied customers are more likely to become repeat buyers and advocates, contributing to the company's overall market share growth. Additionally, implementing effective marketing and promotional strategies that highlight the unique value propositions of push rod sensors can increase brand visibility and attract a larger customer base.

    Author
    Aarti Dhapte
    Team Lead - Research

    She holds an experience of about 6+ years in Market Research and Business Consulting, working under the spectrum of Information Communication Technology, Telecommunications and Semiconductor domains. Aarti conceptualizes and implements a scalable business strategy and provides strategic leadership to the clients. Her expertise lies in market estimation, competitive intelligence, pipeline analysis, customer assessment, etc.

    Leave a Comment

    FAQs

    What is the projected market valuation for the Push Rod Sensor Market in 2035?

    <p>The projected market valuation for the Push Rod Sensor Market in 2035 is 3.199 USD Million.</p>

    What was the overall market valuation for the Push Rod Sensor Market in 2024?

    <p>The overall market valuation for the Push Rod Sensor Market in 2024 was 1.474 USD Million.</p>

    What is the expected CAGR for the Push Rod Sensor Market during the forecast period 2025 - 2035?

    <p>The expected CAGR for the Push Rod Sensor Market during the forecast period 2025 - 2035 is 7.3%.</p>

    Which companies are considered key players in the Push Rod Sensor Market?

    <p>Key players in the Push Rod Sensor Market include Honeywell, Bosch, TE Connectivity, Analog Devices, Sensata Technologies, NXP Semiconductors, Infineon Technologies, and STMicroelectronics.</p>

    What are the main types of sensors in the Push Rod Sensor Market and their valuations?

    <p>The main types of sensors include Optical Sensors and Inductive Sensors, each valued at approximately 0.442 to 0.979 USD Million.</p>

    How does the automobile industry contribute to the Push Rod Sensor Market?

    <p>The automobile industry contributes significantly, with a valuation ranging from 0.74 to 1.6 USD Million.</p>

    Market Summary

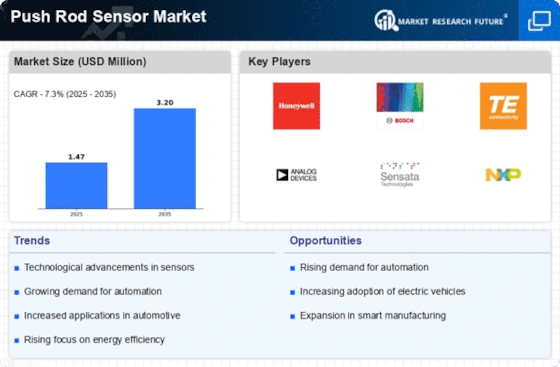
    As per MRFR analysis, the Push Rod Sensor Market Size was estimated at 1.474 USD Million in 2024. The Push Rod Sensor industry is projected to grow from 1.581 in 2025 to 3.199 by 2035, exhibiting a compound annual growth rate (CAGR) of 7.3 during the forecast period 2025 - 2035.

    Key Market Trends & Highlights

    The Push Rod Sensor Market is poised for substantial growth driven by technological advancements and increasing demand across various sectors.

    • Technological advancements are enhancing the capabilities and applications of push rod sensors, particularly in the automotive sector.
    • North America remains the largest market for push rod sensors, while the Asia-Pacific region is experiencing the fastest growth due to rising industrial automation.
    • The optical sensor segment dominates the market, whereas the inductive sensor segment is rapidly gaining traction as industries seek innovative solutions.
    • Key market drivers include the growing demand in the automotive sector and the rising adoption of automation in manufacturing, which are shaping the future of push rod sensors.

    Market Size & Forecast

    2024 Market Size 1.474 (USD Million)
    2035 Market Size 3.199 (USD Million)
    CAGR (2025 - 2035) 7.3%
    Largest Regional Market Share in 2024 North America

    Major Players

    <p>Honeywell (US), Bosch (DE), TE Connectivity (US), Analog Devices (US), Sensata Technologies (US), NXP Semiconductors (NL), Infineon Technologies (DE), STMicroelectronics (CH)</p>

    Market Trends

    The Push Rod Sensor Market is currently experiencing a notable evolution, driven by advancements in technology and increasing demand for precision in various applications. This market encompasses sensors that monitor the position and movement of push rods, which are integral components in numerous mechanical systems. The growing emphasis on automation and smart technologies across industries such as automotive, aerospace, and manufacturing is propelling the adoption of these sensors. As organizations seek to enhance operational efficiency and reduce downtime, the integration of push rod sensors into their systems appears to be a strategic move. Moreover, the Push Rod Sensor Market is likely to benefit from the rising trend of electric vehicles and the need for sophisticated monitoring systems. The shift towards sustainable energy solutions is prompting manufacturers to innovate and develop sensors that can withstand the unique challenges posed by electric drivetrains. This evolution suggests a promising future for the market, as it adapts to meet the demands of modern engineering and design. The ongoing research and development efforts in sensor technology may further enhance the capabilities and applications of push rod sensors, potentially leading to new market opportunities.

    Technological Advancements

    The Push Rod Sensor Market is witnessing rapid technological advancements, particularly in sensor design and functionality. Innovations such as miniaturization and enhanced sensitivity are enabling more precise measurements and improved performance in various applications. This trend indicates a shift towards smarter sensors that can integrate seamlessly with digital systems, enhancing data collection and analysis.

    Growing Demand in Automotive Sector

    The automotive sector is increasingly adopting push rod sensors to improve vehicle performance and safety. As manufacturers focus on developing more efficient and reliable vehicles, the integration of these sensors is becoming essential. This trend suggests a robust growth potential for the Push Rod Sensor Market, driven by the need for advanced monitoring systems in modern vehicles.

    Sustainability and Electric Vehicles

    The rise of electric vehicles is influencing the Push Rod Sensor Market, as manufacturers seek to create sensors that can operate effectively in electric drivetrains. This trend highlights the market's adaptability to changing industry needs, as sustainability becomes a priority. The demand for sensors that can withstand the unique conditions of electric vehicles may lead to innovative solutions and expanded market opportunities.

    Push Rod Sensor Market Market Drivers

    Growing Demand in Automotive Sector

    The automotive sector is a primary driver of the Push Rod Sensor Market, as these sensors are integral to modern vehicle systems. With the increasing complexity of automotive designs, the need for reliable and precise sensors has never been more critical. The market is expected to witness a significant uptick, with estimates suggesting that automotive applications could account for over 40% of the total push rod sensor market by 2026. This growth is fueled by the rising demand for advanced driver-assistance systems (ADAS) and the integration of sensors in electric vehicles. As manufacturers strive to enhance vehicle safety and performance, the push rod sensor market is poised to benefit substantially from these trends.

    Emergence of Smart Manufacturing Practices

    The emergence of smart manufacturing practices is significantly influencing the Push Rod Sensor Market. As industries transition towards Industry 4.0, the integration of smart sensors becomes vital for data collection and analysis. Push rod sensors are increasingly utilized in smart factories to monitor equipment health and optimize production processes. This shift is expected to drive market growth, with projections indicating that smart manufacturing could account for a substantial share of the push rod sensor market by 2027. The ability to collect real-time data allows manufacturers to make informed decisions, thereby enhancing productivity and reducing downtime. As such, the push rod sensor market is likely to see increased investments in smart technologies.

    Focus on Energy Efficiency and Sustainability

    The growing emphasis on energy efficiency and sustainability is another key driver for the Push Rod Sensor Market. As industries and consumers alike become more environmentally conscious, the demand for energy-efficient solutions is rising. Push rod sensors contribute to this trend by enabling precise control of machinery and processes, thereby reducing energy consumption. The market is witnessing a shift towards sensors that not only meet performance standards but also align with sustainability goals. Estimates suggest that the demand for energy-efficient sensors could increase by 15% over the next few years, reflecting a broader commitment to sustainable practices. This focus on sustainability is likely to enhance the appeal of push rod sensors across various sectors.

    Rising Adoption of Automation in Manufacturing

    The Push Rod Sensor Market is also being propelled by the increasing adoption of automation in manufacturing processes. As industries seek to enhance efficiency and reduce operational costs, the integration of advanced sensors becomes essential. Push rod sensors play a crucial role in monitoring and controlling machinery, ensuring optimal performance. The manufacturing sector is projected to invest heavily in automation technologies, with estimates indicating a growth rate of around 8% annually. This trend is likely to create a substantial demand for push rod sensors, as they provide critical feedback for automated systems. Consequently, manufacturers are expected to prioritize the incorporation of these sensors to maintain competitive advantages.

    Technological Advancements in Sensor Technology

    The Push Rod Sensor Market is experiencing a surge in technological advancements that enhance sensor performance and reliability. Innovations such as miniaturization, improved signal processing, and integration with IoT technologies are driving the market forward. For instance, the introduction of smart sensors that can communicate data in real-time is likely to increase their adoption across various applications. The market for push rod sensors is projected to grow at a compound annual growth rate of approximately 6.5% over the next five years, indicating a robust demand for advanced sensor solutions. These advancements not only improve the accuracy of measurements but also reduce maintenance costs, making them more appealing to manufacturers and end-users alike.

    Market Segment Insights

    By Type: Optical Sensor (Largest) vs. Inductive Sensor (Fastest-Growing)

    <p>In the Push Rod Sensor Market, the segmentation by type reveals that Optical Sensors hold the largest market share due to their precision and reliability in detecting positions, which is critical in various industrial applications. Following this, Inductive Sensors are gaining traction, appealing to sectors that prioritize durability and non-contact measurement methods. Capacitive Sensors and Other categories have comparatively smaller shares but continue to contribute to the overall market diversity.</p>

    <p>Optical Sensor (Dominant) vs. Inductive Sensor (Emerging)</p>

    <p>Optical Sensors are recognized for their advanced technology, providing high accuracy and excellent response times which make them a preferred choice in automotive and automation sectors. They dominate the market due to their effectiveness in measuring linear and angular positions. On the other hand, Inductive Sensors, while emerging, are attracting attention due to their ability to operate in harsh environments without direct contact, which reduces wear and tear. This characteristic enables them to become increasingly favored in industries that require robust sensing solutions, thus showing rapid growth potential.</p>

    By Applications: Automobile Industry (Largest) vs. Aerospace (Fastest-Growing)

    <p>The Push Rod Sensor Market distributes its share prominently among the major applications, with the Automobile Industry holding the largest stake. This segment burgeons due to the increasing demand for advanced automotive technologies, such as electric vehicles and autonomous driving systems that require precise sensors. Following closely, the Aerospace sector is rapidly gaining ground, driven by innovations in aircraft systems and the need for more efficient sensor technologies to monitor engine performance and aircraft conditions.</p>

    <p>Aerospace (Dominant) vs. Medical Industry (Emerging)</p>

    <p>In the Push Rod Sensor Market, the Aerospace application is prominent due to its evolving demand for sophisticated monitoring solutions that enhance aircraft safety and performance. Aircraft manufacturers are increasingly integrating these sensors into engine systems, which aids in real-time monitoring and operational efficiency. In contrast, the Medical Industry, while emerging, is exploring sensors for diagnostics and therapeutic devices. As healthcare innovates towards precision medicine and minimally invasive procedures, the integration of advanced sensor technologies is gradually being adopted, indicating a promising yet developing market position compared to the established aerospace sector.</p>

    Get more detailed insights about Push Rod Sensor Market Research Report – Forecast till 2035

    Regional Insights

    North America : Innovation and Demand Surge

    North America is the largest market for push rod sensors, accounting for approximately 45% of the global market share. The region's growth is driven by the increasing demand for advanced automotive technologies and stringent regulatory standards aimed at enhancing vehicle safety and efficiency. The presence of major automotive manufacturers and a robust supply chain further catalyze market expansion. The United States and Canada are the leading countries in this region, with the U.S. holding a significant share due to its advanced automotive sector. Key players like Honeywell, TE Connectivity, and Analog Devices are actively investing in R&D to innovate and meet the growing demand. The competitive landscape is characterized by collaborations and partnerships among industry leaders to enhance product offerings and market reach.

    Europe : Regulatory-Driven Market Growth

    Europe is the second-largest market for push rod sensors, holding around 30% of the global market share. The region's growth is significantly influenced by stringent environmental regulations and a shift towards electric vehicles, which require advanced sensor technologies. Countries like Germany and France are at the forefront, driving demand through innovation and sustainability initiatives. Germany is the leading country in Europe, home to major automotive manufacturers and suppliers. The competitive landscape is marked by the presence of key players such as Bosch and Infineon Technologies, who are focusing on developing cutting-edge sensor solutions. The European market is characterized by a strong emphasis on quality and compliance with regulatory standards, fostering a competitive environment that encourages innovation.

    Asia-Pacific : Emerging Market Potential

    Asia-Pacific is witnessing rapid growth in the push rod sensor market, accounting for approximately 20% of the global share. The region's expansion is fueled by increasing automotive production, rising disposable incomes, and a growing focus on vehicle safety and performance. Countries like China and India are leading this growth, supported by government initiatives to enhance automotive technology. China is the largest market in the region, with a booming automotive sector that demands advanced sensor technologies. The competitive landscape includes key players like NXP Semiconductors and STMicroelectronics, who are investing in local partnerships to strengthen their market presence. The region is characterized by a mix of established companies and emerging startups, fostering innovation and competition in the sensor market.

    Middle East and Africa : Untapped Market Opportunities

    The Middle East and Africa region is gradually emerging in the push rod sensor market, holding about 5% of the global share. The growth is driven by increasing automotive sales and a rising focus on safety regulations. Countries like South Africa and the UAE are beginning to adopt advanced automotive technologies, creating opportunities for sensor manufacturers. South Africa is the leading country in this region, with a growing automotive industry that is attracting investments. The competitive landscape is still developing, with opportunities for both local and international players to establish a foothold. Key players are exploring partnerships and collaborations to tap into this emerging market, which is characterized by a demand for cost-effective and reliable sensor solutions.

    Key Players and Competitive Insights

    Leading market players are putting a lot of money on R&D to increase the range of their goods, which will spur the Push Rod Sensor market to expand even further. Additionally, market participants are engaging in a range of strategic initiatives to increase their worldwide reach, with important market developments such as the introduction of new products, contracts, mergers and acquisitions, increased investments, and cooperation with other businesses. To grow and endure in a market that is becoming more competitive, Push Rod Sensor industry must provide reasonably priced goods.

    One of the main business strategies employed by manufacturers is to produce locally to reduce operational expenses in the global Push Rod Sensor industry to develop market sector and provide benefits to customers. In recent years, the Push Rod Sensor industry has provided the automotive industry with some of the most important benefits. Major players in the Push Rod Sensor market, including Dynisco, ConSenses GmbH, Inelta Sensorsysteme, TDS Precision Products, MEGATRON, Nanjing Xiju Electronic Technology Limited., and others, invest in operations for research and development in an effort to improve market demand.

    Viatran is an industry leader in pressure and level sensors that are made for reliable and precise measurement for all pressure ranges and most temperatures. These sensors are used in industries like oil and gas, manufacturing of steel, food and medical supplies, injection molding, die casting, and chemical production. Their products are renowned for withstanding the roughest and most inhospitable conditions. Additionally, Viatran is dedicated to providing its customers with tried-and-true products, quick service and support, and innovative technology that dramatically increases the productivity of their production processes.

    Starting in 2022, upfront and milestone-related R&D expenditures connected to agreements for collaboration and licensing made before a research product receives regulatory approval are no longer included in reported adjusted financial measures.

    ConSense GmbH is a top provider of software for process and quality management. ConSense GmbH develops software for cross-industry, comprehensive process management, and quality management. Their solutions satisfy a wide range of needs, from GxP-compliant systems to QM systems that are in line with DIN EN ISO 9001 and may map too many other standards, because they are user-friendly, flexible, and expandable. Whether their client is a small, medium-sized, or large global firm, they offer a solution that is uniquely created for every type of organization.

    The 4th ConSense ScientificAward was given to Vivien Sohn in April 2022 for her remarkable thesis, "Introducing a holistic process management scheme aiming at future viability and competitive advantages using the example of HÜBSCHER Holzbau AG," which she submitted to IUBH Internationale Hochschule GmbH.

    Key Companies in the Push Rod Sensor Market market include

    Industry Developments

    May 2021: BD SENSORS GmbH has launched the DS5 electrical pressure switch to increase operating safety in mobile construction machines including cranes, excavators, and harvesters.

    March 2020: ABB built a distribution plant in Arizona to boost its presence in the western US. Every electrical product that the company offers is sold at the center.

    September 2020: Sensata Technologies, Inc. introduced hermetic pressure sensors with mid- and high-pressure ranges for industrial applications. Leading-edge micro silicon strain gauge technology is used to construct the sensor. The sensor has various distinctive qualities, including high accuracy, burst strength, and shock and vibration performance, making it a dependable and robust alternative for clients with demanding measurement requirements.

    Future Outlook

    Push Rod Sensor Market Future Outlook

    <p>The Push Rod Sensor Market is projected to grow at a 7.3% CAGR from 2024 to 2035, driven by advancements in automotive technology, increasing demand for automation, and enhanced sensor capabilities.</p>

    New opportunities lie in:

    • <p>Development of integrated sensor solutions for electric vehicles</p>
    • <p>Expansion into emerging markets with tailored sensor products</p>
    • <p>Partnerships with automotive manufacturers for customized sensor applications</p>

    <p>By 2035, the Push Rod Sensor Market is expected to achieve robust growth and innovation.</p>

    Market Segmentation

    Push Rod Sensor Applications Outlook

    • Automobile Industry
    • Aerospace
    • Machine Made
    • Medical Industry
    • Other

    Push Rod Sensor Product Type Outlook

    • Optical Sensor
    • Inductive Sensor
    • Capacitive Sensor
    • Other

    Report Scope

    MARKET SIZE 20241.474(USD Million)
    MARKET SIZE 20251.581(USD Million)
    MARKET SIZE 20353.199(USD Million)
    COMPOUND ANNUAL GROWTH RATE (CAGR)7.3% (2024 - 2035)
    REPORT COVERAGERevenue Forecast, Competitive Landscape, Growth Factors, and Trends
    BASE YEAR2024
    Market Forecast Period2025 - 2035
    Historical Data2019 - 2024
    Market Forecast UnitsUSD Million
    Key Companies ProfiledMarket analysis in progress
    Segments CoveredMarket segmentation analysis in progress
    Key Market OpportunitiesIntegration of advanced materials enhances performance and durability in the Push Rod Sensor Market.
    Key Market DynamicsRising demand for precision engineering in automotive applications drives innovation in push rod sensor technology.
    Countries CoveredNorth America, Europe, APAC, South America, MEA

    FAQs

    What is the projected market valuation for the Push Rod Sensor Market in 2035?

    <p>The projected market valuation for the Push Rod Sensor Market in 2035 is 3.199 USD Million.</p>

    What was the overall market valuation for the Push Rod Sensor Market in 2024?

    <p>The overall market valuation for the Push Rod Sensor Market in 2024 was 1.474 USD Million.</p>

    What is the expected CAGR for the Push Rod Sensor Market during the forecast period 2025 - 2035?

    <p>The expected CAGR for the Push Rod Sensor Market during the forecast period 2025 - 2035 is 7.3%.</p>

    Which companies are considered key players in the Push Rod Sensor Market?

    <p>Key players in the Push Rod Sensor Market include Honeywell, Bosch, TE Connectivity, Analog Devices, Sensata Technologies, NXP Semiconductors, Infineon Technologies, and STMicroelectronics.</p>

    What are the main types of sensors in the Push Rod Sensor Market and their valuations?

    <p>The main types of sensors include Optical Sensors and Inductive Sensors, each valued at approximately 0.442 to 0.979 USD Million.</p>

    How does the automobile industry contribute to the Push Rod Sensor Market?

    <p>The automobile industry contributes significantly, with a valuation ranging from 0.74 to 1.6 USD Million.</p>

    1. SECTION I: EXECUTIVE SUMMARY AND KEY HIGHLIGHTS
      1. | 1.1 EXECUTIVE SUMMARY
      2. | | 1.1.1 Market Overview
      3. | | 1.1.2 Key Findings
      4. | | 1.1.3 Market Segmentation
      5. | | 1.1.4 Competitive Landscape
      6. | | 1.1.5 Challenges and Opportunities
      7. | | 1.1.6 Future Outlook
    2. SECTION II: SCOPING, METHODOLOGY AND MARKET STRUCTURE
      1. | 2.1 MARKET INTRODUCTION
      2. | | 2.1.1 Definition
      3. | | 2.1.2 Scope of the study
      4. | | | 2.1.2.1 Research Objective
      5. | | | 2.1.2.2 Assumption
      6. | | | 2.1.2.3 Limitations
      7. | 2.2 RESEARCH METHODOLOGY
      8. | | 2.2.1 Overview
      9. | | 2.2.2 Data Mining
      10. | | 2.2.3 Secondary Research
      11. | | 2.2.4 Primary Research
      12. | | | 2.2.4.1 Primary Interviews and Information Gathering Process
      13. | | | 2.2.4.2 Breakdown of Primary Respondents
      14. | | 2.2.5 Forecasting Model
      15. | | 2.2.6 Market Size Estimation
      16. | | | 2.2.6.1 Bottom-Up Approach
      17. | | | 2.2.6.2 Top-Down Approach
      18. | | 2.2.7 Data Triangulation
      19. | | 2.2.8 Validation
    3. SECTION III: QUALITATIVE ANALYSIS
      1. | 3.1 MARKET DYNAMICS
      2. | | 3.1.1 Overview
      3. | | 3.1.2 Drivers
      4. | | 3.1.3 Restraints
      5. | | 3.1.4 Opportunities
      6. | 3.2 MARKET FACTOR ANALYSIS
      7. | | 3.2.1 Value chain Analysis
      8. | | 3.2.2 Porter's Five Forces Analysis
      9. | | | 3.2.2.1 Bargaining Power of Suppliers
      10. | | | 3.2.2.2 Bargaining Power of Buyers
      11. | | | 3.2.2.3 Threat of New Entrants
      12. | | | 3.2.2.4 Threat of Substitutes
      13. | | | 3.2.2.5 Intensity of Rivalry
      14. | | 3.2.3 COVID-19 Impact Analysis
      15. | | | 3.2.3.1 Market Impact Analysis
      16. | | | 3.2.3.2 Regional Impact
      17. | | | 3.2.3.3 Opportunity and Threat Analysis
    4. SECTION IV: QUANTITATIVE ANALYSIS
      1. | 4.1 Semiconductor & Electronics, BY Type (USD Million)
      2. | | 4.1.1 Optical Sensor
      3. | | 4.1.2 Inductive Sensor
      4. | | 4.1.3 Capacitive Sensor
      5. | | 4.1.4 Other
      6. | 4.2 Semiconductor & Electronics, BY Applications (USD Million)
      7. | | 4.2.1 Automobile Industry
      8. | | 4.2.2 Aerospace
      9. | | 4.2.3 Machine Made
      10. | | 4.2.4 Medical Industry
      11. | | 4.2.5 Other
      12. | 4.3 Semiconductor & Electronics, BY Region (USD Million)
      13. | | 4.3.1 North America
      14. | | | 4.3.1.1 US
      15. | | | 4.3.1.2 Canada
      16. | | 4.3.2 Europe
      17. | | | 4.3.2.1 Germany
      18. | | | 4.3.2.2 UK
      19. | | | 4.3.2.3 France
      20. | | | 4.3.2.4 Russia
      21. | | | 4.3.2.5 Italy
      22. | | | 4.3.2.6 Spain
      23. | | | 4.3.2.7 Rest of Europe
      24. | | 4.3.3 APAC
      25. | | | 4.3.3.1 China
      26. | | | 4.3.3.2 India
      27. | | | 4.3.3.3 Japan
      28. | | | 4.3.3.4 South Korea
      29. | | | 4.3.3.5 Malaysia
      30. | | | 4.3.3.6 Thailand
      31. | | | 4.3.3.7 Indonesia
      32. | | | 4.3.3.8 Rest of APAC
      33. | | 4.3.4 South America
      34. | | | 4.3.4.1 Brazil
      35. | | | 4.3.4.2 Mexico
      36. | | | 4.3.4.3 Argentina
      37. | | | 4.3.4.4 Rest of South America
      38. | | 4.3.5 MEA
      39. | | | 4.3.5.1 GCC Countries
      40. | | | 4.3.5.2 South Africa
      41. | | | 4.3.5.3 Rest of MEA
    5. SECTION V: COMPETITIVE ANALYSIS
      1. | 5.1 Competitive Landscape
      2. | | 5.1.1 Overview
      3. | | 5.1.2 Competitive Analysis
      4. | | 5.1.3 Market share Analysis
      5. | | 5.1.4 Major Growth Strategy in the Semiconductor & Electronics
      6. | | 5.1.5 Competitive Benchmarking
      7. | | 5.1.6 Leading Players in Terms of Number of Developments in the Semiconductor & Electronics
      8. | | 5.1.7 Key developments and growth strategies
      9. | | | 5.1.7.1 New Product Launch/Service Deployment
      10. | | | 5.1.7.2 Merger & Acquisitions
      11. | | | 5.1.7.3 Joint Ventures
      12. | | 5.1.8 Major Players Financial Matrix
      13. | | | 5.1.8.1 Sales and Operating Income
      14. | | | 5.1.8.2 Major Players R&D Expenditure. 2023
      15. | 5.2 Company Profiles
      16. | | 5.2.1 Honeywell (US)
      17. | | | 5.2.1.1 Financial Overview
      18. | | | 5.2.1.2 Products Offered
      19. | | | 5.2.1.3 Key Developments
      20. | | | 5.2.1.4 SWOT Analysis
      21. | | | 5.2.1.5 Key Strategies
      22. | | 5.2.2 Bosch (DE)
      23. | | | 5.2.2.1 Financial Overview
      24. | | | 5.2.2.2 Products Offered
      25. | | | 5.2.2.3 Key Developments
      26. | | | 5.2.2.4 SWOT Analysis
      27. | | | 5.2.2.5 Key Strategies
      28. | | 5.2.3 TE Connectivity (US)
      29. | | | 5.2.3.1 Financial Overview
      30. | | | 5.2.3.2 Products Offered
      31. | | | 5.2.3.3 Key Developments
      32. | | | 5.2.3.4 SWOT Analysis
      33. | | | 5.2.3.5 Key Strategies
      34. | | 5.2.4 Analog Devices (US)
      35. | | | 5.2.4.1 Financial Overview
      36. | | | 5.2.4.2 Products Offered
      37. | | | 5.2.4.3 Key Developments
      38. | | | 5.2.4.4 SWOT Analysis
      39. | | | 5.2.4.5 Key Strategies
      40. | | 5.2.5 Sensata Technologies (US)
      41. | | | 5.2.5.1 Financial Overview
      42. | | | 5.2.5.2 Products Offered
      43. | | | 5.2.5.3 Key Developments
      44. | | | 5.2.5.4 SWOT Analysis
      45. | | | 5.2.5.5 Key Strategies
      46. | | 5.2.6 NXP Semiconductors (NL)
      47. | | | 5.2.6.1 Financial Overview
      48. | | | 5.2.6.2 Products Offered
      49. | | | 5.2.6.3 Key Developments
      50. | | | 5.2.6.4 SWOT Analysis
      51. | | | 5.2.6.5 Key Strategies
      52. | | 5.2.7 Infineon Technologies (DE)
      53. | | | 5.2.7.1 Financial Overview
      54. | | | 5.2.7.2 Products Offered
      55. | | | 5.2.7.3 Key Developments
      56. | | | 5.2.7.4 SWOT Analysis
      57. | | | 5.2.7.5 Key Strategies
      58. | | 5.2.8 STMicroelectronics (CH)
      59. | | | 5.2.8.1 Financial Overview
      60. | | | 5.2.8.2 Products Offered
      61. | | | 5.2.8.3 Key Developments
      62. | | | 5.2.8.4 SWOT Analysis
      63. | | | 5.2.8.5 Key Strategies
      64. | 5.3 Appendix
      65. | | 5.3.1 References
      66. | | 5.3.2 Related Reports
    6. LIST OF FIGURES
      1. | 6.1 MARKET SYNOPSIS
      2. | 6.2 NORTH AMERICA MARKET ANALYSIS
      3. | 6.3 US MARKET ANALYSIS BY TYPE
      4. | 6.4 US MARKET ANALYSIS BY APPLICATIONS
      5. | 6.5 CANADA MARKET ANALYSIS BY TYPE
      6. | 6.6 CANADA MARKET ANALYSIS BY APPLICATIONS
      7. | 6.7 EUROPE MARKET ANALYSIS
      8. | 6.8 GERMANY MARKET ANALYSIS BY TYPE
      9. | 6.9 GERMANY MARKET ANALYSIS BY APPLICATIONS
      10. | 6.10 UK MARKET ANALYSIS BY TYPE
      11. | 6.11 UK MARKET ANALYSIS BY APPLICATIONS
      12. | 6.12 FRANCE MARKET ANALYSIS BY TYPE
      13. | 6.13 FRANCE MARKET ANALYSIS BY APPLICATIONS
      14. | 6.14 RUSSIA MARKET ANALYSIS BY TYPE
      15. | 6.15 RUSSIA MARKET ANALYSIS BY APPLICATIONS
      16. | 6.16 ITALY MARKET ANALYSIS BY TYPE
      17. | 6.17 ITALY MARKET ANALYSIS BY APPLICATIONS
      18. | 6.18 SPAIN MARKET ANALYSIS BY TYPE
      19. | 6.19 SPAIN MARKET ANALYSIS BY APPLICATIONS
      20. | 6.20 REST OF EUROPE MARKET ANALYSIS BY TYPE
      21. | 6.21 REST OF EUROPE MARKET ANALYSIS BY APPLICATIONS
      22. | 6.22 APAC MARKET ANALYSIS
      23. | 6.23 CHINA MARKET ANALYSIS BY TYPE
      24. | 6.24 CHINA MARKET ANALYSIS BY APPLICATIONS
      25. | 6.25 INDIA MARKET ANALYSIS BY TYPE
      26. | 6.26 INDIA MARKET ANALYSIS BY APPLICATIONS
      27. | 6.27 JAPAN MARKET ANALYSIS BY TYPE
      28. | 6.28 JAPAN MARKET ANALYSIS BY APPLICATIONS
      29. | 6.29 SOUTH KOREA MARKET ANALYSIS BY TYPE
      30. | 6.30 SOUTH KOREA MARKET ANALYSIS BY APPLICATIONS
      31. | 6.31 MALAYSIA MARKET ANALYSIS BY TYPE
      32. | 6.32 MALAYSIA MARKET ANALYSIS BY APPLICATIONS
      33. | 6.33 THAILAND MARKET ANALYSIS BY TYPE
      34. | 6.34 THAILAND MARKET ANALYSIS BY APPLICATIONS
      35. | 6.35 INDONESIA MARKET ANALYSIS BY TYPE
      36. | 6.36 INDONESIA MARKET ANALYSIS BY APPLICATIONS
      37. | 6.37 REST OF APAC MARKET ANALYSIS BY TYPE
      38. | 6.38 REST OF APAC MARKET ANALYSIS BY APPLICATIONS
      39. | 6.39 SOUTH AMERICA MARKET ANALYSIS
      40. | 6.40 BRAZIL MARKET ANALYSIS BY TYPE
      41. | 6.41 BRAZIL MARKET ANALYSIS BY APPLICATIONS
      42. | 6.42 MEXICO MARKET ANALYSIS BY TYPE
      43. | 6.43 MEXICO MARKET ANALYSIS BY APPLICATIONS
      44. | 6.44 ARGENTINA MARKET ANALYSIS BY TYPE
      45. | 6.45 ARGENTINA MARKET ANALYSIS BY APPLICATIONS
      46. | 6.46 REST OF SOUTH AMERICA MARKET ANALYSIS BY TYPE
      47. | 6.47 REST OF SOUTH AMERICA MARKET ANALYSIS BY APPLICATIONS
      48. | 6.48 MEA MARKET ANALYSIS
      49. | 6.49 GCC COUNTRIES MARKET ANALYSIS BY TYPE
      50. | 6.50 GCC COUNTRIES MARKET ANALYSIS BY APPLICATIONS
      51. | 6.51 SOUTH AFRICA MARKET ANALYSIS BY TYPE
      52. | 6.52 SOUTH AFRICA MARKET ANALYSIS BY APPLICATIONS
      53. | 6.53 REST OF MEA MARKET ANALYSIS BY TYPE
      54. | 6.54 REST OF MEA MARKET ANALYSIS BY APPLICATIONS
      55. | 6.55 KEY BUYING CRITERIA OF SEMICONDUCTOR & ELECTRONICS
      56. | 6.56 RESEARCH PROCESS OF MRFR
      57. | 6.57 DRO ANALYSIS OF SEMICONDUCTOR & ELECTRONICS
      58. | 6.58 DRIVERS IMPACT ANALYSIS: SEMICONDUCTOR & ELECTRONICS
      59. | 6.59 RESTRAINTS IMPACT ANALYSIS: SEMICONDUCTOR & ELECTRONICS
      60. | 6.60 SUPPLY / VALUE CHAIN: SEMICONDUCTOR & ELECTRONICS
      61. | 6.61 SEMICONDUCTOR & ELECTRONICS, BY TYPE, 2024 (% SHARE)
      62. | 6.62 SEMICONDUCTOR & ELECTRONICS, BY TYPE, 2024 TO 2035 (USD Million)
      63. | 6.63 SEMICONDUCTOR & ELECTRONICS, BY APPLICATIONS, 2024 (% SHARE)
      64. | 6.64 SEMICONDUCTOR & ELECTRONICS, BY APPLICATIONS, 2024 TO 2035 (USD Million)
      65. | 6.65 BENCHMARKING OF MAJOR COMPETITORS
    7. LIST OF TABLES
      1. | 7.1 LIST OF ASSUMPTIONS
      2. | | 7.1.1
      3. | 7.2 North America MARKET SIZE ESTIMATES; FORECAST
      4. | | 7.2.1 BY TYPE, 2025-2035 (USD Million)
      5. | | 7.2.2 BY APPLICATIONS, 2025-2035 (USD Million)
      6. | 7.3 US MARKET SIZE ESTIMATES; FORECAST
      7. | | 7.3.1 BY TYPE, 2025-2035 (USD Million)
      8. | | 7.3.2 BY APPLICATIONS, 2025-2035 (USD Million)
      9. | 7.4 Canada MARKET SIZE ESTIMATES; FORECAST
      10. | | 7.4.1 BY TYPE, 2025-2035 (USD Million)
      11. | | 7.4.2 BY APPLICATIONS, 2025-2035 (USD Million)
      12. | 7.5 Europe MARKET SIZE ESTIMATES; FORECAST
      13. | | 7.5.1 BY TYPE, 2025-2035 (USD Million)
      14. | | 7.5.2 BY APPLICATIONS, 2025-2035 (USD Million)
      15. | 7.6 Germany MARKET SIZE ESTIMATES; FORECAST
      16. | | 7.6.1 BY TYPE, 2025-2035 (USD Million)
      17. | | 7.6.2 BY APPLICATIONS, 2025-2035 (USD Million)
      18. | 7.7 UK MARKET SIZE ESTIMATES; FORECAST
      19. | | 7.7.1 BY TYPE, 2025-2035 (USD Million)
      20. | | 7.7.2 BY APPLICATIONS, 2025-2035 (USD Million)
      21. | 7.8 France MARKET SIZE ESTIMATES; FORECAST
      22. | | 7.8.1 BY TYPE, 2025-2035 (USD Million)
      23. | | 7.8.2 BY APPLICATIONS, 2025-2035 (USD Million)
      24. | 7.9 Russia MARKET SIZE ESTIMATES; FORECAST
      25. | | 7.9.1 BY TYPE, 2025-2035 (USD Million)
      26. | | 7.9.2 BY APPLICATIONS, 2025-2035 (USD Million)
      27. | 7.10 Italy MARKET SIZE ESTIMATES; FORECAST
      28. | | 7.10.1 BY TYPE, 2025-2035 (USD Million)
      29. | | 7.10.2 BY APPLICATIONS, 2025-2035 (USD Million)
      30. | 7.11 Spain MARKET SIZE ESTIMATES; FORECAST
      31. | | 7.11.1 BY TYPE, 2025-2035 (USD Million)
      32. | | 7.11.2 BY APPLICATIONS, 2025-2035 (USD Million)
      33. | 7.12 Rest of Europe MARKET SIZE ESTIMATES; FORECAST
      34. | | 7.12.1 BY TYPE, 2025-2035 (USD Million)
      35. | | 7.12.2 BY APPLICATIONS, 2025-2035 (USD Million)
      36. | 7.13 APAC MARKET SIZE ESTIMATES; FORECAST
      37. | | 7.13.1 BY TYPE, 2025-2035 (USD Million)
      38. | | 7.13.2 BY APPLICATIONS, 2025-2035 (USD Million)
      39. | 7.14 China MARKET SIZE ESTIMATES; FORECAST
      40. | | 7.14.1 BY TYPE, 2025-2035 (USD Million)
      41. | | 7.14.2 BY APPLICATIONS, 2025-2035 (USD Million)
      42. | 7.15 India MARKET SIZE ESTIMATES; FORECAST
      43. | | 7.15.1 BY TYPE, 2025-2035 (USD Million)
      44. | | 7.15.2 BY APPLICATIONS, 2025-2035 (USD Million)
      45. | 7.16 Japan MARKET SIZE ESTIMATES; FORECAST
      46. | | 7.16.1 BY TYPE, 2025-2035 (USD Million)
      47. | | 7.16.2 BY APPLICATIONS, 2025-2035 (USD Million)
      48. | 7.17 South Korea MARKET SIZE ESTIMATES; FORECAST
      49. | | 7.17.1 BY TYPE, 2025-2035 (USD Million)
      50. | | 7.17.2 BY APPLICATIONS, 2025-2035 (USD Million)
      51. | 7.18 Malaysia MARKET SIZE ESTIMATES; FORECAST
      52. | | 7.18.1 BY TYPE, 2025-2035 (USD Million)
      53. | | 7.18.2 BY APPLICATIONS, 2025-2035 (USD Million)
      54. | 7.19 Thailand MARKET SIZE ESTIMATES; FORECAST
      55. | | 7.19.1 BY TYPE, 2025-2035 (USD Million)
      56. | | 7.19.2 BY APPLICATIONS, 2025-2035 (USD Million)
      57. | 7.20 Indonesia MARKET SIZE ESTIMATES; FORECAST
      58. | | 7.20.1 BY TYPE, 2025-2035 (USD Million)
      59. | | 7.20.2 BY APPLICATIONS, 2025-2035 (USD Million)
      60. | 7.21 Rest of APAC MARKET SIZE ESTIMATES; FORECAST
      61. | | 7.21.1 BY TYPE, 2025-2035 (USD Million)
      62. | | 7.21.2 BY APPLICATIONS, 2025-2035 (USD Million)
      63. | 7.22 South America MARKET SIZE ESTIMATES; FORECAST
      64. | | 7.22.1 BY TYPE, 2025-2035 (USD Million)
      65. | | 7.22.2 BY APPLICATIONS, 2025-2035 (USD Million)
      66. | 7.23 Brazil MARKET SIZE ESTIMATES; FORECAST
      67. | | 7.23.1 BY TYPE, 2025-2035 (USD Million)
      68. | | 7.23.2 BY APPLICATIONS, 2025-2035 (USD Million)
      69. | 7.24 Mexico MARKET SIZE ESTIMATES; FORECAST
      70. | | 7.24.1 BY TYPE, 2025-2035 (USD Million)
      71. | | 7.24.2 BY APPLICATIONS, 2025-2035 (USD Million)
      72. | 7.25 Argentina MARKET SIZE ESTIMATES; FORECAST
      73. | | 7.25.1 BY TYPE, 2025-2035 (USD Million)
      74. | | 7.25.2 BY APPLICATIONS, 2025-2035 (USD Million)
      75. | 7.26 Rest of South America MARKET SIZE ESTIMATES; FORECAST
      76. | | 7.26.1 BY TYPE, 2025-2035 (USD Million)
      77. | | 7.26.2 BY APPLICATIONS, 2025-2035 (USD Million)
      78. | 7.27 MEA MARKET SIZE ESTIMATES; FORECAST
      79. | | 7.27.1 BY TYPE, 2025-2035 (USD Million)
      80. | | 7.27.2 BY APPLICATIONS, 2025-2035 (USD Million)
      81. | 7.28 GCC Countries MARKET SIZE ESTIMATES; FORECAST
      82. | | 7.28.1 BY TYPE, 2025-2035 (USD Million)
      83. | | 7.28.2 BY APPLICATIONS, 2025-2035 (USD Million)
      84. | 7.29 South Africa MARKET SIZE ESTIMATES; FORECAST
      85. | | 7.29.1 BY TYPE, 2025-2035 (USD Million)
      86. | | 7.29.2 BY APPLICATIONS, 2025-2035 (USD Million)
      87. | 7.30 Rest of MEA MARKET SIZE ESTIMATES; FORECAST
      88. | | 7.30.1 BY TYPE, 2025-2035 (USD Million)
      89. | | 7.30.2 BY APPLICATIONS, 2025-2035 (USD Million)
      90. | 7.31 PRODUCT LAUNCH/PRODUCT DEVELOPMENT/APPROVAL
      91. | | 7.31.1
      92. | 7.32 ACQUISITION/PARTNERSHIP
      93. | | 7.32.1


    Push Rod Sensor Market Segmentation

    Push Rod Sensor Product Type Outlook (USD Billion, 2018-2032)

    • Optical Sensor
    • Inductive Sensor
    • Capacitive Sensor
    • Other

    Push Rod Sensor Application Outlook (USD Billion, 2018-2032)

    • Automobile Industry
    • Aerospace
    • Machine Made
    • Medical Industry
    • Other

    Push Rod Sensor Regional Outlook (USD Billion, 2018-2032)

    • North America Outlook (USD Billion, 2018-2032)

      • North America Push Rod Sensor by Product Type
        • Optical Sensor
        • Inductive Sensor
        • Capacitive Sensor
        • Other
      • North America Push Rod Sensor by Application
        • Automobile Industry
        • Aerospace
        • Machine Made
        • Medical Industry
        • Other
      • US Outlook (USD Billion, 2018-2032)

      • US Push Rod Sensor by Product Type
        • Optical Sensor
        • Inductive Sensor
        • Capacitive Sensor
        • Other
      • US Push Rod Sensor by Application
        • Automobile Industry
        • Aerospace
        • Machine Made
        • Medical Industry
        • Other
      • CANADA Outlook (USD Billion, 2018-2032)

      • CANADA Push Rod Sensor by Product Type
        • Optical Sensor
        • Inductive Sensor
        • Capacitive Sensor
        • Other
      • CANADA Push Rod Sensor by Application
        • Automobile Industry
        • Aerospace
        • Machine Made
        • Medical Industry
        • Other
    • Europe Outlook (USD Billion, 2018-2032)

      • Europe Push Rod Sensor by Product Type
        • Optical Sensor
        • Inductive Sensor
        • Capacitive Sensor
        • Other
      • Europe Push Rod Sensor by Application
        • Automobile Industry
        • Aerospace
        • Machine Made
        • Medical Industry
        • Other
      • Germany Outlook (USD Billion, 2018-2032)

      • Germany Push Rod Sensor by Product Type
        • Optical Sensor
        • Inductive Sensor
        • Capacitive Sensor
        • Other
      • Germany Push Rod Sensor by Application
        • Automobile Industry
        • Aerospace
        • Machine Made
        • Medical Industry
        • Other
      • France Outlook (USD Billion, 2018-2032)

      • France Push Rod Sensor by Product Type
        • Optical Sensor
        • Inductive Sensor
        • Capacitive Sensor
        • Other
      • France Push Rod Sensor by Application
        • Automobile Industry
        • Aerospace
        • Machine Made
        • Medical Industry
        • Other
      • UK Outlook (USD Billion, 2018-2032)

      • UK Push Rod Sensor by Product Type
        • Optical Sensor
        • Inductive Sensor
        • Capacitive Sensor
        • Other
      • UK Push Rod Sensor by Application
        • Automobile Industry
        • Aerospace
        • Machine Made
        • Medical Industry
        • Other
      • ITALY Outlook (USD Billion, 2018-2032)

      • ITALY Push Rod Sensor by Product Type
        • Optical Sensor
        • Inductive Sensor
        • Capacitive Sensor
        • Other
      • ITALY Push Rod Sensor by Application
        • Automobile Industry
        • Aerospace
        • Machine Made
        • Medical Industry
        • Other
      • SPAIN Outlook (USD Billion, 2018-2032)

      • Spain Push Rod Sensor by Product Type
        • Optical Sensor
        • Inductive Sensor
        • Capacitive Sensor
        • Other
      • Spain Push Rod Sensor by Application
        • Automobile Industry
        • Aerospace
        • Machine Made
        • Medical Industry
        • Other
      • Rest Of Europe Outlook (USD Billion, 2018-2032)

      • Rest Of Europe Push Rod Sensor by Product Type
        • Optical Sensor
        • Inductive Sensor
        • Capacitive Sensor
        • Other
      • REST OF EUROPE Push Rod Sensor by Application
        • Automobile Industry
        • Aerospace
        • Machine Made
        • Medical Industry
        • Other
    • Asia-Pacific Outlook (USD Billion, 2018-2032)

      • Asia-Pacific Push Rod Sensor by Product Type
        • Optical Sensor
        • Inductive Sensor
        • Capacitive Sensor
        • Other
      • Asia-Pacific Push Rod Sensor by Application
        • Automobile Industry
        • Aerospace
        • Machine Made
        • Medical Industry
        • Other
      • China Outlook (USD Billion, 2018-2032)

      • China Push Rod Sensor by Product Type
        • Optical Sensor
        • Inductive Sensor
        • Capacitive Sensor
        • Other
      • China Push Rod Sensor by Application
        • Automobile Industry
        • Aerospace
        • Machine Made
        • Medical Industry
        • Other
      • Japan Outlook (USD Billion, 2018-2032)

      • Japan Push Rod Sensor by Product Type
        • Optical Sensor
        • Inductive Sensor
        • Capacitive Sensor
        • Other
      • Japan Push Rod Sensor by Application
        • Automobile Industry
        • Aerospace
        • Machine Made
        • Medical Industry
        • Other
      • India Outlook (USD Billion, 2018-2032)

      • India Push Rod Sensor by Product Type
        • Optical Sensor
        • Inductive Sensor
        • Capacitive Sensor
        • Other
      • India Push Rod Sensor by Application
        • Automobile Industry
        • Aerospace
        • Machine Made
        • Medical Industry
        • Other
      • Australia Outlook (USD Billion, 2018-2032)

      • Australia Push Rod Sensor by Product Type
        • Optical Sensor
        • Inductive Sensor
        • Capacitive Sensor
        • Other
      • Australia Push Rod Sensor by Application
        • Automobile Industry
        • Aerospace
        • Machine Made
        • Medical Industry
        • Other
      • Rest of Asia-Pacific Outlook (USD Billion, 2018-2032)

      • Rest of Asia-Pacific Push Rod Sensor by Product Type
        • Optical Sensor
        • Inductive Sensor
        • Capacitive Sensor
        • Other
      • Rest of Asia-Pacific Push Rod Sensor by Application
        • Automobile Industry
        • Aerospace
        • Machine Made
        • Medical Industry
        • Other
    • Rest of the World Outlook (USD Billion, 2018-2032)

      • Rest of the World Push Rod Sensor by Product Type
        • Optical Sensor
        • Inductive Sensor
        • Capacitive Sensor
        • Other
      • Rest of the World Push Rod Sensor by Application
        • Automobile Industry
        • Aerospace
        • Machine Made
        • Medical Industry
        • Other
      • Middle East Outlook (USD Billion, 2018-2032)

      • Middle East Push Rod Sensor by Product Type
        • Optical Sensor
        • Inductive Sensor
        • Capacitive Sensor
        • Other
      • Middle East Push Rod Sensor by Application
        • Automobile Industry
        • Aerospace
        • Machine Made
        • Medical Industry
        • Other
      • Africa Outlook (USD Billion, 2018-2032)

      • Africa Push Rod Sensor by Product Type
        • Optical Sensor
        • Inductive Sensor
        • Capacitive Sensor
        • Other
      • Africa Push Rod Sensor by Application
        • Automobile Industry
        • Aerospace
        • Machine Made
        • Medical Industry
        • Other
      • Latin America Outlook (USD Billion, 2018-2032)

      • Latin America Push Rod Sensor by Product Type
        • Optical Sensor
        • Inductive Sensor
        • Capacitive Sensor
        • Other
      • Latin America Push Rod Sensor by Application
        • Automobile Industry
        • Aerospace
        • Machine Made
        • Medical Industry
        • Other
    Infographic

    Free Sample Request

    Kindly complete the form below to receive a free sample of this Report

    Get Free Sample

    Customer Strories

    “I am very pleased with how market segments have been defined in a relevant way for my purposes (such as "Portable Freezers & refrigerators" and "last-mile"). In general the report is well structured. Thanks very much for your efforts.”

    Victoria Milne

    Founder
    Case Study
    Chemicals and Materials

    Compare Licence

    ×
    Features License Type
    Single User Multiuser License Enterprise User
    Price $4,950 $5,950 $7,250
    Maximum User Access Limit 1 User Upto 10 Users Unrestricted Access Throughout the Organization
    Free Customization
    Direct Access to Analyst
    Deliverable Format
    Platform Access
    Discount on Next Purchase 10% 15% 15%
    Printable Versions