ID: MRFR/Pharma/5025-HCR | | Region: Global | 100 pages
Market Scenario
The global pulmonary atresia diagnostics and treatment market is expected to register a significant growth during the forecast period (2018–2023).
Pulmonary atresia is the type of inherited heart defect that a baby is born with. It arises when the pulmonary valve normally located between the right ventricle and the pulmonary artery doesn’t form properly. The valve should have three leaflets which allow the blood to flow forward into the pulmonary artery but prevent it from flowing backward into the right ventricle. In the case of congenital pulmonary atresia patients, the valve either malfunctions or does not form at all. The tissue formed in the place of pulmonary valve does not allow the blood flow into the pulmonary artery. This flaw develops in the first eight weeks of pregnancy and disturbs the flow of blood from the right ventricle to the pulmonary artery leading to the lungs. It can be recognized in a prenatal ultrasound.
The most common symptoms are blue or gray-toned skin, troubled breathing, weakness, sleepiness, and others. Factors such as technological advancements, increasing awareness, lifestyle changes are the major driving factors for the growth of the market. However, unspecified regulatory issues, infection risks connected with surgical procedures, and ambiguous reimbursement policies are the factors limiting the market growth. Additionally, restrains for the market include the high cost of the surgical procedure and the risks involved in the procedures are likely to affect the pulmonary atresia diagnostics and treatment market negatively.
Segmentation
The global pulmonary atresia diagnostics and treatment market has been segmented on the basis of type, diagnosis, treatment and end users.
On the basis of type, the market has been classified as pulmonary atresia with an intact ventricular septum and pulmonary atresia with ventricular septum defect.
On the basis of diagnosis, the market has been classified as pulse oximetry, electrocardiogram (ECG), echocardiogram (cardiac ultrasound), cardiac MRI and cardiac catheterization.
On the basis of treatment, the market has been classified as medication, cardiac catheterization, surgery. The cardiac catheterization is segmented into radiofrequency ablation and balloon valvotomy, balloon atrial septostomy, and stent placement. The surgery is segmented into right ventricular outflow reconstruction, blalock-taussig shunt, bi-directional glenn procedure, fontan procedure, and heart transplant.
On the basis of end users, the market has been classified as hospitals, clinics, diagnostic centers, specialty clinics, research institutes, and others.
On the basis of region, the market is segmented into the Americas, Europe, Asia-Pacific, and the Middle East and Africa. The Americas has been further segmented into North America and South America, with the North American market divided into the US and Canada.
The European pulmonary atresia diagnostics and treatment market has been segmented into Western Europe and Eastern Europe. Western Europe has further been classified as Germany, France, the UK, Italy, Spain, and the rest of Western Europe.
The pulmonary atresia diagnostics and treatment market in Asia-Pacific has been segmented into Japan, China, India, South Korea, Australia, and the rest of Asia-Pacific. The pulmonary atresia diagnostics and treatment market in the Middle East and Africa has been segmented into the Middle East and Africa.
Regional Market Summary
Global Pulmonary Atresia Diagnostics and Treatment Market Share, by Region, 2017 (%)
Source: MRFR Analysis
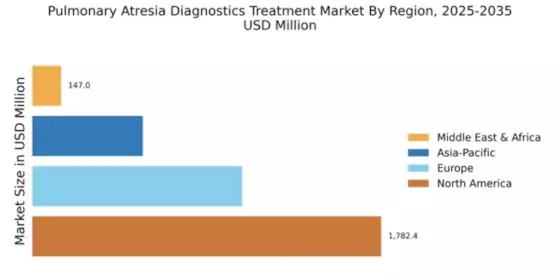
In the pulmonary atresia diagnostics and treatment market, North America is anticipated to account for the largest market share due to the early adoption of advanced medical technologies, continuous development by companies operating into medical devices manufacturing. According to the Centers for Disease Control and Prevention, about 40,000 births are affected by congenital heart defects in the US every year.
The European market is expected to hold the second largest market share. Factors such as a rise in research expenses, advancement of technology, the decline in human health, and the necessity for innovative and effective therapies boost the growth of the market in this region. According to the Centers for Disease Control and Prevention, congenital heart defects are a foremost cause of birth defect associated with infant illness and deaths. The deaths often occur when the infant is less than 28 days old and hence diagnosis of the defect is utmost important.
Whereas the market share in Asia-Pacific region is also anticipated to experience growth in the near future due to access to optimal treatment facilities and growing demand for increasing government initiatives, advanced technology, better adoption rate, and rising healthcare expenditure.
The market in the Middle East & Africa is expected to account for the smallest share of the global pulmonary atresia diagnostics and treatment market due to an underdeveloped healthcare sector, the dearth of technical knowledge, and poor medical facilities.
Key Players
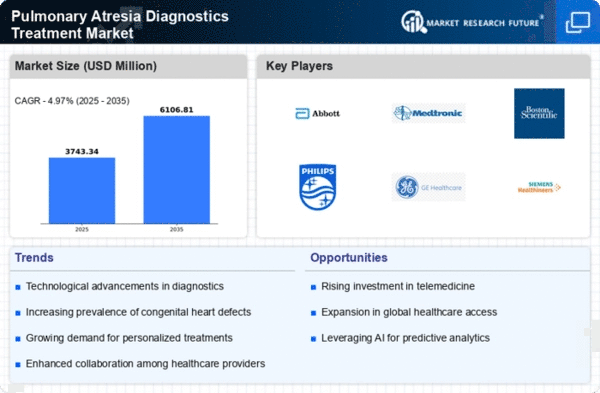
Some of the key players in the global pulmonary atresia diagnostics and treatment market are Kyowa Pharma Chemical Co. Ltd, AZAD partners, Abbott Laboratories, Dickinson and Company, Becton, C. R. Bard, Inc., B. Braun Melsungen AG, Medtronic plc., Teleflex Incorporated, JOHNSON & JOHNSON, Cook Group Incorporated, and Boston Scientific Corporation.
Global Pulmonary Atresia Diagnostics and Treatment Market, by Type
Global Pulmonary Atresia Diagnostics and Treatment Market, by Diagnosis
Global Pulmonary Atresia Diagnostics and Treatment Market, by Treatment
Global Pulmonary Atresia Diagnostics and Treatment Market, by End-Users
Global Pulmonary Atresia Diagnostics and Treatment Market, by Region
Intended Audience
Frequently Asked Questions (FAQ) :
Pulmonary atresia is an inherited, congenital heart defect in which the pulmonary valve between the right ventricle and the pulmonary artery doesn’t form or function properly.
Major ways of diagnosing Pulmonary Atresia are ECG, pulse oximetry, cardiac ultrasound, cardiac MRI, and cardiac catheterization.
Growing awareness about inherited diseases is likely to be the major driver for the Pulmonary Atresia Diagnostics and Treatment Market.
North America is anticipated to account for the largest share in the global Pulmonary Atresia Diagnostics and Treatment Market.
Leading players in the market include Abbott, AZAD Partners, and C.R. Bard, among others.
Table of Contents:
Chapter 1. Report Prologue
Chapter 2. Market Introduction
2.1 Definition
2.2 Scope of the Study
2.2.1 Research Objective
2.2.2 Assumptions
2.2.3 Limitations
Chapter 3. Research Methodology
3.1 Introduction
3.2 Primary Research
3.3 Secondary Research
3.4 Market Size Estimation
Chapter 4. Market Dynamics
4.1 Drivers
4.2 Restraints
4.3 Opportunities
4.4 Challenges
4.5 Macroeconomic Indicators
4.6 Technology Trends & Assessment
Chapter 5. Market Factor Analysis
5.1 Porter’s Five Forces Analysis
5.1.1 Bargaining Power of Suppliers
5.1.2 Bargaining Power of Buyers
5.1.3 Threat of New Entrants
5.1.4 Threat of Substitutes
5.1.5 Intensity of Rivalry
5.2 Value Chain Analysis
5.3 Investment Feasibility Analysis
5.4 Pricing Analysis
Chapter 6. Global Pulmonary Atresia Diagnostics and Treatment Market, by Type
6.1 Introduction
6.2 Pulmonary atresia with intact ventricular septum
Market Estimates & Forecast, by Region, 2020–2027
Market Estimates & Forecast, by Country, 2020–2027
6.3 Pulmonary atresia with ventricular septum defect
Market Estimates & Forecast, by Region, 2020–2027
Market Estimates & Forecast, by Country, 2020–2027
Chapter 7. Global Pulmonary Atresia Diagnostics and Treatment Market, by Diagnosis
7.1 Introduction
7.2 Pulse oximetry
Market Estimates & Forecast, by Region, 2020–2027
Market Estimates & Forecast, by Country, 2020–2027
7.3 Electrocardiogram (ECG)
Market Estimates & Forecast, by Region, 2020–2027
Market Estimates & Forecast, by Country, 2020–2027
7.4 Echocardiogram (cardiac ultrasound)
Market Estimates & Forecast, by Region, 2020–2027
Market Estimates & Forecast, by Country, 2020–2027
7.5 Cardiac MRI
Market Estimates & Forecast, by Region, 2020–2027
Market Estimates & Forecast, by Country, 2020–2027
7.6 Cardiac catheterization
Market Estimates & Forecast, by Region, 2020–2027
Market Estimates & Forecast, by Country, 2020–2027
Chapter 8. Global Pulmonary Atresia Diagnostics and Treatment Market, by Treatment
8.1 Introduction
8.2 Medication
Market Estimates & Forecast, by Region, 2020–2027
Market Estimates & Forecast, by Country, 2020–2027
8.3 Cardiac catheterization
8.3.1 Radiofrequency ablation
Market Estimates & Forecast, by Region, 2020–2027
Market Estimates & Forecast, by Country, 2020–2027
8.3.2 Balloon valvotomy
Market Estimates & Forecast, by Region, 2020–2027
Market Estimates & Forecast, by Country, 2020–2027
8.3.3 Balloon atrial septostomy
Market Estimates & Forecast, by Region, 2020–2027
Market Estimates & Forecast, by Country, 2020–2027
8.3.4 Stent placement
Market Estimates & Forecast, by Region, 2020–2027
Market Estimates & Forecast, by Country, 2020–2027
8.4 Surgery
8.4.1 Right ventricular outflow reconstruction
Market Estimates & Forecast, by Region, 2020–2027
Market Estimates & Forecast, by Country, 2020–2027
8.4.2 Blalock-Taussig Shunt
Market Estimates & Forecast, by Region, 2020–2027
Market Estimates & Forecast, by Country, 2020–2027
8.4.3 Bi-directional Glenn procedure
Market Estimates & Forecast, by Region, 2020–2027
Market Estimates & Forecast, by Country, 2020–2027
8.4.4 Fontan procedure
Market Estimates & Forecast, by Region, 2020–2027
Market Estimates & Forecast, by Country, 2020–2027
8.4.5 Heart transplant
Market Estimates & Forecast, by Region, 2020–2027
Market Estimates & Forecast, by Country, 2020–2027
Chapter 9. Global Pulmonary Atresia Diagnostics and Treatment Market, by End-Users
9.1 Introduction
9.2 Hospitals
Market Estimates & Forecast, by Region, 2020–2027
Market Estimates & Forecast, by Country, 2020–2027
9.3 Clinics
Market Estimates & Forecast, by Region, 2020–2027
Market Estimates & Forecast, by Country, 2020–2027
9.4 Diagnostic centers
Market Estimates & Forecast, by Region, 2020–2027
Market Estimates & Forecast, by Country, 2020–2027
9.5 Specialty Clinics
Market Estimates & Forecast, by Region, 2020–2027
Market Estimates & Forecast, by Country, 2020–2027
9.6 Research Institutes
Market Estimates & Forecast, by Region, 2020–2027
Market Estimates & Forecast, by Country, 2020–2027
9.7 Others
Market Estimates & Forecast, by Region, 2020–2027
Market Estimates & Forecast, by Country, 2020–2027
Chapter 10. Global Pulmonary Atresia Diagnostics and Treatment Market, by Region
10.1 Introduction
10.2 Americas
10.2.1 North America
10.2.1.1 US
10.2.1.2 Canada
10.2.2 South America
10.3 Europe
10.3.1 Western Europe
10.3.1.1 Germany
10.3.1.2 France
10.3.1.3 Italy
10.3.1.4 Spain
10.3.1.5 UK
10.3.1.6 Rest of Western Europe
10.3.2 Eastern Europe
10.4 Asia-Pacific
10.4.1 Japan
10.4.2 China
10.4.3 India
10.4.4 Australia
10.4.5 South Korea
10.4.6 Rest of Asia-Pacific
10.5 Middle East & Africa
10.5.1 Middle East
10.5.2 Africa
Chapter 11. Company Landscape
11.1 Introduction
11.2 Market Share Analysis
11.3 Key Development & Strategies
Chapter 12. Company Profiles
12.1 Kyowa Pharma Chemical Co. Ltd
12.1.1 Company Overview
12.1.2 Type Overview
12.1.3 Financials Overview
12.1.4 Key Developments
12.1.5 SWOT Analysis
12.2 Abbott Laboratories
12.2.1 Company Overview
12.2.2 Type Overview
12.2.3 Financial Overview
12.2.4 Key Developments
10.2.5 SWOT Analysis
12.3 AZAD partners
12.3.1 Company Overview
12.3.2 Type Overview
12.3.3 Financial Overview
12.3.4 Key Development
12.3.5 SWOT Analysis
12.4 Dickinson and Company
12.4.1 Company Overview
12.4.2 Technology/Business Segment Overview
12.4.3 Financial Overview
12.4.4 Key Development
12.4.5 SWOT Analysis
12.5 Becton
12.5.1 Company Overview
12.5.2 Type Overview
12.5.3 Financial overview
12.5.4 Key Developments
12.5.5 SWOT Analysis
12.6 C. R. Bard, Inc.
12.6.1 Company Overview
12.6.2 Type Overview
12.6.3 Financial Overview
12.6.4 Key Developments
12.6.5 SWOT Analysis
12.7 B. Braun Melsungen AG
12.7.1 Overview
12.7.2 Type Overview
12.7.3 Financial Overview
12.7.4 Key Developments
12.7.5 SWOT Analysis
12.8 Medtronic plc.
12.8.1 Overview
12.8.2 Type/ Technology Overview
12.8.3 Financials
12.8.4 Key Developments
12.8.5 SWOT Analysis
12.9 Teleflex Incorporated
12.9.1 Overview
12.9.2 Type Overview
12.9.3 Financials
12.9.4 Key Developments
12.9.5 SWOT Analysis
12.10 JOHNSON & JOHNSON
12.10.1 Overview
12.10.2 Type Overview
12.10.3 Financials
12.10.4 Key Developments
12.10.5 SWOT Analysis
12.11 Cook Group Incorporated
12.11.1 Overview
12.11.2 Type Overview
12.11.3 Financials
12.11.4 Key Developments
12.11.5 SWOT Analysis
12.12 Boston Scientific Corporation
12.12.1 Overview
12.12.2 Type Overview
12.12.3 Financials
12.12.4 Key Developments
12.12.5 SWOT Analysis
Chapter 13 MRFR Conclusion
13.1 Key Findings
13.1.1 From CEO’s Viewpoint
13.1.2 Unmet Needs of the Market
13.2 Key Companies to Watch
13.3 Predictions for the Biosurgery Industry
Chapter 14. Appendix
LIST OF TABLES
Table 1 Global Pulmonary Atresia Diagnostics and Treatment Market Synopsis, 2020–2027
Table 2 Global Pulmonary Atresia Diagnostics and Treatment Market Estimates and Forecast, 2020–2027 (USD Million)
Table 3 Global Pulmonary Atresia Diagnostics and Treatment Market, by Region, 2020–2027 (USD Million)
Table 4 Global Pulmonary Atresia Diagnostics and Treatment Market, by Type, 2020–2027 (USD Million)
Table 5 Global Pulmonary Atresia Diagnostics and Treatment Market, by Diagnosis, 2020–2027 (USD Million)
Table 6 Global Pulmonary Atresia Diagnostics and Treatment Market, by Treatment, 2020–2027 (USD Million)
Table 7 Global Pulmonary Atresia Diagnostics and Treatment Market, by End-users, 2020–2027 (USD Million)
Table 8 North America: Pulmonary Atresia Diagnostics and Treatment Market, by Type, 2020–2027 (USD
Million)
Table 9 North America: Pulmonary Atresia Diagnostics and Treatment Market, by Diagnosis, 2020–2027 (USD Million)
Table 10 North America: Pulmonary Atresia Diagnostics and Treatment Market, by Treatment, 2020–2027 (USD Million)
Table 11 North America: Pulmonary Atresia Diagnostics and Treatment Market, by End-users, 2020–2027 (USD Million)
Table 12 US: Pulmonary Atresia Diagnostics and Treatment Market, by Type, 2020–2027 (USD Million)
Table 13 US: Pulmonary Atresia Diagnostics and Treatment Market, by Diagnosis, 2020–2027 (USD Million)
Table 14 US: Pulmonary Atresia Diagnostics and Treatment Market, by Treatment, 2020–2027 (USD Million)
Table 15 US: Pulmonary Atresia Diagnostics and Treatment Market, by End-users, 2020–2027 (USD Million)
Table 16 Canada: Pulmonary Atresia Diagnostics and Treatment Market, by Type, 2020–2027 (USD Million)
Table 17 Canada Pulmonary Atresia Diagnostics and Treatment Market, by Diagnosis, 2020–2027 (USD Million)
Table 18 Canada: Pulmonary Atresia Diagnostics and Treatment Market, by Treatment, 2020–2027 (USD Million)
Table 19 Canada: Pulmonary Atresia Diagnostics and Treatment Market, by End-users, 2020–2027 (USD Million)
Table 20 South America: Pulmonary Atresia Diagnostics and Treatment Market, by Type, 2020–2027 (USD Million)
Table 21 South America: Pulmonary Atresia Diagnostics and Treatment Market, by Diagnosis, 2020–2027 (USD Million)
Table 22 South America: Pulmonary Atresia Diagnostics and Treatment Market, by Treatment, 2020–2027 (USD Million)
Table 23 South America: Pulmonary Atresia Diagnostics and Treatment Market, by End-users, 2020–2027 (USD Million)
Table 24 Europe: Pulmonary Atresia Diagnostics and Treatment Market, by Type, 2020–2027 (USD Million)
Table 25 Europe Pulmonary Atresia Diagnostics and Treatment Market, by Diagnosis, 2020–2027 (USD Million)
Table 26 Europe: Pulmonary Atresia Diagnostics and Treatment Market, by Treatment, 2020–2027 (USD Million)
Table 27 Europe: Pulmonary Atresia Diagnostics and Treatment Market, by End-users, 2020–2027 (USD Million)
Table 28 Western Europe: Pulmonary Atresia Diagnostics and Treatment Market, by Type, 2020–2027 (USD Million)
Table 29 Western Europe: Pulmonary Atresia Diagnostics and Treatment Market, by Diagnosis, 2020–2027 (USD Million)
Table 30 Western Europe: Pulmonary Atresia Diagnostics and Treatment Market, by Treatment, 2020–2027 (USD Million)
Table 31 Western Europe: Pulmonary Atresia Diagnostics and Treatment Market, by End-users, 2020–2027 (USD Million)
Table 32 Eastern Europe: Pulmonary Atresia Diagnostics and Treatment Market, by Type, 2020–2027 (USD Million)
Table 33 Eastern Europe: Pulmonary Atresia Diagnostics and Treatment Market, by Diagnosis, 2020–2027 (USD Million)
Table 34 Eastern Europe: Pulmonary Atresia Diagnostics and Treatment Market, by Treatment, 2020–2027 (USD Million)
Table 35 Eastern Europe: Pulmonary Atresia Diagnostics and Treatment Market, by End-users, 2020–2027 (USD Million)
Table 36 Asia-Pacific: Pulmonary Atresia Diagnostics and Treatment Market, by Type, 2020–2027 (USD Million)
Table 37 Asia-Pacific: Pulmonary Atresia Diagnostics and Treatment Market, by Diagnosis, 2020–2027 (USD Million)
Table 38 Asia-Pacific: Pulmonary Atresia Diagnostics and Treatment Market, by Treatment, 2020–2027 (USD Million)
Table 39 Asia-Pacific: Pulmonary Atresia Diagnostics and Treatment Market, by End-users, 2020–2027 (USD Million)
Table 40 Middle East & Africa: Pulmonary Atresia Diagnostics and Treatment Market, by Type, 2020–2027 (USD Million)
Table 41 Middle East & Africa: Pulmonary Atresia Diagnostics and Treatment Market, by Diagnosis, 2020–2027 (USD Million)
Table 42 Middle East & Africa: Pulmonary Atresia Diagnostics and Treatment Market, by Treatment, 2020–2027 (USD Million)
Table 43 Middle East & Africa: Pulmonary Atresia Diagnostics and Treatment Market, by End-users, 2020–2027 (USD Million)
LIST OF FIGURES
Figure 1 Research Process
Figure 2 Segmentation for the Global Pulmonary Atresia Diagnostics and Treatment Market
Figure 3 Segmentation Market Dynamics for the Global Pulmonary Atresia Diagnostics and Treatment Market
Figure 4 Global Pulmonary Atresia Diagnostics and Treatment Market Share, by Type, 2020
Figure 5 Global Pulmonary Atresia Diagnostics and Treatment Market, by End-users, 2020–2027 (USD Million)
Figure 6 Global Pulmonary Atresia Diagnostics and Treatment Market Share, by Region, 2020
Figure 7 North America: Pulmonary Atresia Diagnostics and Treatment Market Share, by Country, 2020
Figure 8 Europe: Pulmonary Atresia Diagnostics and Treatment Market Share, by Country, 2020
Figure 9 Asia-Pacific: Pulmonary Atresia Diagnostics and Treatment Market Share, by Country, 2020
Figure 10 Middle East & Africa: Pulmonary Atresia Diagnostics and Treatment Market Share, by Country, 2020
Figure 11 Global Pulmonary Atresia Diagnostics and Treatment Market: Company Share Analysis, 2020 (%)
Figure 12 Kyowa Pharma Chemical Co. Ltd: Key Financials
Figure 13 Kyowa Pharma Chemical Co. Ltd: Segmental Revenue
Figure 14 Kyowa Pharma Chemical Co. Ltd: Geographical Revenue
Figure 15 Abbott Laboratories: Key Financials
Figure 16 Abbott Laboratories: Segmental Revenue
Figure 17 Abbott Laboratories: Geographical Revenue
Figure 18 AZAD partners: Key Financials
Figure 19 AZAD partners: Segmental Revenue
Figure 20 AZAD partners: Geographical Revenue
Figure 21 Dickinson and Company: Key Financials
Figure 22 Dickinson and Company: Segmental Revenue
Figure 23 Dickinson and Company: Geographical Revenue
Figure 24 Becton: Key Financials
Figure 25 Becton: Segmental Revenue
Figure 26 Becton: Geographical Revenue
Figure 27 C. R. Bard, Inc.: Key Financials
Figure 28 C. R. Bard, Inc.: Segmental Revenue
Figure 29 C. R. Bard, Inc.: Geographical Revenue
Figure 30 B. Braun Melsungen AG: Key Financials
Figure 31 B. Braun Melsungen AG: Segmental Revenue
Figure 32 B. Braun Melsungen AG: Geographical Revenue
Figure 33 Medtronic plc.: Key Financials
Figure 34 Medtronic plc.: Segmental Revenue
Figure 35 Medtronic plc.: Geographical Revenue
Figure 36 Teleflex Incorporated: Key Financials
Figure 37 Teleflex Incorporated: Segmental Revenue
Figure 38 Teleflex Incorporated: Geographical Revenue
Figure 39 JOHNSON & JOHNSON: Key Financials
Figure 40 JOHNSON & JOHNSON: Segmental Revenue
Figure 41 JOHNSON & JOHNSON: Geographical Revenue
Figure 42 Cook Group Incorporated: Key Financials
Figure 43 Cook Group Incorporated: Segmental Revenue
Figure 44 Cook Group Incorporated: Geographical Revenue
Figure 45 Boston Scientific Corporation: Key Financials
Figure 46 Boston Scientific Corporation: Segmental Revenue
Figure 47 Boston Scientific Corporation: Geographical Revenue