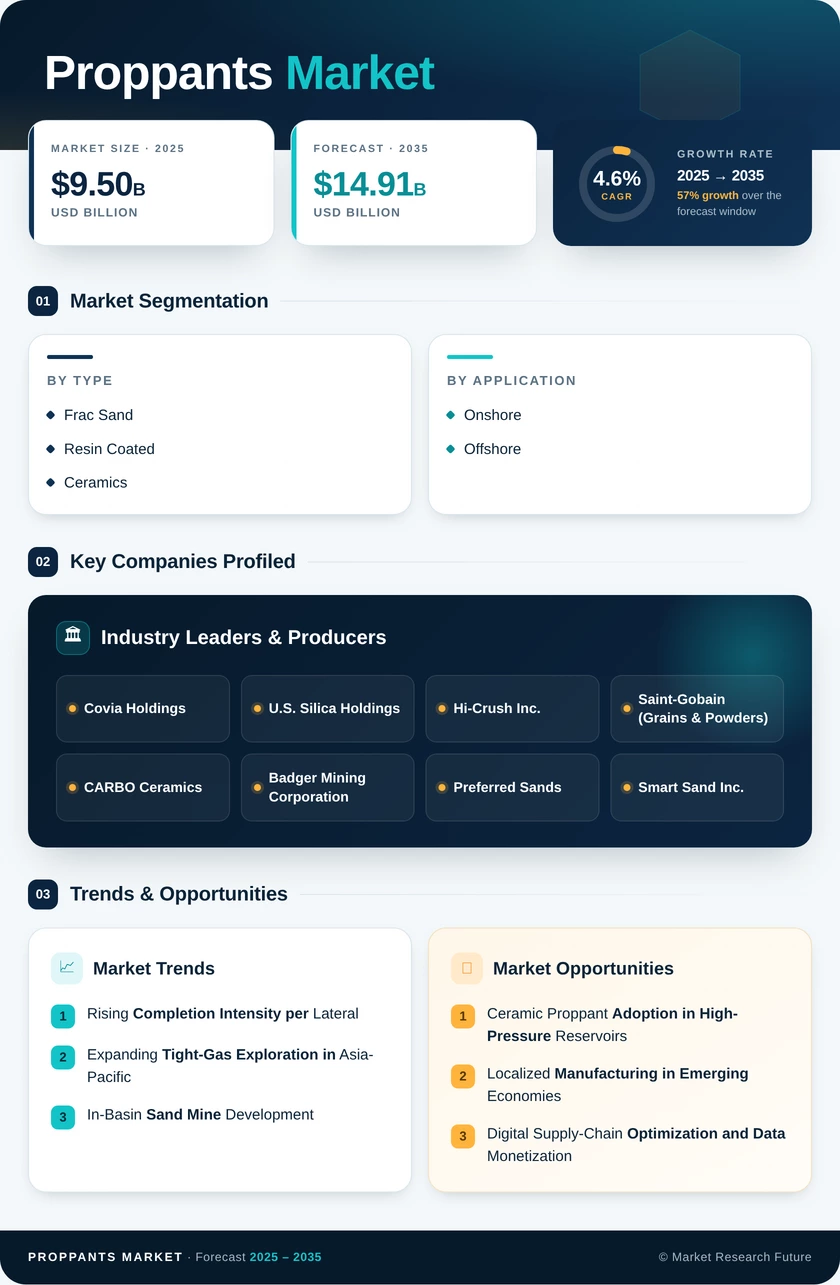
Proppants Market (2026 - 2035)

ID: MRFR/CnM/9075-HCR
180 Pages
Anshula Mandaokar
Last Updated: July 14, 2026
Proppants Market Research Report Information By Product Type (Frac Sand, Resin Coated, and Ceramics), By Application (Onshore and Offshore), and By Region (North America, Europe, Asia-Pacific, Latin America, and Middle East & Africa) – Forecast Till 2035
Proppants Market
Market Size
Forecast Period2026-2035
CAGR (2026-2035)4.6%
2025 Market SizeUSD 9.50 Billion
2035 Market SizeUSD 14.91 Billion
Key Players
Covia Holdings
U.S. Silica Holdings
Hi-Crush Inc.
Saint-Gobain
CARBO Ceramics
Badger Mining Corporation
Opportunities
  • Ceramic Proppant Adoption in High-Pressure Reservoirs
  • Localized Manufacturing in Emerging Economies
  • Digital Supply-Chain Optimization and Data Monetization
  1. 1 Market Overview |
    1. 1.1 Study Assumptions & Market Definition |
    2. 1.2 Scope of the Study |
    3. 1.3 Research Methodology
  2. 2 Market Summary & Key Takeaways
  3. 3 Market Dynamics |
    1. 3.1 Market Drivers Analysis | |
      1. 3.1.1 Rising Completion Intensity per Lateral | |
      2. 3.1.2 Expanding Tight-Gas Exploration in Asia-Pacific | |
      3. 3.1.3 In-Basin Sand Mine Development | |
      4. 3.1.4 Simul-Frac and Zipper-Frac Adoption | |
      5. 3.1.5 API Standards Upgrade for Engineered Proppants | |
      6. 3.1.6 National Gas-Independence Mandates in Emerging Economies |
    2. 3.2 Market Restraints Analysis | |
      1. 3.2.1 Environmental Regulations on Silica Dust Exposure | |
      2. 3.2.2 Hydraulic Fracturing Bans and Moratoriums | |
      3. 3.2.3 Volatile Oil Prices and Capex Cyclicality | |
      4. 3.2.4 Water-Use Restrictions in Arid Drilling Regions | |
      5. 3.2.5 ESG-Driven Capital Withdrawal from Fossil Fuels |
    3. 3.3 Market Opportunity Analysis | |
      1. 3.3.1 Ceramic Proppant Adoption in High-Pressure Reservoirs | |
      2. 3.3.2 Localized Manufacturing in Emerging Economies | |
      3. 3.3.3 Digital Supply-Chain Optimization and Data Monetization | |
      4. 3.3.4 Resin-Coated Proppant Growth in Refracturing Operations | |
      5. 3.3.5 Middle East Unconventional Gas Development |
    4. 3.4 Industry Value Chain Analysis |
    5. 3.5 Porter's Five Forces Analysis
  4. 4 Global Proppants Market Size & Forecast (2021–2035) |
    1. 4.1 Historical Market Size (2021–2025) |
    2. 4.2 Current & Forecast Market Size (2026–2035) |
    3. 4.3 Market Size by Revenue (USD Billion) |
    4. 4.4 Year-over-Year Growth Analysis
  5. 5 Segmentation Analysis |
    1. 5.1 By Product Type | |
      1. 5.1.1 Frac Sand | |
      2. 5.1.2 Resin Coated | |
      3. 5.1.3 Ceramics |
    2. 5.2 By Application | |
      1. 5.2.1 Onshore | |
      2. 5.2.2 Offshore
  6. 6 Regional Analysis |
    1. 6.1 North America | |
      1. 6.1.1 United States | |
      2. 6.1.2 Canada | |
      3. 6.1.3 Mexico |
    2. 6.2 Europe | |
      1. 6.2.1 Germany | |
      2. 6.2.2 United Kingdom | |
      3. 6.2.3 France | |
      4. 6.2.4 Italy | |
      5. 6.2.5 Spain | |
      6. 6.2.6 Nordic Countries | |
      7. 6.2.7 Russia | |
      8. 6.2.8 Rest of Europe |
    3. 6.3 Asia-Pacific | |
      1. 6.3.1 China | |
      2. 6.3.2 India | |
      3. 6.3.3 Japan | |
      4. 6.3.4 South Korea | |
      5. 6.3.5 ASEAN | |
      6. 6.3.6 Rest of Asia-Pacific |
    4. 6.4 South America | |
      1. 6.4.1 Brazil | |
      2. 6.4.2 Argentina | |
      3. 6.4.3 Rest of South America |
    5. 6.5 Middle East & Africa | |
      1. 6.5.1 Saudi Arabia | |
      2. 6.5.2 UAE | |
      3. 6.5.3 South Africa | |
      4. 6.5.4 Egypt | |
      5. 6.5.5 Rest of MEA
  7. 7 Competitive Landscape |
    1. 7.1 Market Share Analysis (2025) |
    2. 7.2 Competitive Benchmarking Matrix |
    3. 7.3 Company Profiles | |
      1. 7.3.1 Covia Holdings | |
      2. 7.3.2 U.S. Silica Holdings | |
      3. 7.3.3 Hi-Crush Inc. | |
      4. 7.3.4 Saint-Gobain (Grains & Powders) | |
      5. 7.3.5 CARBO Ceramics | |
      6. 7.3.6 Badger Mining Corporation | |
      7. 7.3.7 Preferred Sands | |
      8. 7.3.8 Smart Sand Inc. | |
      9. 7.3.9 Atlas Sand Company | |
      10. 7.3.10 Fores (Sinopec subsidiary)
  8. 8 Future Outlook & Strategic Recommendations (2026–2035) |
    1. 8.1 Autonomous Well-Site Operations and AI-Driven Completion Design |
    2. 8.2 Electrification of Fracturing Fleets |
    3. 8.3 ESG Integration and Sustainable Proppant Sourcing |
    4. 8.4 Geopolitical Realignment and Energy Security Mandates
  9. 9 Recent Developments & News
  10. 10 Frequently Asked Questions (FAQs)
  11. 11 Report Scope & Methodology |
    1. 11.1 Study Period & Base Year |
    2. 11.2 Data Sources & Citations |
    3. 11.3 Abbreviations
  12. 12 LIST OF TABLES |
  13. TABLE 1 Global Proppants Market Size & Forecast, by Revenue (USD Billion), 2021–2035 |
  14. TABLE 2 Global Proppants Market — Year-over-Year Growth Analysis, 2021–2035 |
  15. TABLE 3 Global Proppants Market — Driver Impact Analysis |
  16. TABLE 4 Global Proppants Market — Restraint Impact Analysis |
  17. TABLE 5 Global Proppants Market Size, by Product Type, 2021–2035 |
  18. TABLE 6 Global Proppants Market Size, by Application, 2021–2035 |
  19. TABLE 7 Global Proppants Market Size, by Region, 2021–2035 (USD Billion) |
  20. TABLE 8 North America Proppants Market Size, by Country, 2021–2035 |
  21. TABLE 9 Europe Proppants Market Size, by Country, 2021–2035 |
  22. TABLE 10 Asia-Pacific Proppants Market Size, by Country, 2021–2035 |
  23. TABLE 11 South America Proppants Market Size, by Country, 2021–2035 |
  24. TABLE 12 Middle East & Africa Proppants Market Size, by Country, 2021–2035 |
  25. TABLE 13 Competitive Benchmarking Matrix — Global Proppants Market, 2025 |
  26. TABLE 14 Company Profiles — Key Players, Global Proppants Market |
  27. TABLE 15 Recent Developments & Strategic Announcements, 2023–2025 |
  28. TABLE 16 Report Scope & Methodology Summary |
  29. TABLE 17 Detailed Sources and Citations
  30. 13 LIST OF FIGURES |
  31. FIGURE 1 Global Proppants Market Dynamics — Drivers, Restraints, and Opportunities |
  32. FIGURE 2 Proppants Industry Value Chain Analysis |
  33. FIGURE 3 Porter's Five Forces Analysis — Global Proppants Market |
  34. FIGURE 4 Global Proppants Market Size Trend & Forecast (USD Billion), 2021–2035 |
  35. FIGURE 5 Global Proppants Market Share, by Product Type (2025) |
  36. FIGURE 6 Global Proppants Market Share, by Application (2025) |
  37. FIGURE 7 Global Proppants Market Share, by Region (2025) |
  38. FIGURE 8 North America Proppants Market Share, by Country (2025) |
  39. FIGURE 9 Europe Proppants Market Share, by Country (2025) |
  40. FIGURE 10 Asia-Pacific Proppants Market Share, by Country (2025) |
  41. FIGURE 11 South America Proppants Market Share, by Country (2025) |
  42. FIGURE 12 Middle East & Africa Proppants Market Share, by Country (2025) |
  43. FIGURE 13 Competitive Landscape — Global Proppants Market Revenue Share (2025)

Segmentation Quick Reference

DimensionSub-SegmentsDominant SegmentFastest Growing Segment
By Product TypeFrac Sand, Resin Coated, CeramicsFrac SandCeramics
By ApplicationOnshore, OffshoreOnshoreOffshore
By GeographyNorth America, Europe, Asia-Pacific, South America, Middle East & AfricaNorth AmericaNorth America


Market Segmentation Overview

By Product Type

Sub-SegmentKey Trend
Frac SandIn-basin mine migration reducing logistics costs; 100-mesh and 40/70-mesh dominate completion recipes
Resin CoatedGrowing adoption in refracturing operations; phenolic and curable resin systems gaining operator preference
CeramicsPremium-priced but essential for deep, high-pressure formations; Chinese manufacturing capacity expanding rapidly


Frac sand remains the volume backbone of the proppants industry, though its share is gradually declining as operators shift tonnage toward engineered alternatives in high-stress applications. The resin-coated segment occupies a middle ground — offering enhanced performance over raw sand at a fraction of ceramic pricing — and is benefiting from the refracturing trend. Ceramics continue to capture value in the deepest, most demanding formations where crush resistance directly drives well economics.

By Application

Sub-SegmentKey Trend
OnshoreMulti-stage horizontal completions driving record per-well proppant loading; simul-frac adoption accelerating
OffshoreFrac-pack and gravel-pack techniques expanding in deepwater Gulf of Mexico, North Sea, and pre-salt Brazil


Onshore completions account for the vast majority of global proppant consumption, reflecting the global proliferation of horizontal drilling techniques. Offshore demand, while smaller in absolute terms, is growing as deepwater operators adopt more aggressive formation-stimulation approaches to improve recovery rates from subsea reservoirs.


 

Download PDF ×

We do not share your information with anyone. However, we may send you emails based on your report interest from time to time. You may contact us at any time to opt-out.