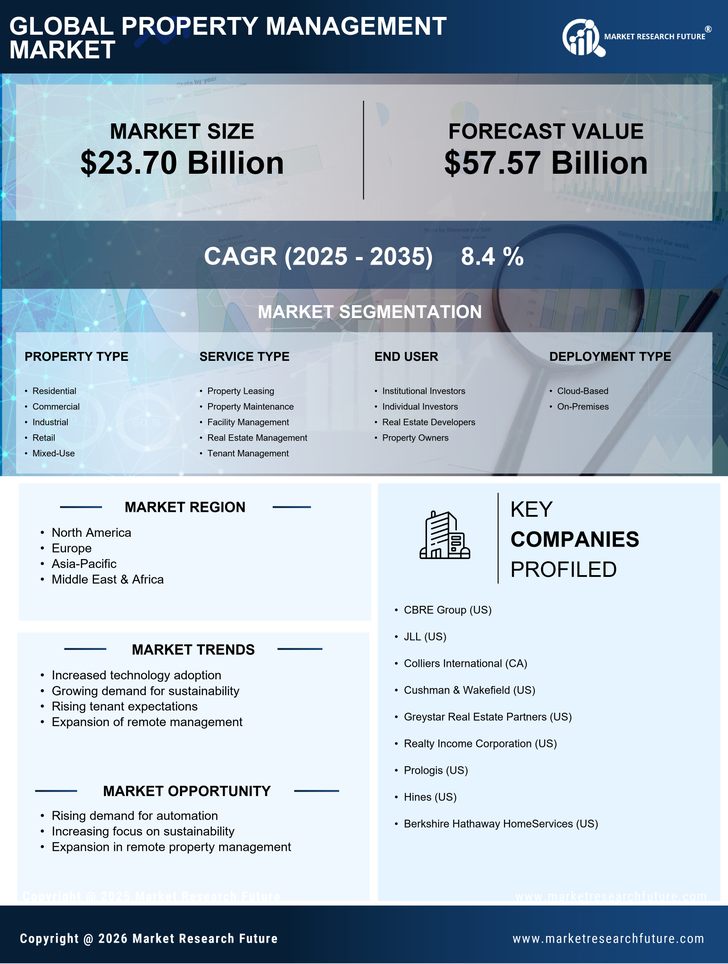
Certified Global Research Member
Isomar fd.webp Wcrc 57.webp
Key Questions Answered
  • Global Market Outlook
  • In-depth analysis of global and regional trends
  • Analyze and identify the major players in the market, their market share, key developments, etc.
  • To understand the capability of the major players based on products offered, financials, and strategies.
  • Identify disrupting products, companies, and trends.
  • To identify opportunities in the market.
  • Analyze the key challenges in the market.
  • Analyze the regional penetration of players, products, and services in the market.
  • Comparison of major players’ financial performance.
  • Evaluate strategies adopted by major players.
  • Recommendations
Why Choose Market Research Future?
  • Vigorous research methodologies for specific market.
  • Knowledge partners across the globe
  • Large network of partner consultants.
  • Ever-increasing/ Escalating data base with quarterly monitoring of various markets
  • Trusted by fortune 500 companies/startups/ universities/organizations
  • Large database of 5000+ markets reports.
  • Effective and prompt pre- and post-sales support.

Property Management Market Research Report Information By Component (Solution, and Services), By Deployment (On-Premise, and Cloud), By Application (Residential, and Commercial), By End-users (Property Manager/Agent, and Housing Association), And By Region (North America, Europe, Asia-Pacific, And Rest Of The World) – Market Forecast Till 2030


ID: MRFR/ICT/7081-HCR | 141 Pages | Author: Ankit Gupta| April 2024

Research Methodology on Property Management Market


The research methodology adopted in this report is based on primary and secondary research data. This report focuses on the recent trends in the global property management market and its future potential.


Primary Research


Primary research is the gathering of information by interviewing key industry players, based on their data and analyzing the market outlook. The primary research for this report is conducted using qualitative and quantitative analysis.


For in-depth analysis, a qualitative method of primary research is adopted. The data collected from interviews with C-level executives from various MNCs and industry experts support validating and substantiating the secondary data research findings.


Secondary Research


The secondary phase of the research process is carried out by collecting and analyzing the data from different sources such as reports, industry associations, industry portals, analyst reports, and magazines.


Market size and forecast are calculated after analyzing the secondary data points gathered from the sources. Data points such as industry trends, market announcements, new product launches, and M&A activities.


The information collected from the sources is validated using techniques such as triangulation and data integration which includes both top-down and bottom-up approaches.


Industry Analysis


We have conducted an industry analysis specific to the Property Management sector. The analysis is based on Porter’s Five Forces Model, PESTEL and other relevant models.


The industry analysis provides an in-depth view of the global property management market including the current, and expected market size, industry trends and the competitive landscape of players in the market. The competitive landscape is assessed based on key parameters like competitive intensity, brand presence, innovation, pricing and other players in the market.


Market Measurement


The market value is estimated based on the geographical segmentation of the market and the key countries profiled in the report. The market value and volume data obtained from statistics such as statistical reports, press releases, and annual reports presented in the report are validated to ensure accuracy.


The information and data used in the report are from sources deemed to be reliable. However, the accuracy of the report is subject to human interpretations which are prone to errors. Availability of data may not always be as required. Despite these drawbacks, we are making continuous efforts in providing the best report to our readers.

Leading companies partner with us for data-driven Insights
client_1 client_2 client_3 client_4 client_5 client_6 client_7 client_8 client_9 client_10
Please fill in Business Email for Quick Response

Table of Contents

1. EXECUTIVE SUMMARY

1.1. Market Attractiveness Analysis

1.1.1. Global Property Management Market, By Component

1.1.2. Global Property Management Market, By Deployment

1.1.3. Global Property Management Market, By End-user

1.1.4. Global Property Management Market, By Application

1.1.5. Global Property Management Market, By Region

2. MARKET INTRODUCTION

2.1. Definition

2.2. Scope of the Study

2.3. Market Structure

3. RESEARCH METHODOLOGY

3.1. Research Process

3.2. Primary Research

3.3. Secondary Research

3.4. Market Size Estimation

3.5. Forecast Model

3.6. List of Assumptions

4. MARKET DYNAMICS

4.1. Introduction

4.2. Drivers

4.2.1. Increasing demand for SaaS-based Property Management Solution

4.2.2. Growing Number of Smart Building Projects

4.3. Restraints

4.3.1. Budgetary limitation

4.4. Opportunities

4.4.1. Integration of Building Information Modeling with Property Management Solution

4.5. Challenge

4.5.1. Lack of Technical Skills

5. MARKET FACTOR ANALYSIS

5.1. Value Chain Analysis/Supply Chain Analysis

5.2. Porter’s Five Forces Model

5.2.1. Bargaining Power of Suppliers

5.2.2. Bargaining Power of Buyers

5.2.3. Threat of New Entrants

5.2.4. Threat of Substitutes

5.2.5. Intensity of Rivalry

6. GLOBAL PROPERTY MANAGEMENT MARKET, BY COMPONENT

6.1. Introduction

6.2. Solution

6.3. Services

6.3.1. Integration Service

6.3.2. Consulting Service

6.3.3. Training and Maintenance Service

7. GLOBAL PROPERTY MANAGEMENT MARKET, BY DEPLOYMENT

7.1. Introduction

7.2. On-Premise

7.3. Cloud

8. GLOBAL PROPERTY MANAGEMENT MARKET, BY END-USER

8.1. Introduction

8.2. Property Manager/Agent

8.3. Housing Association

9. GLOBAL PROPERTY MANAGEMENT MARKET, BY APPLICATION

9.1. Introduction

9.2. Residential

9.3. Commercial

9.3.1. Retail

9.3.2. Hospitality

9.3.3. Office Spaces

9.3.4. Others

10. GLOBAL PROPERTY MANAGEMENT MARKET, BY REGION

10.1. Introduction

10.2. North America

10.2.1. US

10.2.2. Canada

10.2.3. Mexico

10.3. Europe

10.3.1. Germany

10.3.2. France

10.3.3. UK

10.3.4. Rest of Europe

10.4. Asia-Pacific

10.4.1. China

10.4.2. India

10.4.3. Rest of Asia-Pacific

10.5. Middle East & Africa

10.6. South America

11. COMPETITIVE LANDSCAPE

11.1. Introduction

11.2. Competitive Benchmarking

11.3. Vendor Share Analysis

11.4. Recent Developments

11.4.1. New Product Launches

11.4.2. Partnerships/Agreements/Collaborations

11.4.3. Mergers and Acquisitions

11.4.4. Business Expansion

12. COMPANY PROFILES

12.1. Skyline Property Management

12.1.1. Company Overview

12.1.2. Financial Overview

12.1.3. Products Offered

12.1.4. Key Developments

12.1.5. SWOT Analysis

12.1.6. Key Strategies

12.2. Re-Leased Software Company Ltd.

12.2.1. Company Overview

12.2.2. Financial Overview

12.2.3. Products Offered

12.2.4. Key Developments

12.2.5. SWOT Analysis

12.2.6. Key Strategies

12.3. Rosmiman Software Corporation

12.3.1. Company Overview

12.3.2. Financial Overview

12.3.3. Products Offered

12.3.4. Key Developments

12.3.5. SWOT Analysis

12.3.6. Key Strategies

12.4. MRI Software LLC

12.4.1. Company Overview

12.4.2. Financial Overview

12.4.3. Products Offered

12.4.4. Key Developments

12.4.5. SWOT Analysis

12.4.6. Key Strategies

12.5. Buildium

12.5.1. Company Overview

12.5.2. Financial Overview

12.5.3. Products Offered

12.5.4. Key Developments

12.5.5. SWOT Analysis

12.5.6. Key Strategies

12.6. Yardi Systems, Inc.

12.6.1. Company Overview

12.6.2. Financial Overview

12.6.3. Products Offered

12.6.4. Key Developments

12.6.5. SWOT Analysis

12.6.6. Key Strategies

12.7. AppFolio, Inc.

12.7.1. Company Overview

12.7.2. Financial Overview

12.7.3. Products Offered

12.7.4. Key Developments

12.7.5. SWOT Analysis

12.7.6. Key Strategies

12.8. IBM

12.8.1. Company Overview

12.8.2. Financial Overview

12.8.3. Products Offered

12.8.4. Key Developments

12.8.5. SWOT Analysis

12.8.6. Key Strategies

12.9. Oracle

12.9.1. Company Overview

12.9.2. Financial Overview

12.9.3. Products Offered

12.9.4. Key Developments

12.9.5. SWOT Analysis

12.9.6. Key Strategies

12.10. SAP

12.10.1. Company Overview

12.10.2. Financial Overview

12.10.3. Products Offered

12.10.4. Key Developments

12.10.5. SWOT Analysis

12.10.6. Key Strategies

12.11. Trimble Inc.

12.11.1. Company Overview

12.11.2. Financial Overview

12.11.3. Products Offered

12.11.4. Key Developments

12.11.5. SWOT Analysis

12.11.6. Key Strategies

12.12. RealPage, Inc.

12.12.1. Company Overview

12.12.2. Financial Overview

12.12.3. Products Offered

12.12.4. Key Developments

12.12.5. SWOT Analysis

12.12.6. Key Strategies

12.13. Accruent

12.13.1. Company Overview

12.13.2. Financial Overview

12.13.3. Products Offered

12.13.4. Key Developments

12.13.5. SWOT Analysis

12.13.6. Key Strategies

12.14. Spacewell

12.14.1. Company Overview

12.14.2. Financial Overview

12.14.3. Products Offered

12.14.4. Key Developments

12.14.5. SWOT Analysis

12.14.6. Key Strategies

12.15. Chetu Inc.

12.15.1. Company Overview

12.15.2. Financial Overview

12.15.3. Products Offered

12.15.4. Key Developments

12.15.5. SWOT Analysis

12.15.6. Key Strategies

13. APPENDIX

13.1.1. Discussion Blueprint

NOTE:

This table of content is tentative and subject to change as the research progresses.

In section 12, only the top 15 companies will be profiled. Each company will be profiled based on the Market Overview, Financials, Product Portfolio, Business Strategies, and Recent Developments parameters.

Please note: The financial details of the company cannot be provided if the information is not available in the public domain and or from reliable sources.

LIST OF TABLES

TABLE 1 LIST OF ASSUMPTIONS

TABLE 2 GLOBAL PROPERTY MANAGEMENT MARKET, BY COMPONENT, 2020–2027 (USD MILLION)

TABLE 3 GLOBAL PROPERTY MANAGEMENT MARKET, BY DEPLOYMENT, 2020–2027 (USD MILLION)

TABLE 3 GLOBAL PROPERTY MANAGEMENT MARKET, BY END-USER, 2020–2027 (USD MILLION)

TABLE 4 GLOBAL PROPERTY MANAGEMENT MARKET, BY APPLICATION, 2020–2027 (USD MILLION)

TABLE 5 GLOBAL PROPERTY MANAGEMENT MARKET, BY REGION, 2020–2027 (USD MILLION)

TABLE 6 NORTH AMERICA: PROPERTY MANAGEMENT MARKET, BY COUNTRY, 2020–2027 (USD MILLION)

TABLE 7 NORTH AMERICA: PROPERTY MANAGEMENT MARKET, BY COMPONENT, 2020–2027 (USD MILLION)

TABLE 8 NORTH AMERICA: PROPERTY MANAGEMENT MARKET, BY DEPLOYMENT, 2020–2027 (USD MILLION)

TABLE 9 NORTH AMERICA: PROPERTY MANAGEMENT MARKET, BY END-USER, 2020–2027 (USD MILLION)

TABLE 10 NORTH AMERICA: PROPERTY MANAGEMENT MARKET, BY APPLICATION, 2020–2027 (USD MILLION)

TABLE 11 US: PROPERTY MANAGEMENT MARKET, BY COMPONENT, 2020–2027 (USD MILLION)

TABLE 13 US: PROPERTY MANAGEMENT MARKET, BY DEPLOYMENT, 2020–2027 (USD MILLION)

TABLE 14 US: PROPERTY MANAGEMENT MARKET, BY END-USER, 2020–2027 (USD MILLION)

TABLE 15 US: PROPERTY MANAGEMENT MARKET, BY APPLICATION, 2020–2027 (USD MILLION)

TABLE 16 CANADA: PROPERTY MANAGEMENT MARKET, BY COMPONENT, 2020–2027 (USD MILLION)

TABLE 17 CANADA: PROPERTY MANAGEMENT MARKET, BY DEPLOYMENT, 2020–2027 (USD MILLION)

TABLE 18 CANADA: PROPERTY MANAGEMENT MARKET, BY END-USER, 2020–2027 (USD MILLION)

TABLE 19 CANADA: PROPERTY MANAGEMENT MARKET, BY APPLICATION, 2020–2027 (USD MILLION)

TABLE 20 MEXICO: PROPERTY MANAGEMENT MARKET, BY COMPONENT, 2020–2027 (USD MILLION)

TABLE 21 GLOBAL PROPERTY MANAGEMENT MARKET, BY DEPLOYMENT, 2020–2027 (USD MILLION)

TABLE 22 MEXICO: PROPERTY MANAGEMENT MARKET, BY END-USER, 2020–2027 (USD MILLION)

TABLE 23 MEXICO: PROPERTY MANAGEMENT MARKET, BY APPLICATION, 2020–2027 (USD MILLION)

TABLE 24 EUROPE: PROPERTY MANAGEMENT MARKET, BY COUNTRY, 2020–2027 (USD MILLION)

TABLE 25 EUROPE: PROPERTY MANAGEMENT MARKET, BY COMPONENT, 2020–2027 (USD MILLION)

TABLE 26 EUROPE: PROPERTY MANAGEMENT MARKET, BY DEPLOYMENT, 2020–2027 (USD MILLION)

TABLE 27 EUROPE: PROPERTY MANAGEMENT MARKET, BY END-USER, 2020–2027 (USD MILLION)

TABLE 28 EUROPE: PROPERTY MANAGEMENT MARKET, BY APPLICATION, 2020–2027 (USD MILLION)

TABLE 29 UK: PROPERTY MANAGEMENT MARKET, BY COMPONENT, 2020–2027 (USD MILLION)

TABLE 30 UK: PROPERTY MANAGEMENT MARKET, BY DEPLOYMENT, 2020–2027 (USD MILLION)

TABLE 31 UK: PROPERTY MANAGEMENT MARKET, BY END-USER, 2020–2027 (USD MILLION)

TABLE 32 UK: PROPERTY MANAGEMENT MARKET, BY APPLICATION, 2020–2027 (USD MILLION)

TABLE 33 GERMANY: PROPERTY MANAGEMENT MARKET, BY COMPONENT, 2020–2027 (USD MILLION)

TABLE 34 GERMANY: PROPERTY MANAGEMENT MARKET, BY DEPLOYMENT, 2020–2027 (USD MILLION)

TABLE 35 GERMANY: PROPERTY MANAGEMENT MARKET, BY END-USER, 2020–2027 (USD MILLION)

TABLE 36 GERMANY: PROPERTY MANAGEMENT MARKET, BY APPLICATION, 2020–2027 (USD MILLION)

TABLE 37 FRANCE: PROPERTY MANAGEMENT MARKET, BY COMPONENT, 2020–2027 (USD MILLION)

TABLE 38 FRANCE: PROPERTY MANAGEMENT MARKET, BY DEPLOYMENT, 2020–2027 (USD MILLION)

TABLE 39 FRANCE: PROPERTY MANAGEMENT MARKET, BY END-USER, 2020–2027 (USD MILLION)

TABLE 40 FRANCE: PROPERTY MANAGEMENT MARKET, BY APPLICATION, 2020–2027 (USD MILLION)

TABLE 41 REST OF EUROPE: PROPERTY MANAGEMENT MARKET, BY COMPONENT, 2020–2027 (USD MILLION)

TABLE 42 REST OF EUROPE: PROPERTY MANAGEMENT MARKET, BY DEPLOYMENT, 2020–2027 (USD MILLION)

TABLE 43 REST OF EUROPE: PROPERTY MANAGEMENT MARKET, BY END-USER, 2020–2027 (USD MILLION)

TABLE 44 REST OF EUROPE: PROPERTY MANAGEMENT MARKET, BY APPLICATION, 2020–2027 (USD MILLION)

TABLE 45 ASIA-PACIFIC: PROPERTY MANAGEMENT MARKET, BY COUNTRY, 2020–2027 (USD MILLION)

TABLE 46 ASIA-PACIFIC: PROPERTY MANAGEMENT MARKET, BY DEPLOYMENT, 2020–2027 (USD MILLION)

TABLE 47 ASIA-PACIFIC: PROPERTY MANAGEMENT MARKET, BY COMPONENT, 2020–2027 (USD MILLION)

TABLE 48 ASIA-PACIFIC: PROPERTY MANAGEMENT MARKET, BY END-USER, 2020–2027 (USD MILLION)

TABLE 49 ASIA-PACIFIC: PROPERTY MANAGEMENT MARKET, BY APPLICATION, 2020–2027 (USD MILLION)

TABLE 50 CHINA: PROPERTY MANAGEMENT MARKET, BY COMPONENT, 2020–2027 (USD MILLION)

TABLE 51 CHINA: PROPERTY MANAGEMENT MARKET, BY DEPLOYMENT, 2020–2027 (USD MILLION)

TABLE 52 CHINA: PROPERTY MANAGEMENT MARKET, BY END-USER, 2020–2027 (USD MILLION)

TABLE 53 CHINA: PROPERTY MANAGEMENT MARKET, BY APPLICATION, 2020–2027 (USD MILLION)

TABLE 54 INDIA: PROPERTY MANAGEMENT MARKET, BY COMPONENT, 2020–2027 (USD MILLION)

TABLE 55 INDIA: PROPERTY MANAGEMENT MARKET, BY DEPLOYMENT, 2020–2027 (USD MILLION)

TABLE 56 INDIA: PROPERTY MANAGEMENT MARKET, BY END-USER, 2020–2027 (USD MILLION)

TABLE 57 INDIA: PROPERTY MANAGEMENT MARKET, BY APPLICATION, 2020–2027 (USD MILLION)

TABLE 58 JAPAN: PROPERTY MANAGEMENT MARKET, BY COMPONENT, 2020–2027 (USD MILLION)

TABLE 59 JAPAN: PROPERTY MANAGEMENT MARKET, BY DEPLOYMENT, 2020–2027 (USD MILLION)

TABLE 60: JAPAN: PROPERTY MANAGEMENT MARKET, BY END-USER, 2020–2027 (USD MILLION)

TABLE 61: JAPAN: PROPERTY MANAGEMENT MARKET, BY APPLICATION, 2020–2027 (USD MILLION)

TABLE 62: REST OF ASIA-PACIFIC: PROPERTY MANAGEMENT MARKET, BY COMPONENT, 2020–2027 (USD MILLION)

TABLE 63: REST OF ASIA-PACIFIC: PROPERTY MANAGEMENT MARKET, BY DEPLOYMENT, 2020–2027 (USD MILLION)

TABLE 64: REST OF ASIA-PACIFIC: PROPERTY MANAGEMENT MARKET, BY END-USER, 2020–2027 (USD MILLION)

TABLE 65: REST OF ASIA-PACIFIC: PROPERTY MANAGEMENT MARKET, BY APPLICATION, 2020–2027 (USD MILLION)

TABLE 66: MIDDLE EAST AND AFRICA: PROPERTY MANAGEMENT MARKET, BY COMPONENT, 2020–2027 (USD MILLION)

TABLE 67: MIDDLE EAST AND AFRICA: PROPERTY MANAGEMENT MARKET, BY DEPLOYMENT, 2020–2027 (USD MILLION)

TABLE 68: MIDDLE EAST AND AFRICA: PROPERTY MANAGEMENT MARKET, BY END-USER, 2020–2027 (USD MILLION)

TABLE 69: MIDDLE EAST AND AFRICA: PROPERTY MANAGEMENT MARKET, BY APPLICATION, 2020–2027 (USD MILLION)

TABLE 70: SOUTH AMERICA: PROPERTY MANAGEMENT MARKET, BY COMPONENT, 2020–2027 (USD MILLION)

TABLE 71: SOUTH AMERICA: PROPERTY MANAGEMENT MARKET, BY DEPLOYMENT, 2020–2027 (USD MILLION)

TABLE 72: SOUTH AMERICA: PROPERTY MANAGEMENT MARKET, BY END-USER, 2020–2027 (USD MILLION)

TABLE 73: SOUTH AMERICA: PROPERTY MANAGEMENT MARKET, BY APPLICATION, 2020–2027 (USD MILLION)

LIST OF FIGURES

FIGURE 1 MARKET SYNOPSIS

FIGURE 2 RESEARCH PROCESS OF MRFR

FIGURE 3 TOP DOWN & BOTTOM-UP APPROACH

FIGURE 4 GLOBAL PROPERTY MANAGEMENT MARKET, BY COMPONENT, 2020–2027 (USD MILLION)

FIGURE 5 GLOBAL PROPERTY MANAGEMENT MARKET, BY DEPLOYMENT, 2020–2027 (USD MILLION)

FIGURE 6 GLOBAL PROPERTY MANAGEMENT MARKET, BY END-USER, 2020–2027 (USD MILLION)

FIGURE 7 GLOBAL PROPERTY MANAGEMENT MARKET, BY APPLICATION, 2020–2027 (USD MILLION)

FIGURE 8 GLOBAL PROPERTY MANAGEMENT MARKET, BY REGION, 2020–2027 (USD MILLION)

FIGURE 9 NORTH AMERICA: PROPERTY MANAGEMENT MARKET, BY COUNTRY, 2020–2027 (USD MILLION)

FIGURE 10 NORTH AMERICA: PROPERTY MANAGEMENT MARKET, BY COMPONENT, 2020–2027 (USD MILLION)

FIGURE 11 NORTH AMERICA: PROPERTY MANAGEMENT MARKET, BY COMPONENT, 2020–2027 (USD MILLION)

FIGURE 12 NORTH AMERICA: PROPERTY MANAGEMENT MARKET, BY END-USER, 2020–2027 (USD MILLION)

FIGURE 13 NORTH AMERICA: PROPERTY MANAGEMENT MARKET, BY APPLICATION, 2020–2027 (USD MILLION)

FIGURE 14 EUROPE: PROPERTY MANAGEMENT MARKET, BY COUNTRY, 2020–2027 (USD MILLION)

FIGURE 15 EUROPE: PROPERTY MANAGEMENT MARKET, BY COMPONENT, 2020–2027 (USD MILLION)

FIGURE 16 EUROPE: PROPERTY MANAGEMENT MARKET, BY DEPLOYMENT, 2020–2027 (USD MILLION)

FIGURE 17 EUROPE: PROPERTY MANAGEMENT MARKET, BY END-USER, 2020–2027 (USD MILLION)

FIGURE 18 EUROPE: PROPERTY MANAGEMENT MARKET, BY APPLICATION, 2020–2027 (USD MILLION)

FIGURE 19 ASIA-PACIFIC: PROPERTY MANAGEMENT MARKET, BY COUNTRY, 2020–2027 (USD MILLION)

FIGURE 20 ASIA-PACIFIC: PROPERTY MANAGEMENT MARKET, BY COMPONENT, 2020–2027 (USD MILLION)

FIGURE 21 ASIA-PACIFIC: PROPERTY MANAGEMENT MARKET, BY DEPLOYMENT, 2020–2027 (USD MILLION)

FIGURE 22 ASIA-PACIFIC: PROPERTY MANAGEMENT MARKET, BY END-USER, 2020–2027 (USD MILLION)

FIGURE 23 ASIA-PACIFIC: PROPERTY MANAGEMENT MARKET, BY APPLICATION, 2020–2027 (USD MILLION)

FIGURE 24 MIDDLE EAST & AFRICA: PROPERTY MANAGEMENT MARKET, BY COMPONENT, 2020–2027 (USD MILLION)

FIGURE 25 MIDDLE EAST & AFRICA: PROPERTY MANAGEMENT MARKET, BY DEPLOYMENT, 2020–2027 (USD MILLION)

FIGURE 26 MIDDLE EAST & AFRICA: PROPERTY MANAGEMENT MARKET, BY END-USER, 2020–2027 (USD MILLION)

FIGURE 27 MIDDLE EAST & AFRICA: PROPERTY MANAGEMENT MARKET, BY APPLICATION, 2020–2027 (USD MILLION)

FIGURE 28 SOUTH AMERICA: PROPERTY MANAGEMENT MARKET, BY COMPONENT, 2020–2027 (USD MILLION)

FIGURE 29 SOUTH AMERICA: PROPERTY MANAGEMENT MARKET, BY DEPLOYMENT, 2020–2027 (USD MILLION)

FIGURE 30 SOUTH AMERICA: PROPERTY MANAGEMENT MARKET, BY END-USER, 2020–2027 (USD MILLION)

FIGURE 31 SOUTH AMERICA: PROPERTY MANAGEMENT MARKET, BY APPLICATION, 2020–2027 (USD MILLION)

Purchase Option
Single User $ 4,950
Multiuser License $ 5,950
Enterprise User $ 7,250
Compare Licenses
Tailored for You
  • Dedicated Research on any specifics segment or region.
  • Focused Research on specific players in the market.
  • Custom Report based only on your requirements.
  • Flexibility to add or subtract any chapter in the study.
  • Historic data from 2014 and forecasts outlook till 2040.
  • Flexibility of providing data/insights in formats (PDF, PPT, Excel).
  • Provide cross segmentation in applicable scenario/markets.