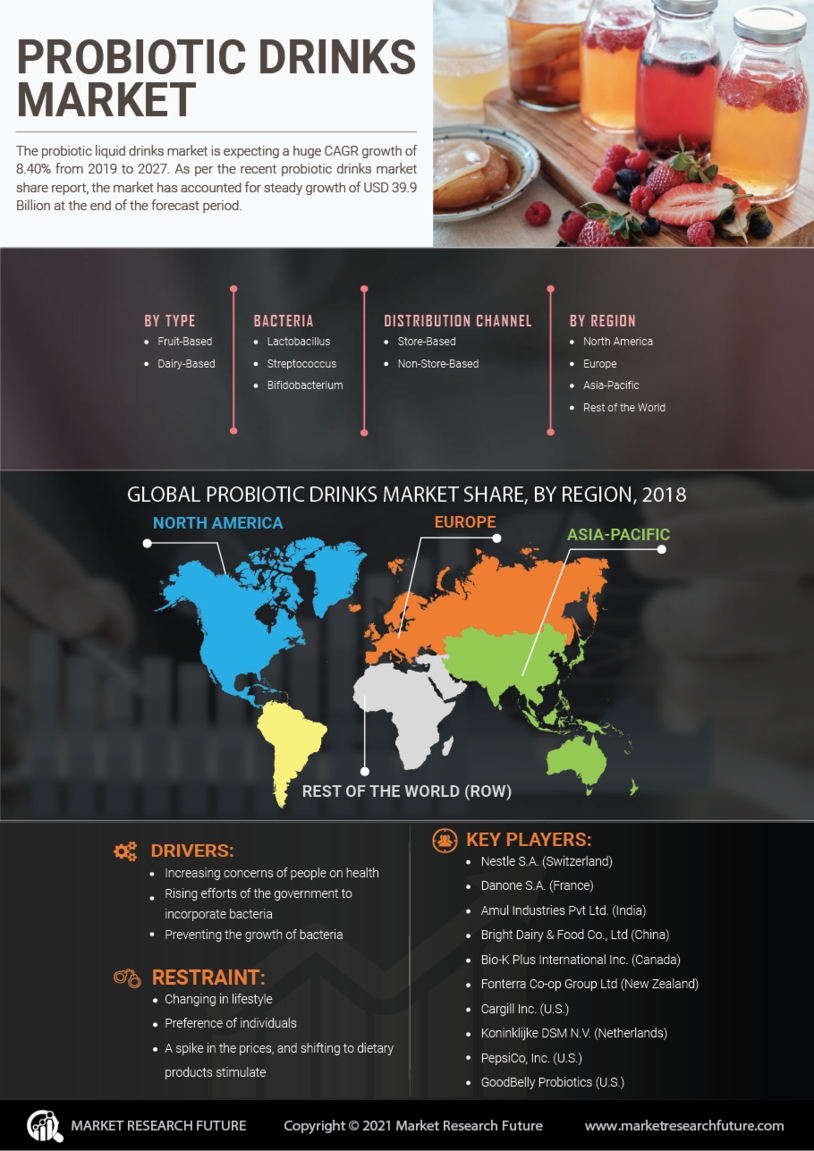
ID: MRFR/F-B & N/3566-HCR | 110 Pages | Author: Snehal Singh | March 2024
TABLE OF CONTENTS
1. 1 EXECUTIVE SUMMARY
1.1. Market Attractiveness Analysis
1.1.1. Global Probiotic Drinks Market, by Type
1.1.2. Global Probiotic Drinks Market, by Bacteria
1.1.3. Global Probiotic Drinks Market, by Distribution Channel
1.1.4. Global Probiotic Drinks Market, by Region
2. MARKET INTRODUCTION
2.1. Definition
2.2. Scope of the Study
2.3. Market Structure
2.4. Key Buying Criteria
2.5. Macro Factor Indicator Analysis
3. RESEARCH METHODOLOGY
3.1. Research Process
3.2. Primary Research
3.3. Secondary Research
3.4. Market Size Estimation
3.5. Forecast Model
3.6. List of Assumptions
4. MARKET DYNAMICS
4.1. Introduction
4.2. Drivers
4.3. Restraints
4.4. Opportunities
4.5. Challenges
5. MARKET FACTOR ANALYSIS
5.1. Value Chain Analysis
5.2. Supply Chain Analysis
5.3. Porterโs Five Forces Model
5.3.1. Bargaining Power of Suppliers
5.3.2. Bargaining Power of Buyers
5.3.3. Threat of New Entrants
5.3.4. Threat of Substitutes
5.3.5. Intensity of Rivalry
6. GLOBAL PROBIOTIC DRINKS MARKET, BY TYPE
6.1. Introduction
6.2. Fruit-Based
6.2.1. Fruit-Based: Market Estimates & Forecast, by Region/Country, 2023-2030
6.3. Dairy-Based
6.3.1. Dairy-Based: Market Estimates & Forecast, by Region/Country, 2023-2030
6.4. Others
6.4.1. Others: Market Estimates & Forecast, by Region/Country, 2023-2030
7. GLOBAL PROBIOTIC DRINKS MARKET, BY BACTERIA
7.1. Introduction
7.2. Lactobacillus
7.2.1. Lactobacillus: Market Estimates & Forecast, by Region/Country, 2023-2030
7.3. Streptococcus
7.3.1. Streptococcus: Market Estimates & Forecast, by Region/Country, 2023-2030
7.4. Bifidobacterium
7.4.1. Bifidobacterium: Market Estimates & Forecast, by Region/Country, 2023-2030
7.5. Others
7.5.1. Others: Market Estimates & Forecast, by Region/Country, 2023-2030
8. GLOBAL PROBIOTIC DRINKS MARKET, BY DISTRIBUTION CHANNEL
8.1. Introduction
8.2. Store-Based
8.2.1. Store-Based: Market Estimates & Forecast, by Region/Country, 2023-2030
8.2.2. Supermarkets & Hypermarkets
8.2.2.1. Supermarkets & Hypermarkets: Market Estimates & Forecast, by Region/Country, 2023-2030
8.2.3. Convenience Stores
8.2.3.1. Convenience Stores: Market Estimates & Forecast, by Region/Country, 2023-2030
8.2.4. Others
8.2.4.1. Others: Market Estimates & Forecast, by Region/Country, 2023-2030
8.3. Non-Store-Based
8.3.1. Non-Store-Based: Market Estimates & Forecast, by Region/Country, 2023-2030
9. GLOBAL PROBIOTIC DRINKS MARKET, BY REGION
9.1. Introduction
9.2. North America
9.2.1. Market Estimates & Forecast, by Type, 2023-2030
9.2.2. Market Estimates & Forecast, by Bacteria, 2023-2030
9.2.3. Market Estimates & Forecast, by Distribution Channel, 2023-2030
9.2.4. Market Estimates & Forecast, by Country, 2023-2030
9.2.5. US
9.2.5.1. Market Estimates & Forecast, by Type, 2023-2030
9.2.5.2. Market Estimates & Forecast, by Bacteria, 2023-2030
9.2.5.3. Market Estimates & Forecast, by Distribution Channel, 2023-2030
9.2.6. Canada
9.2.6.1. Market Estimates & Forecast, by Type, 2023-2030
9.2.6.2. Market Estimates & Forecast, by Bacteria, 2023-2030
9.2.6.3. Market Estimates & Forecast, by Distribution Channel, 2023-2030
9.2.7. Mexico
9.2.7.1. Market Estimates & Forecast, by Type, 2023-2030
9.2.7.2. Market Estimates & Forecast, by Bacteria, 2023-2030
9.2.7.3. Market Estimates & Forecast, by Distribution Channel, 2023-2030
9.3. Europe
9.3.1. Market Estimates & Forecast, by Type, 2023-2030
9.3.2. Market Estimates & Forecast, by Bacteria, 2023-2030
9.3.3. Market Estimates & Forecast, by Distribution Channel, 2023-2030
9.3.4. Market Estimates & Forecast, by Country, 2023-2030
9.3.5. Germany
9.3.5.1. Market Estimates & Forecast, by Type, 2023-2030
9.3.5.2. Market Estimates & Forecast, by Bacteria, 2023-2030
9.3.5.3. Market Estimates & Forecast, by Distribution Channel, 2023-2030
9.3.6. UK
9.3.6.1. Market Estimates & Forecast, by Type, 2023-2030
9.3.6.2. Market Estimates & Forecast, by Bacteria, 2023-2030
9.3.6.3. Market Estimates & Forecast, by Distribution Channel, 2023-2030
9.3.7. France
9.3.7.1. Market Estimates & Forecast, by Type, 2023-2030
9.3.7.2. Market Estimates & Forecast, by Bacteria, 2023-2030
9.3.7.3. Market Estimates & Forecast, by Distribution Channel, 2023-2030
9.3.8. Spain
9.3.8.1. Market Estimates & Forecast, by Type, 2023-2030
9.3.8.2. Market Estimates & Forecast, by Bacteria, 2023-2030
9.3.8.3. Market Estimates & Forecast, by Distribution Channel, 2023-2030
9.3.9. Italy
9.3.9.1. Market Estimates & Forecast, by Type, 2023-2030
9.3.9.2. Market Estimates & Forecast, by Bacteria, 2023-2030
9.3.9.3. Market Estimates & Forecast, by Distribution Channel, 2023-2030
9.3.10. Rest of Europe
9.3.10.1. Market Estimates & Forecast, by Type, 2023-2030
9.3.10.2. Market Estimates & Forecast, by Bacteria, 2023-2030
9.3.10.3. Market Estimates & Forecast, by Distribution Channel, 2023-2030
9.4. Asia-Pacific
9.4.1. Market Estimates & Forecast, by Type, 2023-2030
9.4.2. Market Estimates & Forecast, by Bacteria, 2023-2030
9.4.3. Market Estimates & Forecast, by Distribution Channel, 2023-2030
9.4.4. Market Estimates & Forecast, by Country, 2023-2030
9.4.5. China
9.4.5.1. Market Estimates & Forecast, by Type, 2023-2030
9.4.5.2. Market Estimates & Forecast, by Bacteria, 2023-2030
9.4.5.3. Market Estimates & Forecast, by Distribution Channel, 2023-2030
9.4.6. Japan
9.4.6.1. Market Estimates & Forecast, by Type, 2023-2030
9.4.6.2. Market Estimates & Forecast, by Bacteria, 2023-2030
9.4.6.3. Market Estimates & Forecast, by Distribution Channel, 2023-2030
9.4.7. India
9.4.7.1. Market Estimates & Forecast, by Type, 2023-2030
9.4.7.2. Market Estimates & Forecast, by Bacteria, 2023-2030
9.4.7.3. Market Estimates & Forecast, by Distribution Channel, 2023-2030
9.4.8. Australia & New Zealand
9.4.8.1. Market Estimates & Forecast, by Type, 2023-2030
9.4.8.2. Market Estimates & Forecast, by Bacteria, 2023-2030
9.4.8.3. Market Estimates & Forecast, by Distribution Channel, 2023-2030
9.4.9. Rest of Asia-Pacific
9.4.9.1. Market Estimates & Forecast, by Type, 2023-2030
9.4.9.2. Market Estimates & Forecast, by Bacteria, 2023-2030
9.4.9.3. Market Estimates & Forecast, by Distribution Channel, 2023-2030
9.5. Rest of the World
9.5.1. Market Estimates & Forecast, by Type, 2023-2030
9.5.2. Market Estimates & Forecast, by Bacteria, 2023-2030
9.5.3. Market Estimates & Forecast, by Distribution Channel, 2023-2030
9.5.4. Market Estimates & Forecast, by Region, 2023-2030
9.5.5. South America
9.5.5.1. Market Estimates & Forecast, by Type, 2023-2030
9.5.5.2. Market Estimates & Forecast, by Bacteria, 2023-2030
9.5.5.3. Market Estimates & Forecast, by Distribution Channel, 2023-2030
9.5.6. Middle East
9.5.6.1. Market Estimates & Forecast, by Type, 2023-2030
9.5.6.2. Market Estimates & Forecast, by Bacteria, 2023-2030
9.5.6.3. Market Estimates & Forecast, by Distribution Channel, 2023-2030
9.5.7. Africa
9.5.7.1. Market Estimates & Forecast, by Type, 2023-2030
9.5.7.2. Market Estimates & Forecast, by Bacteria, 2023-2030
9.5.7.3. Market Estimates & Forecast, by Distribution Channel, 2023-2030
10. COMPETITIVE LANDSCAPE
10.1. Introduction
10.2. Competitive Benchmarking
10.3. Development Share Analysis
10.4. Key Developments & Growth Strategies
11. COMPANY PROFILES
11.1. Nestle S.A.
11.1.1. Company Overview
11.1.2. Financial Overview
11.1.3. Products Offered
11.1.4. Key Developments
11.1.5. SWOT Analysis
11.1.6. Key Strategies
11.2. Danone S.A.
11.2.1. Company Overview
11.2.2. Financial Overview
11.2.3. Products Offered
11.2.4. Key Developments
11.2.5. SWOT Analysis
11.2.6. Key Strategies
11.3. Amul Industries Pvt Ltd
11.3.1. Company Overview
11.3.2. Financial Overview
11.3.3. Products Offered
11.3.4. Key Developments
11.3.5. SWOT Analysis
11.3.6. Key Strategies
11.4. Bright Dairy & Food Co., Ltd
11.4.1. Company Overview
11.4.2. Financial Overview
11.4.3. Products Offered
11.4.4. Key Developments
11.4.5. SWOT Analysis
11.4.6. Key Strategies
11.5. Bio-K Plus International Inc.
11.5.1. Company Overview
11.5.2. Financial Overview
11.5.3. Products Offered
11.5.4. Key Developments
11.5.5. SWOT Analysis
11.5.6. Key Strategies
11.6. Fonterra Co-op Group Ltd
11.6.1. Company Overview
11.6.2. Financial Overview
11.6.3. Products Offered
11.6.4. Key Developments
11.6.5. SWOT Analysis
11.6.6. Key Strategies
11.7. Cargill Inc.
11.7.1. Company Overview
11.7.2. Financial Overview
11.7.3. Products Offered
11.7.4. Key Developments
11.7.5. SWOT Analysis
11.7.6. Key Strategies
11.8. Koninklijke DSM N.V.
11.8.1. Company Overview
11.8.2. Financial Overview
11.8.3. Products Offered
11.8.4. Key Developments
11.8.5. SWOT Analysis
11.8.6. Key Strategies
11.9. PepsiCo, Inc.
11.9.1. Company Overview
11.9.2. Financial Overview
11.9.3. Products Offered
11.9.4. Key Developments
11.9.5. SWOT Analysis
11.9.6. Key Strategies
11.10. GoodBelly Probiotics
11.10.1. Company Overview
11.10.2. Financial Overview
11.10.3. Products Offered
11.10.4. Key Developments
11.10.5. SWOT Analysis
11.10.6. Key Strategies
12. APPENDIX
12.1. General Types & References
12.2. List of Abbreviation
LIST OF TABLES
Table 1 Global Probiotic Drinks, by Region, 2023โ2030 (USD Million)
Table 2 Global Probiotic Drinks, by Type, 2023โ2030 (USD Million)
Table 3 Global Probiotic Drinks, by Bacteria, 2023โ2030 (USD Million)
Table 4 Global Probiotic Drinks, by Distribution Channel, 2023โ2030 (USD Million)
Table 5 North America: Probiotic Drinks, by Country, 2023โ2030 (USD Million)
Table 6 North America: Probiotic Drinks, by Type, 2023โ2030 (USD Million)
Table 7 North America: Probiotic Drinks, by Bacteria, 2023โ2030 (USD Million)
Table 8 North America: Probiotic Drinks, by Distribution Channel, 2023โ2030 (USD Million)
Table 9 US: Probiotic Drinks, by Type, 2023โ2030 (USD Million)
Table 10 US: Probiotic Drinks, by Bacteria, 2023โ2030 (USD Million)
Table 11 US: Probiotic Drinks, by Distribution Channel, 2023โ2030 (USD Million)
Table 12 Canada: Probiotic Drinks, by Type, 2023โ2030 (USD Million)
Table 13 Canada: Probiotic Drinks, by Bacteria, 2023โ2030 (USD Million)
Table 14 Canada: Probiotic Drinks, by Distribution Channel, 2023โ2030 (USD Million)
Table 15 Mexico: Probiotic Drinks, by Type, 2023โ2030 (USD Million)
Table 16 Mexico: Probiotic Drinks, by Bacteria, 2023โ2030 (USD Million)
Table 17 Mexico: Probiotic Drinks, by Distribution Channel, 2023โ2030 (USD Million)
Table 18 Europe: Probiotic Drinks, by Country, 2023โ2030 (USD Million)
Table 19 Europe: Probiotic Drinks, by Type, 2023โ2030 (USD Million)
Table 20 Europe: Probiotic Drinks, by Bacteria, 2023โ2030 (USD Million)
Table 21 Europe: Probiotic Drinks, by Distribution Channel, 2023โ2030 (USD Million)
Table 22 Germany: Probiotic Drinks, by Type, 2023โ2030 (USD Million)
Table 23 Germany: Probiotic Drinks, by Bacteria, 2023โ2030 (USD Million)
Table 24 Germany: Probiotic Drinks, by Distribution Channel, 2023โ2030 (USD Million)
Table 22 France: Probiotic Drinks, by Type, 2023โ2030 (USD Million)
Table 23 France: Probiotic Drinks, by Bacteria, 2023โ2030 (USD Million)
Table 24 France: Probiotic Drinks, by Distribution Channel, 2023โ2030 (USD Million)
Table 25 Italy: Probiotic Drinks, by Type, 2023โ2030 (USD Million)
Table 26 Italy: Probiotic Drinks, by Bacteria, 2023โ2030 (USD Million)
Table 27 Italy: Probiotic Drinks, by Distribution Channel, 2023โ2030 (USD Million)
Table 28 Spain: Probiotic Drinks, by Type, 2023โ2030 (USD Million)
Table 29 Spain: Probiotic Drinks, by Bacteria, 2023โ2030 (USD Million)
Table 30 Spain: Probiotic Drinks, by Distribution Channel, 2023โ2030 (USD Million)
Table 31 UK: Probiotic Drinks, by Type, 2023โ2030 (USD Million)
Table 32 UK: Probiotic Drinks, by Bacteria, 2023โ2030 (USD Million)
Table 33 UK: Probiotic Drinks, by Distribution Channel, 2023โ2030 (USD Million)
Table 34 Rest of Europe: Probiotic Drinks, by Type, 2023โ2030 (USD Million)
Table 35 Rest of Europe: Probiotic Drinks, by Bacteria, 2023โ2030 (USD Million)
Table 36 Rest of Europe: Probiotic Drinks, by Distribution Channel, 2023โ2030 (USD Million)
Table 37 Asia-Pacific: Probiotic Drinks, by Country, 2023โ2030 (USD Million)
Table 38 Asia-Pacific: Probiotic Drinks, by Type, 2023โ2030 (USD Million)
Table 39 Asia-Pacific: Probiotic Drinks, by Bacteria, 2023โ2030 (USD Million)
Table 40 Asia-Pacific: Probiotic Drinks, by Distribution Channel, 2023โ2030 (USD Million)
Table 41 China: Probiotic Drinks, by Type, 2023โ2030 (USD Million)
Table 42 China: Probiotic Drinks, by Bacteria, 2023โ2030 (USD Million)
Table 43 China: Probiotic Drinks, by Distribution Channel, 2023โ2030 (USD Million)
Table 44 India: Probiotic Drinks, by Type, 2023โ2030 (USD Million)
Table 45 India: Probiotic Drinks, by Bacteria, 2023โ2030 (USD Million)
Table 46 India: Probiotic Drinks, by Distribution Channel, 2023โ2030 (USD Million)
Table 47 Japan: Probiotic Drinks, by Type, 2023โ2030 (USD Million)
Table 48 Japan: Probiotic Drinks, by Bacteria, 2023โ2030 (USD Million)
Table 49 Japan: Probiotic Drinks, by Distribution Channel, 2023โ2030 (USD Million)
Table 50 Australia & New Zealand: Probiotic Drinks, by Type, 2023โ2030 (USD Million)
Table 51 Australia & New Zealand: Probiotic Drinks, by Bacteria, 2023โ2030 (USD Million)
Table 52 Australia & New Zealand: Probiotic Drinks, by Distribution Channel, 2023โ2030 (USD Million)
Table 53 Rest of Asia-Pacific: Probiotic Drinks, by Type, 2023โ2030 (USD Million)
Table 54 Rest of Asia-Pacific: Probiotic Drinks, by Bacteria, 2023โ2030 (USD Million)
Table 55 Rest of Asia-Pacific: Probiotic Drinks, by Distribution Channel, 2023โ2030 (USD Million)
Table 56 Rest of the World (RoW): Probiotic Drinks, by Country, 2023โ2030 (USD Million)
Table 57 Rest of the World (RoW): Probiotic Drinks, by Type, 2023โ2030 (USD Million)
Table 58 Rest of the World (RoW): Probiotic Drinks, by Bacteria, 2023โ2030 (USD Million)
Table 59 Rest of the World (RoW): Probiotic Drinks, by Distribution Channel, 2023โ2030 (USD Million)
Table 60 South America: Probiotic Drinks, by Type, 2023โ2030 (USD Million)
Table 61 South America: Probiotic Drinks, by Bacteria, 2023โ2030 (USD Million)
Table 62 South America: Probiotic Drinks, by Distribution Channel, 2023โ2030 (USD Million)
Table 63 Middle East: Probiotic Drinks, by Type, 2023โ2030 (USD Million)
Table 64 Middle East: Probiotic Drinks, by Bacteria, 2023โ2030 (USD Million)
Table 65 Middle East: Probiotic Drinks, by Distribution Channel, 2023โ2030 (USD Million)
Table 66 Africa: Probiotic Drinks, by Type, 2023โ2030 (USD Million)
Table 67 Africa: Probiotic Drinks, by Bacteria, 2023โ2030 (USD Million)
Table 68 Africa: Probiotic Drinks, by Distribution Channel, 2023โ2030 (USD Million)
LIST OF FIGURES
FIGURE 1 Global Probiotic Drinks Market Segmentation
FIGURE 2 Forecast Research Methodology
FIGURE 3 Five Forces Analysis of the Global Probiotic Drinks Market
FIGURE 4 Value Chain of the Global Probiotic Drinks Market
FIGURE 5 Share of the Global Probiotic Drinks Market in 2023, by Country (%)
FIGURE 6 Global Probiotic Drinks Market, by Region, 2023โ2030,
FIGURE 7 Global Probiotic Drinks Market Size, by Type, 2023
FIGURE 8 Share of the Global Probiotic Drinks Market, by Type, 2023โ2030 (%)
FIGURE 9 Global Probiotic Drinks Market Size, by Bacteria, 2023
FIGURE 10 Share of the Global Probiotic Drinks Market, by Bacteria, 2023โ2030 (%)
FIGURE 11 Global Probiotic Drinks Market Size, by Distribution Channel, 2023
FIGURE 12 Share of the Global Probiotic Drinks Market, by Distribution Channel, 2023โ2030 (%)
Probiotic Drinks Type Outlook (USD Billion, 2019-2030)
Fruit-Based
Dairy-Based
Probiotic Drinks Bacteria Outlook (USD Billion, 2019-2030)
Lactobacillus
Streptococcus
Bifidobacterium
Probiotic Drinks Distribution Channel Outlook (USD Billion, 2019-2030)
Store-Based
Non-Store-Based
Probiotic Drinks Regional Outlook (USD Billion, 2019-2030)
North America Outlook (USD Billion, 2019-2030)
North America Probiotic Drinks by Type
Fruit-Based
Dairy-Based
North America Probiotic Drinks by Bacteria
Lactobacillus
Streptococcus
Bifidobacterium
North America Probiotic Drinks by Distribution Channel
Store-Based
Non-Store-Based
US Outlook (USD Billion, 2019-2030)
US Probiotic Drinks by Type
Fruit-Based
Dairy-Based
US Probiotic Drinks by Bacteria
Lactobacillus
Streptococcus
Bifidobacterium
US Probiotic Drinks by Distribution Channel
Store-Based
Non-Store-Based
CANADA Outlook (USD Billion, 2019-2030)
CANADA Probiotic Drinks by Type
Fruit-Based
Dairy-Based
CANADA Probiotic Drinks by Bacteria
Lactobacillus
Streptococcus
Bifidobacterium
CANADA Probiotic Drinks by Distribution Channel
Store-Based
Non-Store-Based
Europe Outlook (USD Billion, 2019-2030)
Europe Probiotic Drinks by Type
Fruit-Based
Dairy-Based
Europe Probiotic Drinks by Bacteria
Lactobacillus
Streptococcus
Bifidobacterium
Europe Probiotic Drinks by Distribution Channel
Store-Based
Non-Store-Based
Germany Outlook (USD Billion, 2019-2030)
Germany Probiotic Drinks by Type
Fruit-Based
Dairy-Based
Germany Probiotic Drinks by Bacteria
Lactobacillus
Streptococcus
Bifidobacterium
Germany Probiotic Drinks by Distribution Channel
Store-Based
Non-Store-Based
France Outlook (USD Billion, 2019-2030)
France Probiotic Drinks by Type
Fruit-Based
Dairy-Based
France Probiotic Drinks by Bacteria
Lactobacillus
Streptococcus
Bifidobacterium
France Probiotic Drinks by Distribution Channel
Store-Based
Non-Store-Based
9UK Outlook (USD Billion, 2019-2030)
UK Probiotic Drinks by Type
Fruit-Based
Dairy-Based
UK Probiotic Drinks by Bacteria
Lactobacillus
Streptococcus
Bifidobacterium
UK Probiotic Drinks by Distribution Channel
Store-Based
Non-Store-Based
ITALY Outlook (USD Billion, 2019-2030)
ITALY Probiotic Drinks by Type
Fruit-Based
Dairy-Based
ITALY Probiotic Drinks by Bacteria
Lactobacillus
Streptococcus
Bifidobacterium
ITALY Probiotic Drinks by Distribution Channel
Store-Based
Non-Store-Based
SPAIN Outlook (USD Billion, 2019-2030)
Spain Probiotic Drinks by Type
Fruit-Based
Dairy-Based
Spain Probiotic Drinks by Bacteria
Lactobacillus
Streptococcus
Bifidobacterium
Spain Probiotic Drinks by Distribution Channel
Store-Based
Non-Store-Based
Rest Of Europe Outlook (USD Billion, 2019-2030)
Rest Of Europe Probiotic Drinks by Type
Fruit-Based
Dairy-Based
REST OF EUROPE Probiotic Drinks by Bacteria
Lactobacillus
Streptococcus
Bifidobacterium
REST OF EUROPE Probiotic Drinks by Distribution Channel
Store-Based
Non-Store-Based
Asia-Pacific Outlook (USD Billion, 2019-2030)
Asia-Pacific Probiotic Drinks by Type
Fruit-Based
Dairy-Based
Asia-Pacific Probiotic Drinks by Bacteria
Lactobacillus
Streptococcus
Bifidobacterium
Asia-Pacific Probiotic Drinks by Distribution Channel
Store-Based
Non-Store-Based
China Outlook (USD Billion, 2019-2030)
China Probiotic Drinks by Type
Fruit-Based
Dairy-Based
China Probiotic Drinks by Bacteria
Lactobacillus
Streptococcus
Bifidobacterium
China Probiotic Drinks by Distribution Channel
Store-Based
Non-Store-Based
Japan Outlook (USD Billion, 2019-2030)
Japan Probiotic Drinks by Type
Fruit-Based
Dairy-Based
Japan Probiotic Drinks by Bacteria
Lactobacillus
Streptococcus
Bifidobacterium
Japan Probiotic Drinks by Distribution Channel
Store-Based
Non-Store-Based
India Outlook (USD Billion, 2019-2030)
India Probiotic Drinks by Type
Fruit-Based
Dairy-Based
India Probiotic Drinks by Bacteria
Lactobacillus
Streptococcus
Bifidobacterium
India Probiotic Drinks by Distribution Channel
Store-Based
Non-Store-Based
Australia Outlook (USD Billion, 2019-2030)
Australia Probiotic Drinks by Type
Fruit-Based
Dairy-Based
Australia Probiotic Drinks by Bacteria
Lactobacillus
Streptococcus
Bifidobacterium
Australia Probiotic Drinks by Distribution Channel
Store-Based
Non-Store-Based
Rest of Asia-Pacific Outlook (USD Billion, 2019-2030)
Rest of Asia-Pacific Probiotic Drinks by Type
Fruit-Based
Dairy-Based
Rest of Asia-Pacific Probiotic Drinks by Bacteria
Lactobacillus
Streptococcus
Bifidobacterium
Rest of Asia-Pacific Probiotic Drinks by Distribution Channel
Store-Based
Non-Store-Based
Rest of the World Outlook (USD Billion, 2019-2030)
Rest of the World Probiotic Drinks by Type
Fruit-Based
Dairy-Based
Rest of the World Probiotic Drinks by Bacteria
Lactobacillus
Streptococcus
Bifidobacterium
Rest of the World Probiotic Drinks by Distribution Channel
Store-Based
Non-Store-Based
Middle East Outlook (USD Billion, 2019-2030)
Middle East Probiotic Drinks by Type
Fruit-Based
Dairy-Based
Middle East Probiotic Drinks by Bacteria
Lactobacillus
Streptococcus
Bifidobacterium
Middle East Probiotic Drinks by Distribution Channel
Store-Based
Non-Store-Based
Africa Outlook (USD Billion, 2019-2030)
Africa Probiotic Drinks by Type
Fruit-Based
Dairy-Based
Africa Probiotic Drinks by Bacteria
Lactobacillus
Streptococcus
Bifidobacterium
Africa Probiotic Drinks by Distribution Channel
Store-Based
Non-Store-Based
Latin America Outlook (USD Billion, 2019-2030)
Latin America Probiotic Drinks by Type
Fruit-Based
Dairy-Based
Latin America Probiotic Drinks by Bacteria
Lactobacillus
Streptococcus
Bifidobacterium
Latin America Probiotic Drinks by Distribution Channel
Store-Based
Non-Store-Based
Research Methodology on Probiotics Drinks Market
Objective:
The purpose of this methodology is to provide an overview of the research process and research methodology adopted to conduct a study on the โProbiotic Drinks Marketโ. The objectives of this research include the gathering of data and information on various segments of the probiotic drinks market, gathering insights on consumer views & preferences, analyzing the industryโs competitive environment, providing an external market threat and opportunity assessment, and making recommendations for improvement.
Scope of Study:
The scope of this research is to assess the current state of the probiotic drinks market, analyze consumer demand and preferences, understand the competitive landscape of the industry, and provide an external market threat & opportunity assessment. The research is conducted comprehensively and includes both primary and secondary research.
Research Design:
The research design adopted for this study is a combination of qualitative and quantitative methods. Qualitative research methods such as interviews and surveys were used to gain insights into consumer views and preferences. Quantitative methods such as statistical analysis and data analysis are used to gather data and information on the market size, segmentation, and other variables.
Secondary Data Collection:
Secondary data is collected from public sources such as market research reports, industry reports, and related articles. Data was also gathered from government databases and various market intelligence tools such as Bloomberg, Statista, and Factiva.
Primary Data Collection:
Primary data is collected through interviews and surveys. Interviews were conducted with key personnel in the probiotic drinks industry such as leading manufacturers, distributors, and suppliers. These interviews were structured in nature and were meant to gain an understanding of the industry, and consumer trends, and gain insights into the internal market environment and competition. Surveys were also conducted with consumers and other market players to gain further insights into consumer preferences and the external market environment.
Data Analysis:
Data analysis is conducted through statistical and data analysis. Statistical analysis is conducted to evaluate the data and information collected from both primary and secondary sources. This analysis is used to understand the market size and segmentation, consumer preferences, and the external market environment. This analysis was supplemented by data analysis and exploration to identify key trends and insights from the collected data and to make appropriate recommendations for improvement.