ID: MRFR/CR/8883-CR | February 2021 | Region: Global | 100 Pages
1 EXECUTIVE SUMMARY
1.1 MARKET ATTRACTIVENESS ANALYSIS 14
1.1.1 GLOBAL PLASTIC TABLEWARE MARKET, BY PRODUCT TYPE 15
1.1.2 GLOBAL PLASTIC TABLEWARE MARKET, BY DISTRIBUTION CHANNEL 16
1.1.3 GLOBAL PLASTIC TABLEWARE MARKET, BY REGION 17
2 MARKET INTRODUCTION
2.1 DEFINITION 18
2.2 SCOPE OF THE STUDY 18
2.3 RESEARCH OBJECTIVE 18
2.4 MARKET STRUCTURE 19
2.5 KEY BUYING CRITERIA 19
3 RESEARCH METHODOLOGY
3.1 RESEARCH PROCESS 20
3.2 PRIMARY RESEARCH 21
3.3 SECONDARY RESEARCH 22
3.4 MARKET SIZE ESTIMATION 23
3.5 FORECAST MODEL 24
3.6 LIST OF ASSUMPTIONS 25
4 MARKET DYNAMICS
4.1 INTRODUCTION 26
4.2 DRIVERS 27
4.2.1 GROWTH OF THE FOODSERVICE INDUSTRY 27
4.2.2 HIGH CONSUMER PREFERENCE FOR CONVENIENCE PRODUCTS 27
4.2.3 GROWTH OF THE ORGANIZED RETAIL SECTOR IN ASIA-PACIFIC 28
4.2.4 DRIVERS IMPACT ANALYSIS 28
4.3 RESTRAINT 29
4.3.1 BAN ON PLASTIC USE IN VARIOUS COUNTRIES 29
4.3.2 RESTRAINT IMPACT ANALYSIS 30
4.4 OPPORTUNITIES 30
4.4.1 GROWING TREND OF CUSTOMIZED PLASTIC TABLEWARE 30
4.4.2 SHIFTING INCLINATION TOWARDS THE USE OF BIODEGRADABLE PLASTICS 30
4.5 CHALLENGE 31
4.5.1 INCREASING DEMAND FOR ECO-FRIENDLY TABLEWARE PRODUCTS 31
5 MARKET FACTOR ANALYSIS
5.1 VALUE CHAIN ANALYSIS 32
5.1.1 RAW MATERIAL PROCUREMENT 33
5.1.2 PROCESSING 33
5.1.3 PACKAGING 33
5.2 SUPPLY CHAIN ANALYSIS 34
5.3 PORTER’S FIVE FORCES MODEL 35
5.3.1 THREAT OF NEW ENTRANTS 36
5.3.2 BARGAINING POWER OF SUPPLIERS 36
5.3.3 THREAT OF SUBSTITUTES 36
5.3.4 BARGAINING POWER OF BUYERS 36
5.3.5 INTENSITY OF RIVALRY 36
6 IMPACT OF THE COVID-19 OUTBREAK ON THE GLOBAL PLASTIC TABLEWARE MARKET
7 GLOBAL PLASTIC TABLEWARE MARKET, BY PRODUCT TYPE
7.1 OVERVIEW 38
7.1.1 GLOBAL PLASTIC TABLEWARE MARKET ESTIMATES & FORECAST, BY PRODUCT TYPE, 2020-2027 39
7.2 PLATES 39
7.2.1 PLATES: MARKET ESTIMATES & FORECAST, BY REGION, 2020-2027 39
7.3 BOWLS 40
7.3.1 BOWLS: MARKET ESTIMATES & FORECAST, BY REGION, 2020-2027 40
7.4 CUTLERY 40
7.4.1 CUTLERY: MARKET ESTIMATES & FORECAST, BY REGION, 2020-2027 41
7.5 CUPS & GLASSES 41
7.5.1 CUPS & GLASSES: MARKET ESTIMATES & FORECAST, BY REGION, 2020-2027 41
7.6 OTHERS 42
7.6.1 OTHERS: MARKET ESTIMATES & FORECAST, BY REGION, 2020-2027 42
8 GLOBAL PLASTIC TABLEWARE MARKET, BY DISTRIBUTION CHANNEL
8.1 OVERVIEW 43
8.1.1 GLOBAL PLASTIC TABLEWARE MARKET ESTIMATES & FORECAST, BY DISTRIBUTION CHANNEL, 2020-2027 44
8.2 STORE-BASED 44
8.2.1 STORE-BASED: MARKET ESTIMATES & FORECAST, BY REGION, 2020-2027 44
8.3 NON-STORE-BASED 45
8.3.1 NON-STORE-BASED: MARKET ESTIMATES & FORECAST, BY REGION, 2020-2027 45
9 GLOBAL PLASTIC TABLEWARE MARKET, BY REGION
9.1 OVERVIEW 46
9.2 NORTH AMERICA 48
9.2.1 US 50
9.2.2 CANADA 51
9.2.3 MEXICO 52
9.3 EUROPE 53
9.3.1 UK 55
9.3.2 GERMANY 56
9.3.3 FRANCE 57
9.3.4 ITALY 58
9.3.5 SPAIN 59
9.3.6 REST OF EUROPE 60
9.4 ASIA-PACIFIC 61
9.4.1 CHINA 63
9.4.2 INDIA 64
9.4.3 JAPAN 65
9.4.4 AUSTRALIA & NEW ZEALAND 66
9.4.5 REST OF ASIA-PACIFIC 67
9.5 REST OF THE WORLD 68
9.5.1 SOUTH AMERICA 70
9.5.2 MIDDLE EAST 71
9.5.3 AFRICA 72
10 COMPETITIVE LANDSCAPE
10.1 INTRODUCTION 73
10.2 COMPETITIVE BENCHMARKING 74
10.3 KEY DEVELOPMENTS & GROWTH STRATEGIES 74
10.3.1 AGREEMENTS 74
11 COMPANY PROFILES
11.1 LIBBEY, INC. 75
11.1.1 COMPANY OVERVIEW 75
11.1.2 FINANCIAL OVERVIEW 76
11.1.3 PRODUCTS OFFERED 77
11.1.4 KEY DEVELOPMENTS 77
11.1.5 SWOT ANALYSIS 77
11.1.6 KEY STRATEGIES 77
11.2 LOLLICUP USA 78
11.2.1 COMPANY OVERVIEW 78
11.2.2 FINANCIAL OVERVIEW 78
11.2.3 PRODUCTS OFFERED 78
11.2.4 KEY DEVELOPMENTS 78
11.2.5 KEY STRATEGIES 78
11.3 AMERICAN GREETINGS CORPORATION 79
11.3.1 COMPANY OVERVIEW 79
11.3.2 FINANCIAL OVERVIEW 79
11.3.3 PRODUCTS OFFERED 79
11.3.4 KEY DEVELOPMENTS 79
11.3.5 KEY STRATEGIES 79
11.4 AMERCARE 80
11.4.1 COMPANY OVERVIEW 80
11.4.2 FINANCIAL OVERVIEW 80
11.4.3 PRODUCTS OFFERED 80
11.4.4 KEY DEVELOPMENTS 80
11.4.5 SWOT ANALYSIS 81
11.4.6 KEY STRATEGIES 81
11.5 DOPLA SPA 82
11.5.1 COMPANY OVERVIEW 82
11.5.2 FINANCIAL OVERVIEW 82
11.5.3 PRODUCTS OFFERED 82
11.5.4 KEY DEVELOPMENTS 82
11.5.5 KEY STRATEGIES 82
11.6 HUHTAMAKI GROUP 83
11.6.1 COMPANY OVERVIEW 83
11.6.2 FINANCIAL OVERVIEW 83
11.6.3 PRODUCTS OFFERED 84
11.6.4 KEY DEVELOPMENTS 84
11.6.5 SWOT ANALYSIS 84
11.6.6 KEY STRATEGIES 85
11.7 SOLIA USA 86
11.7.1 COMPANY OVERVIEW 86
11.7.2 FINANCIAL OVERVIEW 86
11.7.3 PRODUCTS OFFERED 86
11.7.4 KEY DEVELOPMENTS 87
11.7.5 KEY STRATEGIES 87
11.8 DART CONTAINER CORPORATION 88
11.8.1 COMPANY OVERVIEW 88
11.8.2 FINANCIAL OVERVIEW 88
11.8.3 PRODUCTS OFFERED 89
11.8.4 KEY DEVELOPMENTS 89
11.8.5 KEY STRATEGIES 89
11.9 GEORGIA-PACIFIC LLC 90
11.9.1 COMPANY OVERVIEW 90
11.9.2 FINANCIAL OVERVIEW 90
11.9.3 PRODUCTS OFFERED 90
11.9.4 KEY DEVELOPMENTS 90
11.9.5 SWOT ANALYSIS 91
11.9.6 KEY STRATEGIES 91
11.10 GENPAK LLC 92
11.10.1 COMPANY OVERVIEW 92
11.10.2 FINANCIAL OVERVIEW 92
11.10.3 PRODUCTS OFFERED 92
11.10.4 KEY DEVELOPMENTS 92
11.10.5 SWOT ANALYSIS 93
11.10.6 KEY STRATEGIES 93
12 REFERENCES
13 LIST OF TABLES
TABLE 1 PRIMARY INTERVIEWS 21
TABLE 2 LIST OF ASSUMPTIONS 25
TABLE 3 GLOBAL PLASTIC TABLEWARE MARKET ESTIMATES & FORECAST, BY PRODUCT TYPE, 2020-2027 (USD MILLION) 39
TABLE 4 PLATES: MARKET ESTIMATES & FORECAST, BY REGION, 2020-2027 (USD MILLION) 39
TABLE 5 BOWLS: MARKET ESTIMATES & FORECAST, BY REGION, 2020-2027 (USD MILLION) 40
TABLE 6 CUTLERY: MARKET ESTIMATES & FORECAST, BY REGION, 2020-2027 (USD MILLION) 41
TABLE 7 CUPS & GLASSES: MARKET ESTIMATES & FORECAST, BY REGION, 2020-2027 (USD MILLION) 41
TABLE 8 OTHERS: MARKET ESTIMATES & FORECAST, BY REGION, 2020-2027 (USD MILLION) 42
TABLE 9 GLOBAL PLASTIC TABLEWARE MARKET ESTIMATES & FORECAST, BY DISTRIBUTION CHANNEL, 2020-2027 (USD MILLION) 44
TABLE 10 STORE-BASED: MARKET ESTIMATES & FORECAST, BY REGION, 2020-2027 (USD MILLION) 44
TABLE 11 NON-STORE-BASED: MARKET ESTIMATES & FORECAST, BY REGION, 2020-2027 (USD MILLION) 45
TABLE 12 GLOBAL PLASTIC TABLEWARE MARKET ESTIMATES & FORECAST, BY REGION, 2020-2027 (USD MILLION) 47
TABLE 13 NORTH AMERICA: PLASTIC TABLEWARE MARKET ESTIMATES & FORECAST, BY COUNTRY, 2020-2027 (USD MILLION) 48
TABLE 14 NORTH AMERICA: PLASTIC TABLEWARE MARKET, BY PRODUCT TYPE, 2020-2027 (USD MILLION) 49
TABLE 15 NORTH AMERICA: PLASTIC TABLEWARE MARKET, BY DISTRIBUTION CHANNEL, 2020-2027 (USD MILLION) 49
TABLE 16 US: PLASTIC TABLEWARE MARKET, BY PRODUCT TYPE, 2020-2027 (USD MILLION) 50
TABLE 17 US: PLASTIC TABLEWARE MARKET, BY DISTRIBUTION CHANNEL, 2020-2027 (USD MILLION) 50
TABLE 18 CANADA: PLASTIC TABLEWARE MARKET, BY PRODUCT TYPE, 2020-2027 (USD MILLION) 51
TABLE 19 CANADA: PLASTIC TABLEWARE MARKET, BY DISTRIBUTION CHANNEL, 2020-2027 (USD MILLION) 51
TABLE 20 MEXICO: PLASTIC TABLEWARE MARKET, BY PRODUCT TYPE, 2020-2027 (USD MILLION) 52
TABLE 21 MEXICO: PLASTIC TABLEWARE MARKET, BY DISTRIBUTION CHANNEL, 2020-2027 (USD MILLION) 52
TABLE 22 EUROPE: MARKET ESTIMATES & FORECAST, BY COUNTRY, 2020-2027 (USD MILLION) 53
TABLE 23 EUROPE: PLASTIC TABLEWARE MARKET, BY PRODUCT TYPE, 2020-2027 (USD MILLION) 54
TABLE 24 EUROPE: PLASTIC TABLEWARE MARKET, BY DISTRIBUTION CHANNEL, 2020-2027 (USD MILLION) 54
TABLE 25 UK: PLASTIC TABLEWARE MARKET, BY PRODUCT TYPE, 2020-2027 (USD MILLION) 55
TABLE 26 UK: PLASTIC TABLEWARE MARKET, BY DISTRIBUTION CHANNEL, 2020-2027 (USD MILLION) 55
TABLE 27 GERMANY: PLASTIC TABLEWARE MARKET, BY PRODUCT TYPE, 2020-2027 (USD MILLION) 56
TABLE 28 GERMANY: PLASTIC TABLEWARE MARKET, BY DISTRIBUTION CHANNEL, 2020-2027 (USD MILLION) 56
TABLE 29 FRANCE: PLASTIC TABLEWARE MARKET, BY PRODUCT TYPE, 2020-2027 (USD MILLION) 57
TABLE 30 FRANCE: PLASTIC TABLEWARE MARKET, BY DISTRIBUTION CHANNEL, 2020-2027 (USD MILLION) 57
TABLE 31 ITALY: PLASTIC TABLEWARE MARKET, BY PRODUCT TYPE, 2020-2027 (USD MILLION) 58
TABLE 32 ITALY: PLASTIC TABLEWARE MARKET, BY DISTRIBUTION CHANNEL, 2020-2027 (USD MILLION) 58
TABLE 33 SPAIN: PLASTIC TABLEWARE MARKET, BY PRODUCT TYPE, 2020-2027 (USD MILLION) 59
TABLE 34 SPAIN: PLASTIC TABLEWARE MARKET, BY DISTRIBUTION CHANNEL, 2020-2027 (USD MILLION) 59
TABLE 35 REST OF EUROPE: PLASTIC TABLEWARE MARKET, BY PRODUCT TYPE, 2020-2027 (USD MILLION) 60
TABLE 36 REST OF EUROPE: PLASTIC TABLEWARE MARKET, BY DISTRIBUTION CHANNEL, 2020-2027 (USD MILLION) 60
TABLE 37 ASIA-PACIFIC: MARKET ESTIMATES & FORECAST, BY COUNTRY, 2020-2027 (USD MILLION) 61
TABLE 38 ASIA-PACIFIC: PLASTIC TABLEWARE MARKET, BY PRODUCT TYPE, 2020-2027 (USD MILLION) 62
TABLE 39 ASIA-PACIFIC: PLASTIC TABLEWARE MARKET, BY DISTRIBUTION CHANNEL, 2020-2027 (USD MILLION) 62
TABLE 40 CHINA: PLASTIC TABLEWARE MARKET, BY PRODUCT TYPE, 2020-2027 (USD MILLION) 63
TABLE 41 CHINA: PLASTIC TABLEWARE MARKET, BY DISTRIBUTION CHANNEL, 2020-2027 (USD MILLION) 63
TABLE 42 INDIA: PLASTIC TABLEWARE MARKET, BY PRODUCT TYPE, 2020-2027 (USD MILLION) 64
TABLE 43 INDIA: PLASTIC TABLEWARE MARKET, BY DISTRIBUTION CHANNEL, 2020-2027 (USD MILLION) 64
TABLE 44 JAPAN: PLASTIC TABLEWARE MARKET, BY PRODUCT TYPE, 2020-2027 (USD MILLION) 65
TABLE 45 JAPAN: PLASTIC TABLEWARE MARKET, BY DISTRIBUTION CHANNEL, 2020-2027 (USD MILLION) 65
TABLE 46 AUSTRALIA & NEW ZEALAND: PLASTIC TABLEWARE MARKET, BY PRODUCT TYPE, 2020-2027 (USD MILLION) 66
TABLE 47 AUSTRALIA & NEW ZEALAND: PLASTIC TABLEWARE MARKET, BY DISTRIBUTION CHANNEL, 2020-2027 (USD MILLION) 66
TABLE 48 REST OF ASIA-PACIFIC: PLASTIC TABLEWARE MARKET, BY PRODUCT TYPE, 2020-2027 (USD MILLION) 67
TABLE 49 REST OF ASIA-PACIFIC: PLASTIC TABLEWARE MARKET, BY DISTRIBUTION CHANNEL, 2020-2027 (USD MILLION) 67
TABLE 50 REST OF THE WORLD: MARKET ESTIMATES & FORECAST, BY REGION, 2020-2027 (USD MILLION) 68
TABLE 51 REST OF THE WORLD: PLASTIC TABLEWARE MARKET, BY PRODUCT TYPE, 2020-2027 (USD MILLION) 69
TABLE 52 REST OF THE WORLD: PLASTIC TABLEWARE MARKET, BY DISTRIBUTION CHANNEL, 2020-2027 (USD MILLION) 69
TABLE 53 SOUTH AMERICA: PLASTIC TABLEWARE MARKET, BY PRODUCT TYPE, 2020-2027 (USD MILLION) 70
TABLE 54 SOUTH AMERICA: PLASTIC TABLEWARE MARKET, BY DISTRIBUTION CHANNEL, 2020-2027 (USD MILLION) 70
TABLE 55 MIDDLE EAST: PLASTIC TABLEWARE MARKET, BY PRODUCT TYPE, 2020-2027 (USD MILLION) 71
TABLE 56 MIDDLE EAST: PLASTIC TABLEWARE MARKET, BY DISTRIBUTION CHANNEL, 2020-2027 (USD MILLION) 71
TABLE 57 AFRICA: PLASTIC TABLEWARE MARKET, BY PRODUCT TYPE, 2020-2027 (USD MILLION) 72
TABLE 58 AFRICA: PLASTIC TABLEWARE MARKET, BY DISTRIBUTION CHANNEL, 2020-2027 (USD MILLION) 72
TABLE 59 AGREEMENTS 74
TABLE 60 LIBBEY, INC.: PRODUCTS OFFERED 77
TABLE 61 LOLLICUP USA: PRODUCTS OFFERED 78
TABLE 62 AMERICAN GREETINGS CORPORATION: PRODUCTS OFFERED 79
TABLE 63 AMERCARE: PRODUCTS OFFERED 80
TABLE 64 DOPLA SPA: PRODUCTS OFFERED 82
TABLE 65 DOPLA SPA: KEY DEVELOPMENTS 82
TABLE 66 HUHTAMAKI GROUP: PRODUCTS OFFERED 84
TABLE 67 SOLIA USA: PRODUCTS OFFERED 86
TABLE 68 DART CONTAINER CORPORATION: PRODUCTS OFFERED 89
TABLE 69 GEORGIA-PACIFIC LLC: PRODUCTS OFFERED 90
TABLE 70 GENPAK LLC: PRODUCTS OFFERED 92
14 LIST OF FIGURES
FIGURE 1 MARKET SYNOPSIS 13
FIGURE 2 MARKET ATTRACTIVENESS ANALYSIS: GLOBAL PLASTIC TABLEWARE MARKET, 2020 14
FIGURE 3 GLOBAL PLASTIC TABLEWARE MARKET ANALYSIS, BY PRODUCT TYPE 15
FIGURE 4 GLOBAL PLASTIC TABLEWARE MARKET ANALYSIS, BY DISTRIBUTION CHANNEL 16
FIGURE 5 GLOBAL PLASTIC TABLEWARE MARKET ANALYSIS, BY REGION, 2020 17
FIGURE 6 GLOBAL PLASTIC TABLEWARE MARKET: STRUCTURE 19
FIGURE 7 KEY BUYING CRITERIA FOR PLASTIC TABLEWARE 19
FIGURE 8 RESEARCH PROCESS 20
FIGURE 9 TOP-DOWN AND BOTTOM-UP APPROACHES 23
FIGURE 10 MARKET DYNAMICS OVERVIEW 26
FIGURE 11 DRIVERS IMPACT ANALYSIS: GLOBAL PLASTIC TABLEWARE MARKET 28
FIGURE 12 RESTRAINT IMPACT ANALYSIS: GLOBAL PLASTIC TABLEWARE MARKET 30
FIGURE 13 VALUE CHAIN: GLOBAL PLASTIC TABLEWARE MARKET 32
FIGURE 14 GLOBAL PLASTIC TABLEWARE MARKET: SUPPLY CHAIN ANALYSIS 34
FIGURE 15 PORTER'S FIVE FORCES ANALYSIS OF THE GLOBAL PLASTIC TABLEWARE MARKET 35
FIGURE 16 GLOBAL PLASTIC TABLEWARE MARKET, BY PRODUCT TYPE, 2020 (% SHARE) 38
FIGURE 17 GLOBAL PLASTIC TABLEWARE MARKET, BY PRODUCT TYPE, 2020-2027 (USD MILLION) 38
FIGURE 18 GLOBAL PLASTIC TABLEWARE MARKET SHARE, BY DISTRIBUTION CHANNEL, 2020 (% SHARE) 43
FIGURE 19 GLOBAL PLASTIC TABLEWARE MARKET SIZE, BY DISTRIBUTION CHANNEL, 2020-2027 (USD MILLION) 43
FIGURE 20 GLOBAL PLASTIC TABLEWARE MARKET, BY REGION, 2020-2027 (USD MILLION) 46
FIGURE 21 GLOBAL PLASTIC TABLEWARE MARKET, BY REGION, 2020 (% SHARE) 46
FIGURE 22 NORTH AMERICA: PLASTIC TABLEWARE MARKET SHARE, BY COUNTRY, 2020 (% SHARE) 48
FIGURE 23 EUROPE: PLASTIC TABLEWARE MARKET SHARE, BY COUNTRY, 2020 (% SHARE) 53
FIGURE 24 ASIA-PACIFIC: PLASTIC TABLEWARE MARKET SHARE, BY COUNTRY, 2020 (% SHARE) 61
FIGURE 25 REST OF THE WORLD: PLASTIC TABLEWARE MARKET SHARE, BY REGION, 2020 (% SHARE) 68
FIGURE 26 LIBBEY, INC.: FINANCIAL OVERVIEW SNAPSHOT 76
FIGURE 27 LIBBEY, INC.: SWOT ANALYSIS 77
FIGURE 28 AMERCARE: SWOT ANALYSIS 81
FIGURE 29 HUHTAMAKI GROUP: FINANCIAL OVERVIEW SNAPSHOT 83
FIGURE 30 HUHTAMAKI GROUP: SWOT ANALYSIS 84
FIGURE 31 GEORGIA-PACIFIC LLC: SWOT ANALYSIS 91
FIGURE 32 GENPAK LLC: SWOT ANALYSIS 93
$9,323.2 Million
2.98%
Asia Pacific
2020-2027
The demand of the foodservice industry to serve the customer their best services is the major reason which is surging the growth of the Plastic tableware market. The tableware products include dishes that come in several materials such as plastic, ceramic, and other materials, which are used to set the table for dining and serve food. Plastic tableware is widely referred to in the food serving industries because of its several benefits. Therefore, the market notices huge demand due to this factor. The rise in demand for food services with proper dining worldwide is uplifting the market. Everyone wants to get served at a quality dining table to enjoy the food service and ambiance. This factor raises the ultimate need for a market in the food-serving sector. The major star and non-star hotels, restaurants, Café’s and other foodservice centers are driving the Plastic tableware market growth. These food service centers are the major drivers of the market, and the growth of new food service centers throughout the world is setting huge opportunities for the market. The rise of several hotels, resorts, and other food centers is largely driving the Plastic tableware market size. This growth factor will continue in the coming years to let the market flourish globally.
With the rise in concern for sanitary convenience purposes, the foodservice centers prefer plastic tableware dining. The service center always prefers to maintain the hygienic condition while serving food, and the plastic tableware can be the best option because these are easy to wipe and clean. Even the customer’s wide preference for convenience services is propelling the market. This is another major factor that is accelerating the Plastic tableware market outlook.
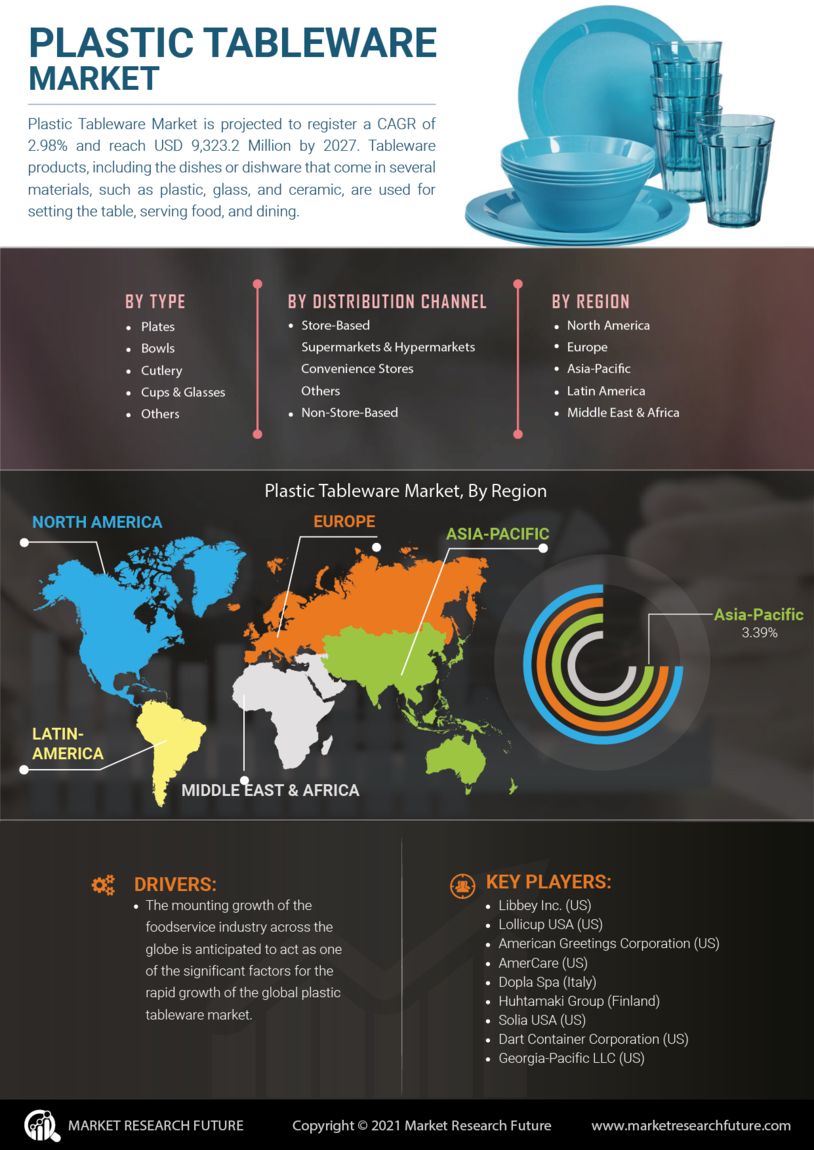
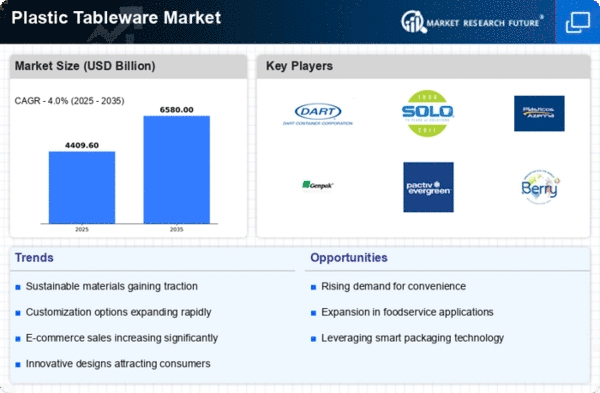
The plastic tableware market is projected to register a CAGR of 2.98% and reach USD 9,323.2 Million by 2027. The market value to continue its significant growth rate in the coming years.
COVID-19 Analysis
During the pandemic period, the market outlook faced tough challenges which were hard to overcome. Due to the strict lockdown guidelines, every service sector was shut down, which hindered the growth of different markets. As in the lockdown period, everything was shut, the foodservice centers were even closed, which directly showed a bad impact on the Plastic tableware market analysis. All the restaurants, hotels, resorts, Café’s and other foodservice centers were closed to stop the spread of the deadly service. This factor has majorly hampered market growth. But with the help of key players, the market will recover its growth to reach the estimated CAGR.
Chief Factors Existing in The Market
The key drivers are why the market is emerging globally. The foodservice industries such as the star hotels, restaurants, and Café service providers are the key drivers of the market.
Various challenging factors are likely to affect the market. The pandemic period was a tough, challenging situation for the market because the supply chain process of distribution channels was halted. This was a major challenging factor of the market trends.
The Plastic tableware market trends notice great opportunities from various food service centers. The growth of new restaurants and hotels worldwide is setting huge opportunities for the market.
There are various restraining factors of the market, which hamper the market's growth rate. The rise in concern for plastic pollution for the safety of the environment is one of the major restraining factors of the market. The non-degradable nature of plastic is even affecting the market’s growth.
Cumulative Evaluation of The Market
The evaluated report of the Plastic tableware market shows that the market is noticing a decent growth rate, and it will continue its growth in the coming years. The key drivers of the market are driving the market and helping it to overcome the challenging factors. Amid COVID-19, the market to progress with its growth in the future years to achieve its estimated CAGR. The restraining factors of the market are taken into consideration to help the upsurge of the market to witness its USD value during the forecast period. The market will show significant growth and will compete at the global level.
Market Segmentation
The Plastic tableware market size is segmented into type and distribution channel segments.
The market is divided into various sub-segments such as plates, bowls, cutlery, cups & glasses, and others in the type of segment. These are the various dishware through which the food gets served. These essential segments are usually set for dining purposes to serve different dishes. It is mostly used in hotels, restaurants, cafes, and residences to serve food. The plastic bowls have heat resistance capacity and pressure. Hence this is suitable for both hot and cool served food. The type of segment will achieve a good market share due to its wide usage in various foodservice centers.
The market is classified into store-based and non-store-based segments in the distribution channel. The store-based segment is further sub-divided into supermarkets & hypermarkets, convenience stores, and others. The store-based segment dominates the market analysis due to its wide preference. The non-store-based segment is estimated to reach the highest CAGR during the review period. Customers mostly prefer the store-based segment across the world.
Regional Analysis
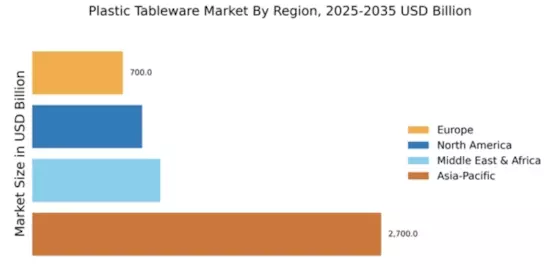
The Plastic tableware market's geographical status shows that the market is distributed into various regions worldwide, such as North America, Europe, Asia Pacific, and the rest of the world. The Asia Pacific is considered the dominating region among the above regions because it holds the highest Plastic tableware market Share. The Asia Pacific is expected to project the highest CAGR due to the launch of new products. The increase in investment in plastic tableware is propelling the region's regional market. The retail sectors of the Asia Pacific are emerging due to their wide preference for the sale of plastic tableware. These factors are uplifting the Plastic tableware market Share in this region. The US and Canada regions are responsible for the sale of the market, which is uplifting the regional market of the North American Market. Online stores have become the fastest-growing segment in the US region. The other regions of the Plastic tableware market even show a significant growth rate in the coming years.
Competitive Analysis Within the Industry
The prominent players of the Plastic tableware market are properly leading the market to reach its estimated CAGR. The below listed are the key players of the Plastic tableware market.
Recent Market Developments
Report Overview
The report's overview shows the development of the Plastic tableware market across the world. The effective role of key market drivers and the widespread marketing opportunities is propelling the market's growth rate. The key players check the other growth hampering factors to run the business smoothly. The awareness of plastic pollution and a plastic-free environment affected the Plastic tableware market. But the replacement of biodegradable plastics further lifted the market to regain its growth rate. The COVID-19 challenging situation was a tough period for the Plastic tableware market, but the strategies implemented by the key players helped the market restore its growth rate. The various segments of the market reach the highest CAGR because of the largest share value in the market. The regional report shows the development of the Plastic tableware market Forecast in various regions with the key growth drivers of the regions. If its growth consistency continues, the market is estimated to witness a good CAGR during the review period.
Key Industrial Segments
By Type
By Distribution Channel
Report Attribute/Metric | Details |
---|---|
Market Size | USD 9,323.2 Million (2027) |
CAGR | 2.98% (2020-2027) |
Base Year | 2019 |
Forecast Period | 2027 |
Historical Data | 2018 |
Forecast Units | Value (USD Million) |
Report Coverage | Revenue Forecast, Competitive Landscape, Growth Factors, and Trends |
Segments Covered | Type, Distribution Channel |
Geographies Covered | North America, Europe, Asia-Pacific, and Rest of the World (RoW) |
Key Vendors | Libbey Inc. (US), Lollicup USA (US), American Greetings Corporation (US), AmerCare (US), Dopla Spa (Italy), Huhtamaki Group (Finland), Solia USA (US), Dart Container Corporation (US), Georgia-Pacific LLC (US), and Genpak LLC (US). |
Key Market Opportunities | The Shifting Consumer Preference Towards Biodegradable Plastics |
Key Market Drivers | New Product Launches |
Frequently Asked Questions (FAQ) :
The Plastic Tableware Market Value is worth USD 9,323.2 Million during the forecast period.
The Asia Pacific region holds the dominating share value of the Plastic Tableware Market Forecast.
The prominent key players of the Plastic Tableware Market are Libbey Inc. (US), Lollicup USA (US), American Greetings Corporation (US), AmerCare (US), Dopla Spa (Italy), Huhtamaki Group (Finland), Solia USA (US), Dart Container Corporation (US), Georgia-Pacific LLC (US), and Genpak LLC (US)