• Cat-intel
  • MedIntelliX
  • Resources
  • About Us
  • Hero Background
    English
    Chinese
    French
    Japanese
    Korean
    German
    Spanish

    Phenolic Antioxidant Market Share

    ID: MRFR/CnM/2635-CR
    123 Pages
    Priya Nagrale
    September 2017

    Phenolic Antioxidant Market Research Report Information: by Source (Natural and Synthetic), By Application (Food, Plastics & Rubber, Pharmaceutical, Cosmetic, Fuel & Lubricant and Other), and by Region (Asia Pacific, Europe, North America, Latin America, and Middle East &Africa,) - Forecast till 2035

    Share:
    Download PDF ×

    We do not share your information with anyone. However, we may send you emails based on your report interest from time to time. You may contact us at any time to opt-out.

    Phenolic Antioxidant Market Infographic
    $ 4,950.0
    $ 5,950.0
    $ 7,250.0

    Market Share

    Phenolic Antioxidant Market Share Analysis

    There are numerous ways in which the phenolic antioxidant market can create an effective positioning and thus improve its share in the global market. Product differentiation is one of the fundamental strategies used by firms to make their phenolic antioxidants stand out from those offered by competitors. This involves coming up with distinct formulations, enhancing antioxidant properties, or creating specialized products that suit a particular industrial use. Pricing decisions are central in determining how Phenolic Antioxidants will be positioned within the market. Companies may decide on pricing competitively, targeting cost-sensitive customers with affordable solutions, hence capturing larger markets. On the other hand, they may employ premium prices, considering them high quality or conforming to tough industry requirements, thus attracting customers who would want to spend more for value. Striking a balance between price and value is critical for successful brand positioning within a market, leading to substantial shares being taken. Distribution networks are crucial in the market share placement of phenolic antioxidants. This is because it ensures that the antioxidants are available in many places by establishing strong ties with chemical manufacturers, distributors, and end-users. As a result, potential buyers can easily find where to buy phenolic antioxidants, thereby increasing their market share. Brand recognition and marketing strategies are some of the key factors that affect market share within the Phenolic Antioxidants industry. An enormous influence has been made by building a unique brand image and making several positive associations with these oxidants, as it can significantly alter customer preferences. To ensure an increased market share, companies have to invest in focused marketing initiatives such as advertising specific to this sector and participating in trade shows on the Internet. Innovation and adaptability are vital concepts in ever-changing markets for phenolic antioxidants. Staying up-to-date with emerging technologies and movements in the industry positions companies as frontrunners, providing cutting-edge solutions. Collaboration and strategic partnerships also play a vital role in market share positioning in the Phenolic Antioxidants industry. These include alliances with raw material suppliers, research institutions, or other players within this line of business, which may lead to synergies that would improve product quality and promote production flow processes while creating a more formidable market presence. Market Share Positioning for Phenolic Antioxidants: Global Market Dynamics and Regional Considerations Different regions have unique demands based on their preferences; thus, they need to develop strategies tailored towards those particular markets.

    Market Summary

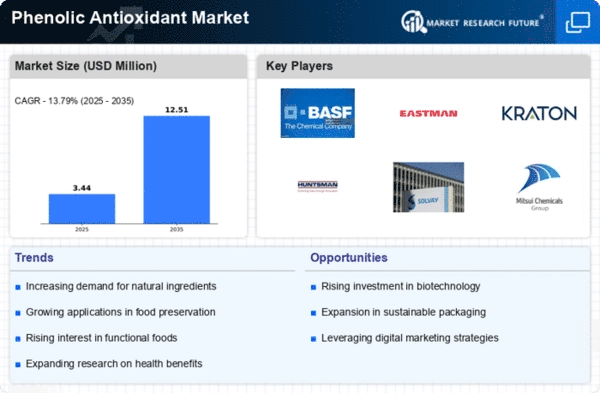
    The Global Phenolic Antioxidant Market is projected to grow from 1250 USD Million in 2024 to 2750 USD Million by 2035.

    Key Market Trends & Highlights

    Phenolic Antioxidant Key Trends and Highlights

    • The market is expected to witness a compound annual growth rate (CAGR) of 7.43% from 2025 to 2035.
    • By 2035, the market valuation is anticipated to reach 2750 USD Million, indicating robust growth.
    • In 2024, the market is valued at 1250 USD Million, reflecting a strong foundation for future expansion.
    • Growing adoption of natural antioxidants due to increasing consumer awareness about health benefits is a major market driver.

    Market Size & Forecast

    2024 Market Size 1250 (USD Million)
    2035 Market Size 2750 (USD Million)
    CAGR (2025 - 2035) 7.43%
    Largest Regional Market Share in 2024 -)

    Major Players

    Apple Inc (US), Microsoft Corp (US), Amazon.com Inc (US), Alphabet Inc (US), Berkshire Hathaway Inc (US), Tesla Inc (US), Meta Platforms Inc (US), Johnson & Johnson (US), Visa Inc (US), Procter & Gamble Co (US)

    Market Trends

    The market for phenolic antioxidants expects outstanding speed growth in the coming years. This is mainly due to the better workability and efficacy of phenolic antioxidants in adverse conditions, high pressure, and temperature. Along with this, factors such as the increase in the adoption of plastics in the automotive industry reduce the overall weight. This, in turn, will boost demand for phenolic antioxidants during the forecast and, therefore, should offer a profitable gain in the plastic additives market.

    Besides, the growing application of phenolic antioxidants for plastic and rubber compounds' production offers traction to the market of phenolic antioxidants. This is mainly due to its superior properties and lower cost compared to other composite materials.

    However, it is expected that factors such as strict government regulations, the adverse impact of plastics on the environment, and increasing practice of plastic recycling will prevent the growth of the global phenolic antioxidant.

    However, the increase in disposable income, the rapid industrialization, and the flourishing of automobile sales and production are some of the factors that should drive the phenolic antioxidant market growth in the coming years.

    Phenolic antioxidant market analysis: a regional perspective

    Based on the region, Asia-Pacific will dominate the global phenolic antioxidants market share in the coming years. This is mainly due to the presence of the main companies in the region. Also, China supports more than a quarter of the phenolic antioxidants in terms of volume. The revenues generated by these countries are an important factor that should accelerate the global market of phenolic antioxidants growth in the coming years.

    This research is a comprehensive picture of the market dynamics. It primarily consists of the critical assessment of customer and consumer travel, emerging and current pathways, and a strategic framework to enable CHOs to make effective decisions.

    The 4-quadrant Phenolic antioxidant market  EIRS structure:

    Strategic structures to drive the growth journey Customer experience maps Action results to meet all business priorities Understandings and tools based on data research

    The research strives to assess future and current growth prospects, factors that shape its revenue potentials, unused pathways, and consumption and requirements patterns in the global market, dividing it into a regional assessment.

    The following regional segments are covered in detail:

    North America The Middle East and Africa Asia Pacific Latin America Europe

    The structure of the EIR's quadrant in the report summarizes the broad spectrum of data research and consulting sites for CHOs to help them remain leaders and make better business decisions.

    Below is a picture of these Phenolic antioxidant market  quadrants.

    Customer experience map

    The research offers a detailed assessment of several customers' travels related to the market and its segments. It offers various impressions of the customer about the use of services and products. The analysis looks more closely at the major fears and points at various contact points with the client. Business consulting and intelligence solutions will help stakeholders, including CHOs, define customer experience maps tailored to their needs. This will help them increase customer engagement with their brands.

    Understandings and tools

    The increasing demand for natural antioxidants in food preservation and the rising awareness of health benefits associated with phenolic compounds appear to be driving growth in the global phenolic antioxidant market.

    U.S. Department of Agriculture

    Phenolic Antioxidant Market Market Drivers

    Rising Health Consciousness

    The increasing awareness of health and wellness among consumers is driving the Global Phenolic Antioxidant Market Industry. As individuals become more informed about the benefits of antioxidants in combating oxidative stress and chronic diseases, the demand for phenolic antioxidants is likely to surge. This trend is particularly evident in the food and beverage sector, where manufacturers are incorporating these compounds into products to enhance nutritional value. The market is projected to reach 1250 USD Million in 2024, reflecting a growing consumer preference for natural and functional ingredients that promote health and longevity.

    Growing Demand in Pharmaceuticals

    The pharmaceutical sector is increasingly recognizing the potential of phenolic antioxidants, contributing to the growth of the Global Phenolic Antioxidant Market Industry. These compounds are being studied for their therapeutic properties, including anti-inflammatory and anticancer effects. As research continues to unveil the health benefits associated with phenolic antioxidants, pharmaceutical companies are likely to incorporate these ingredients into their formulations. This trend suggests a promising future for the market, with a compound annual growth rate (CAGR) of 7.43% anticipated from 2025 to 2035, reflecting the rising interest in natural compounds for health applications.

    Expansion in Food and Beverage Applications

    The Global Phenolic Antioxidant Market Industry is experiencing significant growth due to the expanding applications of phenolic antioxidants in the food and beverage sector. These compounds are utilized to prevent oxidation in various products, thereby extending shelf life and maintaining quality. For instance, the incorporation of phenolic antioxidants in oils and fats has become a common practice to enhance stability. As the global food industry continues to evolve, the market for phenolic antioxidants is expected to grow, with projections indicating a rise to 2750 USD Million by 2035, driven by the increasing demand for processed and packaged foods.

    Regulatory Support for Natural Antioxidants

    The Global Phenolic Antioxidant Market Industry is benefiting from favorable regulatory frameworks that promote the use of natural antioxidants in various applications. Governments and health organizations are increasingly endorsing the incorporation of natural compounds in food, cosmetics, and pharmaceuticals, recognizing their potential health benefits. This regulatory support encourages manufacturers to explore and invest in phenolic antioxidants, leading to a broader acceptance and integration of these ingredients in consumer products. As a result, the market is poised for growth, driven by the alignment of regulatory policies with consumer preferences for natural and safe ingredients.

    Technological Advancements in Extraction Methods

    Innovations in extraction technologies are playing a pivotal role in the Global Phenolic Antioxidant Market Industry. Advanced methods such as supercritical fluid extraction and enzymatic extraction are enhancing the efficiency and yield of phenolic compounds from natural sources. These improvements not only increase the availability of high-quality antioxidants but also reduce production costs, making them more accessible to manufacturers. As technology continues to advance, the market is likely to benefit from improved extraction techniques, which could further stimulate growth and innovation in product development.

    Market Segment Insights

    Regional Insights

    Key Companies in the Phenolic Antioxidant Market market include

    Industry Developments

    Future Outlook

    Phenolic Antioxidant Market Future Outlook

    The Global Phenolic Antioxidant Market is projected to grow at a 7.43% CAGR from 2024 to 2035, driven by increasing demand in food preservation, cosmetics, and pharmaceuticals.

    New opportunities lie in:

    • Develop innovative formulations for natural phenolic antioxidants to cater to health-conscious consumers.
    • Expand distribution channels in emerging markets to capitalize on rising industrial applications.
    • Invest in R&D for bio-based phenolic antioxidants to enhance sustainability and meet regulatory standards.

    By 2035, the market is expected to exhibit robust growth, reflecting heightened consumer awareness and innovation.

    Market Segmentation

    Report Scope

    Attribute/Metric Details
      Market Size   Significant USD
      CAGR   5.10%
      Base Year   2020
      Forecast Period   2021 to 2030
      Historical Data   2019 & 2020
      Forecast Units   Value (USD Million)
      Report Coverage   Revenue Forecast, Competitive Landscape, Growth Factors, and Trends
      Segments Covered   Type, Application and End-Use
      Geographies Covered   North America, Europe, Asia-Pacific, and Rest of the World (RoW)
      Key Vendors   BASF SE (Germany), DSM (Netherlands), Oxiris Chemicals S A (Spain), Chitec Technology Co., Ltd. (Taiwan), Sumitomo Chemical Company (Japan), Mayzo Inc. (US), Double Bond Chemical Ind., Co., Ltd. (Taiwan), Addivant (US), Emerald Performance Materials LLC (US), and Kumho Petrochemical Co., Ltd. (South Korea)
      Key Market Opportunities   The increase in the adoption of plastics in the automotive industry reduce the overall weight.
      Key Market Drivers   The growing application of phenolic antioxidants for plastic and rubber compounds

    Market Highlights

    Author

    Priya Nagrale
    Senior Research Analyst

    She holds an experience of about 6+ years in market research and business consulting, working under the spectrum of information communication technology, telecommunications and semiconductor domains. aarti conceptualizes and implements a scalable business strategy and provides strategic leadership to the clients. her expertise lies in market estimation, competitive intelligence, pipeline analysis, customer assessment, etc.

    Leave a Comment

    Latest Comments

    John Doe
    john@example.com

    This is a great article! Really helped me understand the topic better.

    Posted on July 23, 2025, 10:15 AM
    Jane Smith
    jane@domain.com

    Thanks for sharing this. I’ve bookmarked it for later reference.

    Posted on July 22, 2025, 7:45 PM

    FAQs

    What is the valuation that the global phenolic antioxidant market is estimated to create over the review period?

    The global phenolic antioxidant market is estimated to create a valuation of USD 1830.05 MN by 2025, registering 5.10% CAGR throughout the assessment period (2025-2035).

    Which is the largest region in global phenolic antioxidant market?

    Asia Pacific is the largest region in the global phenolic antioxidant market. The region is estimated to retain its leading position throughout the assessment period (2025-2035), holding the largest share.

    What are the key driving forces behind the growth of the global phenolic antioxidant market?

    Rising demand as an additive in plastic & rubber and fuel & lubricant manufacturing industry

    Which is the largest segment in the global phenolic antioxidant market?

    The sub segment – Food by applications is the largest segment in the in the global phenolic antioxidant market. The sub segment is projected to reach a valuation of USD significant by the end of 2035.

    Who are the top players in the global phenolic antioxidant market?

    BASF SE (Germany), DSM (Netherlands), Oxiris Chemicals S A (Spain), Chitec Technology Co., Ltd. (Taiwan), Sumitomo Chemical Company (Japan), Mayzo Inc. (US), Double Bond Chemical Ind., Co., Ltd. (Taiwan), Addivant (US), Emerald Performance Materials LLC (US), and Kumho Petrochemical Co., Ltd. (South Korea), are some of the leading players in the global phenolic antioxidant market.

    1. Executive Summary
      1. \r\n
      2. \r\n2 Scope
      3. Of The Report
      4. \r\n2.1
      5. Market Definition
      6. \r\n2.2 Scope Of The Study
      7. \r\n2.2.1
      8. Research Objectives
      9. \r\n2.2.2 Assumptions &
      10. Limitations
      11. \r\n2.3 Markets Structure
      12. \r\n3 Market
      13. Research Methodology
      14. \r\n3.1
      15. Research Process
      16. \r\n3.2 Secondary Research
      17. \r\n3.3
      18. Primary Research
      19. \r\n3.4 Forecast Model
      20. \r\n4 Market
      21. Landscape
      22. \r\n4.1 Five Forces Analysis
      23. \r\n4.1.1
      24. Threat Of New Entrants
      25. \r\n4.1.2
      26. Bargaining Power Of Buyers
      27. \r\n4.1.3
      28. Threat Of Substitutes
      29. \r\n4.1.4
      30. Segment Rivalry
      31. \r\n4.2 Value Chain/Supply
      32. Chain Of Global Phenolic Antioxidants Market
      33. \r\n5 Industry
      34. Overview Of Global Phenolic Antioxidants Market
      35. \r\n5.1
      36. Introduction
      37. \r\n5.2 Growth Drivers
      38. \r\n5.3
      39. Impact Analysis
      40. \r\n5.4 Market Challenges
      41. \r\n5.5
      42. Impact Analysis
      43. \r\n6 Market Trends
      44. \r\n6.1
      45. Introduction
      46. \r\n6.2 Growth Trends
      47. \r\n6.3
      48. Impact Analysis
      49. \r\n7 Global Phenolic Antioxidants Market By Type
      50. \r\n7.1
      51. Introduction
      52. \r\n7.2 Natural
      53. \r\n7.3
      54. Synthetic
      55. \r\n8 Global Phenolic Antioxidants Market By Phenolic Group
      56. \r\n8.1
      57. Introduction
      58. \r\n8.2 Mono- Functional Phenols
      59. \r\n8.3
      60. Bi- Functional Phenols
      61. \r\n8.4
      62. Multi-Functional Phenols
      63. \r\n9 Global Phenolic Antioxidants Market By End Use
      64. \r\n9.1
      65. Introduction
      66. \r\n9.2 Food & Feed
      67. \r\n9.3
      68. Plastic
      69. \r\n9.4 Fuel & Lubricants
      70. \r\n9.5
      71. Rubber
      72. \r\n9.6 Cosmetic & Personal
      73. Care
      74. \r\n9.7 Other
      75. \r\n10 Global
      76. Phenolic Antioxidants Market By Region
      77. \r\n10.1
      78. Introduction
      79. \r\n10.2 North America
      80. \r\n10.2.1
      81. US
      82. \r\n10.2.2 Canada
      83. \r\n10.3
      84. Europe
      85. \r\n10.3.1 Germany
      86. \r\n10.3.2.
      87. France
      88. \r\n10.3.3 Italy
      89. \r\n10.3.4
      90. Spain
      91. \r\n10.3.5 UK
      92. \r\n10.4
      93. Asia Pacific
      94. \r\n10.4.1 China
      95. \r\n10.4.2
      96. India
      97. \r\n10.4.3 Japan
      98. \r\n10.4.4
      99. Australia
      100. \r\n10.4.5 New Zealand
      101. \r\n10.4.6
      102. Rest Of Asia-Pacific
      103. \r\n10.5 Middle East &
      104. Africa
      105. \r\n10.5.1 Turkey
      106. \r\n10.5.2
      107. Israel
      108. \r\n10.5.3 North Africa
      109. \r\n10.5.4
      110. GCC
      111. \r\n10.5.5 Rest Of Middle East
      112. & Africa
      113. \r\n10.6 Latin America
      114. \r\n10.6.1
      115. Brazil
      116. \r\n10.6.2 Argentina
      117. \r\n10.6.3
      118. Rest Of Latin America
      119. \r\n11 Company Landscape
      120. \r\n
      121. \r\n12 Company
      122. Profiles
      123. \r\n12.1 Mayzo Inc
      124. \r\n12.1.1
      125. Company Overview
      126. \r\n12.1.2 Product/Business
      127. Segment Overview
      128. \r\n12.1.3 Financial Updates
      129. \r\n12.1.4
      130. Key Developments
      131. \r\n
      132. \r\n12.2
      133. BASF SE
      134. \r\n12.2.1 Company Overview
      135. \r\n12.2.2
      136. Product/Business Segment Overview
      137. \r\n12.2.3
      138. Financial Updates
      139. \r\n12.2.4 Key Developments
      140. \r\n12.3
      141. Archer Daniels Midland Company
      142. \r\n12.3.1
      143. Company Overview
      144. \r\n12.3.2 Product/Business
      145. Segment Overview
      146. \r\n12.3.3 Financial Updates
      147. \r\n12.3.4
      148. Key Developments
      149. \r\n12.4 Evonik Industries
      150. \r\n12.4.1
      151. Company Overview
      152. \r\n12.4.2 Product/Business
      153. Segment Overview
      154. \r\n12.4.3 Financial Updates
      155. \r\n12.4.4
      156. Key Developments
      157. \r\n12.5 DSM
      158. \r\n12.5.1
      159. Company Overview
      160. \r\n12.5.2 Product/Business
      161. Segment Overview
      162. \r\n12.5.3 Financial Updates
      163. \r\n12.5.4
      164. Key Developments
      165. \r\n12.6 OXIRIS
      166. \r\n12.6.1
      167. Company Overview
      168. \r\n12.6.2 Product/Business
      169. Segment Overview
      170. \r\n12.6.3 Financial Updates
      171. \r\n12.6.4
      172. Key Developments
      173. \r\n12.7 VDH CHEM TECH PVT.
      174. LTD
      175. \r\n12.8.1 Company Overview
      176. \r\n12.7.2
      177. Product/Business Segment Overview
      178. \r\n12.7.3
      179. Financial Updates
      180. \r\n12.7.4 Key Developments
      181. \r\n12.8
      182. Akrochem Corporation
      183. \r\n12.8.1 Company Overview
      184. \r\n12.8.2
      185. Product/Business Segment Overview
      186. \r\n12.8.3
      187. Financial Updates
      188. \r\n12.8.4 Key Developments
      189. \r\n12.9
      190. Chitec Technology Co. Ltd
      191. \r\n12.8.1
      192. Company Overview
      193. \r\n12.9.2 Product/Business
      194. Segment Overview
      195. \r\n12.9.3 Financial Updates
      196. \r\n12.9.4
      197. Key Developments
      198. \r\n12.10 Addivant.
      199. \r\n12.10.1
      200. Company Overview
      201. \r\n12.10.2 Product/Business
      202. Segment Overview
      203. \r\n12.10.3 Financial Updates
      204. \r\n12.10.4
      205. Key Developments
      206. \r\n13 Conclusion
      207. \r\n
      208. \r\n14 List
      209. Of Tables
      210. \r\nTable 1 World Population
      211. By Major Regions (2020 To 2027)
      212. \r\nTable
    2. Global Phenolic Antioxidants Market: By Region, 2020-2027
      1. \r\nTable
    3. North America Phenolic Antioxidants Market: By Country, 2020-2027
      1. \r\nTable
    4. Europe Phenolic Antioxidants Market: By Country, 2020-2027
      1. \r\nTable
    5. Asia-Pacific Phenolic Antioxidants Market: By Country, 2020-2027
      1. \r\nTable
    6. Middle East & Africa Phenolic Antioxidants Market: By Country, 2020-2027
      1. \r\nTable
    7. Latin America Phenolic Antioxidants Market: By Country, 2020-2027
      1. \r\nTable
    8. Global Phenolic Antioxidants By Type Market: By Regions, 2020-2027
      1. \r\nTable
    9. North America Phenolic Antioxidants By Type Market: By Country, 2020-2027
      1. \r\nTable
    10. Europe Phenolic Antioxidants By Type Market: By Country, 2020-2027
      1. \r\nTable
    11. Asia-Pacific Phenolic Antioxidants By Type Market: By Country, 2020-2027
      1. \r\nTable
    12. Middle East & Africa Phenolic Antioxidants By Type Market: By Country, 2020-2027
      1. \r\nTable
    13. Latin America Phenolic Antioxidants By Type Market: By Country, 2020-2027
      1. \r\nTable
    14. Global Phenolic Antioxidants By Phenolic Group Market: By Regions, 2020-2027
      1. \r\nTable
    15. North America Phenolic Antioxidants By Phenolic Group Market: By Country, 2020-2027
      1. \r\nTable
    16. Europe Phenolic Antioxidants By Phenolic Group Market: By Country, 2020-2027
      1. \r\nTable
    17. Asia-Pacific Phenolic Antioxidants By Phenolic Group Market: By Country, 2020-2027
      1. \r\nTable
    18. Middle East & Africa Phenolic Antioxidants By Phenolic Group Market: By Country,
      1. \r\nTable 19 Latin America
      2. Phenolic Antioxidants By Phenolic Group Market: By Country, 2020-2027
      3. \r\nTable
    19. North America Phenolic Antioxidants For End-Use Market: By Country, 2020-2027
      1. \r\nTable
    20. Europe Phenolic Antioxidants For End-Use Market: By Country, 2020-2027
      1. \r\nTable
    21. Asia-Pacific Phenolic Antioxidants For End-Use Market: By Country, 2020-2027
      1. \r\nTable
    22. Middle East & Africa Phenolic Antioxidants For End-Use Market: By Country,
      1. \r\nTable 24 Latin America
      2. Phenolic Antioxidants For End-Use Market: By Country, 2020-2027
      3. \r\nTable
    23. Global Type Market: By Region, 2020-2027
      1. \r\nTable
    24. Global End Uses Market: By Region, 2020-2027
      1. \r\nTable
    25. Global End-Use Market: By Region, 2020-2027
      1. \r\nTable
    26. North America Phenolic Antioxidants Market, By Country
      1. \r\nTable
    27. North America Phenolic Antioxidants Market, By Type
      1. \r\nTable
    28. North America Phenolic Antioxidants Market, By Phenolic Group
      1. \r\nTable
    29. North America Phenolic Antioxidants Market, By End-Use
      1. \r\nTable
    30. Europe: Phenolic Antioxidants Market, By Country
      1. \r\nTable
    31. Europe: Phenolic Antioxidants Market, By Type
      1. \r\nTable
    32. Europe: Phenolic Antioxidants Market, By Phenolic Group
      1. \r\nTable
    33. Europe: Phenolic Antioxidants Market, By End-Use
      1. \r\nTable
    34. Asia-Pacific: Phenolic Antioxidants Market, By Country
      1. \r\nTable
    35. Asia-Pacific: Phenolic Antioxidants Market, By Type
      1. \r\nTable
    36. Asia-Pacific: Phenolic Antioxidants Market, By Phenolic Group
      1. \r\nTable
    37. Asia-Pacific: Phenolic Antioxidants Market, By End-Use
      1. \r\nTable
    38. Middle East & Africa: Phenolic Antioxidants Market, By Country
      1. \r\nTable
    39. Middle East & Africa Phenolic Antioxidants Market, By Type
      1. \r\nTable
    40. Middle East & Africa Phenolic Antioxidants Market, By Phenolic Group
      1. \r\nTable
    41. Middle East & Africa: Phenolic Antioxidants Market, By End-Use
      1. \r\nTable
    42. Latin America: Phenolic Antioxidants Market, By Country
      1. \r\nTable
    43. Latin America Phenolic Antioxidants Market, By Type
      1. \r\nTable
    44. Latin America Phenolic Antioxidants Market, By Phenolic Group
      1. \r\nTable
    45. Latin America: Phenolic Antioxidants Market, By End-Use
      1. \r\n15 List
      2. Of Figures
      3. \r\nFIGURE 1 Global Phenolic
      4. Antioxidants Market Segmentation
      5. \r\nFIGURE
    46. Forecast Methodology
      1. \r\nFIGURE
    47. Five Forces Analysis Of Global Phenolic Antioxidants Market
      1. \r\nFIGURE
    48. Value Chain Of Global Phenolic Antioxidants Market
      1. \r\nFIGURE
    49. Share Of Global Phenolic Antioxidants Market In 2020, By Country (In %)
      1. \r\nFIGURE
    50. Global Phenolic Antioxidants Market, 2020-2027,
      1. \r\nFIGURE
    51. Sub-Segments Of End Uses
      1. \r\nFIGURE
    52. Global Phenolic Antioxidants Market Size By End Use, 2020
      1. \r\nFIGURE
    53. Share Of Global Phenolic Antioxidants Market By End Use, 2020 To 2027
      1. \r\nFIGURE
    54. Global Phenolic Antioxidants Market Size By Phenolic Group, 2020
      1. \r\nFIGURE
    55. Share Of Global Phenolic Antioxidants Market By Phenolic Group, 2020 To 2027
      1. \r\nFIGURE
    56. Global Phenolic Antioxidants Market Size By Type, 2020
      1. \r\nFIGURE
    57. Share Of Global Phenolic Antioxidants Market By Type, 2020 To 2027
      1. \r\n

    Phenolic Antioxidant Market Segmentation

    Market Segmentation Overview

    • Detailed segmentation data will be available in the full report
    • Comprehensive analysis by multiple parameters
    • Regional and country-level breakdowns
    • Market size forecasts by segment
    Infographic

    Free Sample Request

    Kindly complete the form below to receive a free sample of this Report

    Get Free Sample

    Customer Strories

    “I am very pleased with how market segments have been defined in a relevant way for my purposes (such as "Portable Freezers & refrigerators" and "last-mile"). In general the report is well structured. Thanks very much for your efforts.”

    Victoria Milne

    Founder
    Case Study
    Chemicals and Materials