1 Executive Summary
2 Introduction
2.1 Definition 13
2.2 Scope Of The Study 13
2.3 Assumptions 13
2.4 Market Structure 14
3 Research Methodology
3.1 Research Process 15
3.2 Primary Research 15
3.3 Secondary Research 16
3.4 Market Size Estimation 16
3.5 Forecast Model 18
4 Market Dynamics
4.1 Introduction 19
4.2 Drivers 20
4.2.1 Rising Industrialization 20
4.2.2 Increasing Urbanization 20
4.2.3 Government Initiatives 21
4.3 Restraints 22
4.3.1 High Initial Equipment And Operation Cost 22
4.4 Opportunities 22
4.4.1 Growth In Emerging Market 22
5 Market Factor Analysis
5.1 Porter's 5 Forces Analysis 23
5.1.1 Threat Of New Entrants 23
5.1.2 Bargaining Power Of Suppliers 24
5.1.3 Bargaining Power Of Buyers 24
5.1.4 Threat Of Substitute 24
5.1.5 Segment Rivalry 24
5.2 Value Chain Analysis 25
5.2.1 Raw Material 25
5.2.2 Manufacturers 25
5.2.3 Designing And Manufacturing 25
5.2.4 Distribution To End-Users 26
5.2.5 On-Site Assembly & After-Sales Services 26
6 Global Packaged Water Treatment System Market, By Type
6.1 Overview 28
6.1.1 Extended Aeration 29
6.1.2 MBR 29
6.1.3 MBBR 29
6.1.4 Reverse Osmosis 29
6.1.5 SBR 30
6.1.6 Others 30
7 Global Packaged Water Treatment System Market, By Application
7.1 Overview 32
7.1.1 Industrial 33
7.1.2 Municipal 34
7.1.3 Others 34
8 Global Packaged Water Treatment System Market, By Region
8.1 Overview 36
8.2 North America 38
8.2.1 US 41
8.2.2 Canada 42
8.3 Europe 44
8.3.1 Germany 46
8.3.2 UK 48
8.3.3 France 50
8.3.4 Italy 52
8.3.5 Rest Of Europe 53
8.4 Asia-Pacific 54
8.4.1 China 57
8.4.2 Japan 59
8.4.3 India 60
8.4.4 Rest Of Asia-Pacific 62
8.5 Middle East & Africa 62
8.5.1 UAE 65
8.5.2 Saudi Arabia 66
8.5.3 South Africa 67
8.5.4 Rest Of Middle East & Africa 68
8.6 Latin America 70
9 Competitive Scenario
9.1 Competitive Landscape 72
9.1.1 Expansion 73
9.1.2 New Product Development 74
9.1.3 Mergers And Acquisitions 74
9.1.4 Agreement & Partnership 74
10 Company Profiles
10.1 GE Water & Process Technologies 75
10.1.1 Company Overview 75
10.1.2 Financial Overview 76
10.1.3 Product/Business Segment Overview 77
10.1.4 Strategy 77
10.2 WPL Limited 79
10.2.1 Company Overview 79
10.2.2 Financial Overview 79
10.2.3 Product Offering 79
10.2.4 Strategy 80
10.2.5 SWOT Analysis 81
10.3 Veolia Water Technologies 82
10.3.1 Company Overview 82
10.3.2 Financial Overview 82
10.3.3 Product Offering 83
10.3.4 Strategy 83
10.4 RWL Water 85
10.4.1 Company Overview 85
10.4.1 Financial Overview 85
10.4.2 Product/Business Segment Overview 85
10.4.3 Strategy 86
10.5 WesTech Engineering, Inc. 87
10.5.1 Company Overview 87
10.5.2 Financial Overview 87
10.5.3 Product/Business Segment Overview 87
10.5.4 Strategy 88
10.5.5 SWOT Analysis 88
10.6 Smith & Loveless Inc. 89
10.6.1 Company Overview 89
10.6.2 Financial Overview 89
10.6.3 Product/Segment Business Overview 89
10.6.4 Strategy 90
10.7 Napier-Reid Ltd. 91
10.7.1 Company Overview 91
10.7.2 Financial Overview 91
10.7.3 Product/Business Segment Overview 91
10.7.4 Strategy 91
10.8 Enviroquip 92
10.8.1 Company Overview 92
10.8.2 Financial Overview 92
10.8.3 Product/Business Segment Overview 92
10.8.4 Strategy 92
10.9 Corix Water System 94
10.9.1 Company Overview 94
10.9.2 Financial Overview 94
10.9.3 Product/Business Segment Overview 94
10.9.4 Strategy 94
10.10 Tonka Equipment Company 95
10.10.1 Financial Overview 95
10.10.2 Product/Business Segment Overview 95
10.10.3 Strategy 95
11 List Of Tables
TABLE 1 GLOBAL PACKAGED WATER TREATMENT SYSTEM MARKET, BY TYPE, 2020-2027 (USD MILLION) 29
TABLE 2 GLOBAL PACKAGED WATER TREATMENT SYSTEM MARKET, BY APPLICATION, 2020-2027 (USD MILLION) 33
TABLE 3 GLOBAL PACKAGED WATER TREATMENT SYSTEM MARKET, BY REGION, 2020-2027 (USD MILLION) 38
TABLE 4 NORTH AMERICA PACKAGED WATER TREATMENT SYSTEM MARKET, BY COUNTRY, 2020-2027 (USD MILLION) 39
TABLE 5 NORTH AMERICA PACKAGED WATER TREATMENT SYSTEM MARKET, BY TYPE 2020-2027 (USD MILLION) 40
TABLE 6 NORTH AMERICA PACKAGED WATER TREATMENT SYSTEM MARKET, BY APPLICATION 2020-2027 (USD MILLION) 40
TABLE 7 US PACKAGED WATER TREATMENT SYSTEM MARKET, BY TYPE 2020-2027 (USD MILLION) 41
TABLE 8 US PACKAGED WATER TREATMENT SYSTEM MARKET, BY APPLICATION 2020-2027 (USD MILLION) 42
TABLE 9 CANADA PACKAGED WATER TREATMENT SYSTEM MARKET, BY TYPE 2020-2027 (USD MILLION) 43
TABLE 10 CANADA PACKAGED WATER TREATMENT SYSTEM MARKET, BY APPLICATION 2020-2027 (USD MILLION) 43
TABLE 11 EUROPE PACKAGED WATER TREATMENT SYSTEM MARKET, BY COUNTRY 2020-2027 (USD MILLION) 44
TABLE 12 EUROPE PACKAGED WATER TREATMENT SYSTEM MARKET, BY TYPE 2020-2027 (USD MILLION) 46
TABLE 13 EUROPE PACKAGED WATER TREATMENT SYSTEM MARKET, BY APPLICATION 2020-2027 (USD MILLION) 46
TABLE 14 GERMANY PACKAGED WATER TREATMENT SYSTEM MARKET, BY TYPE 2020-2027 (USD MILLION) 47
TABLE 15 GERMANY PACKAGED WATER TREATMENT SYSTEM MARKET, BY APPLICATION 2020-2027 (USD MILLION) 48
TABLE 16 UK PACKAGED WATER TREATMENT SYSTEM MARKET, BY TYPE 2020-2027 (USD MILLION) 49
TABLE 17 UK PACKAGED WATER TREATMENT SYSTEM MARKET, BY APPLICATION 2020-2027 (USD MILLION) 49
TABLE 18 FRANCE PACKAGED WATER TREATMENT SYSTEM MARKET, BY TYPE 2020-2027 (USD MILLION) 50
TABLE 19 FRANCE PACKAGED WATER TREATMENT SYSTEM MARKET, BY APPLICATION 2020-2027 (USD MILLION) 51
TABLE 20 ITALY PACKAGED WATER TREATMENT SYSTEM MARKET, BY TYPE 2020-2027 (USD MILLION) 52
TABLE 21 ITALY PACKAGED WATER TREATMENT SYSTEM MARKET, BY APPLICATION 2020-2027 (USD MILLION) 53
TABLE 22 REST OF EUROPE PACKAGED WATER TREATMENT SYSTEM MARKET, BY TYPE 2020-2027 (USD MILLION) 53
TABLE 23 REST OF EUROPE PACKAGED WATER TREATMENT SYSTEM MARKET, BY APPLICATION 2020-2027 (USD MILLION) 53
TABLE 24 ASIA-PACIFIC PACKAGED WATER TREATMENT SYSTEM MARKET, BY COUNTRY 2020-2027 (USD MILLION) 56
TABLE 25 ASIA-PACIFIC PACKAGED WATER TREATMENT SYSTEM MARKET, BY TYPE 2020-2027 (USD MILLION) 56
TABLE 26 ASIA-PACIFIC PACKAGED WATER TREATMENT SYSTEM MARKET, BY APPLICATION 2020-2027 (USD MILLION) 57
TABLE 27 CHINA PACKAGED WATER TREATMENT SYSTEM MARKET, BY TYPE 2020-2027 (USD MILLION) 58
TABLE 28 CHINA PACKAGED WATER TREATMENT SYSTEM MARKET, BY APPLICATION 2020-2027 (USD MILLION) 58
TABLE 29 JAPAN PACKAGED WATER TREATMENT SYSTEM MARKET, BY TYPE 2020-2027 (USD MILLION) 59
TABLE 30 JAPAN PACKAGED WATER TREATMENT SYSTEM MARKET, BY APPLICATION 2020-2027 (USD MILLION) 60
TABLE 31 INDIA PACKAGED WATER TREATMENT SYSTEM MARKET, BY TYPE 2020-2027 (USD MILLION) 61
TABLE 32 INDIA PACKAGED WATER TREATMENT SYSTEM MARKET, BY APPLICATION 2020-2027 (USD MILLION) 61
TABLE 33 REST OF ASIA-PACIFIC PACKAGED WATER TREATMENT SYSTEM MARKET, BY TYPE 2020-2027 (USD MILLION) 62
TABLE 34 REST OF ASIA-PACIFIC PACKAGED WATER TREATMENT SYSTEM MARKET, BY APPLICATION 2020-2027 (USD MILLION) 62
TABLE 35 MIDDLE EAST & AFRICA PACKAGED WATER TREATMENT SYSTEM MARKET, BY COUNTRY 2020-2027 (USD MILLION) 64
TABLE 36 MIDDLE EAST & AFRICA PACKAGED WATER TREATMENT SYSTEM MARKET, BY TYPE 2020-2027 (USD MILLION) 64
TABLE 37 MIDDLE EAST & AFRICA PACKAGED WATER TREATMENT SYSTEM MARKET, BY APPLICATION 2020-2027 (USD MILLION) 65
TABLE 38 UAE PACKAGED WATER TREATMENT SYSTEM MARKET, BY TYPE 2020-2027 (USD MILLION) 65
TABLE 39 UAE PACKAGED WATER TREATMENT SYSTEM MARKET, BY APPLICATION 2020-2027 (USD MILLION) 66
TABLE 40 SAUDI ARABIA PACKAGED WATER TREATMENT SYSTEM MARKET, BY TYPE 2020-2027 (USD MILLION) 66
TABLE 41 SAUDI ARABIA PACKAGED WATER TREATMENT SYSTEM MARKET, BY APPLICATION 2020-2027 (USD MILLION) 66
TABLE 42 SOUTH AFRICA PACKAGED WATER TREATMENT SYSTEM MARKET, BY TYPE 2020-2027 (USD MILLION) 67
TABLE 43 SOUTH AFRICA PACKAGED WATER TREATMENT SYSTEM MARKET, BY APPLICATION 2020-2027 (USD MILLION) 67
TABLE 44 REST OF MIDDLE EAST & AFRICA PACKAGED WATER TREATMENT SYSTEM MARKET, BY TYPE 2020-2027 (USD MILLION) 68
TABLE 45 REST OF MIDDLE EAST & AFRICA PACKAGED WATER TREATMENT SYSTEM MARKET, BY APPLICATION 2020-2027 (USD MILLION) 68
TABLE 46 LATIN AMERICA PACKAGED WATER TREATMENT SYSTEM MARKET, BY TYPE 2020-2027 (USD MILLION) 70
TABLE 47 LATIN AMERICA PACKAGED WATER TREATMENT SYSTEM MARKET, BY APPLICATION 2020-2027 (USD MILLION) 71
12 List Of Figures
FIGURE 1 RESEARCH PROCESS OF MRFR 15
FIGURE 2 TOP DOWN & BOTTOM UP APPROACH 17
FIGURE 3 DRIVERS & RESTRAINTS IMPACT ANALYSIS OF PACKAGED WATER TREATMENT SYSTEM 19
FIGURE 4 WORLD: INDUSTRY, VALUE ADDED (ANNUAL % GROWTH), 2012-2020 20
FIGURE 5 GLOBAL: URBAN POPULATION, 2012-2020 (USD BILLION) 21
FIGURE 6 PORTER'S 5 FORCES ANALYSIS 23
FIGURE 7 VALUE CHAIN ANALYSIS 25
FIGURE 8 GLOBAL PACKAGED WATER TREATMENT SYSTEM MARKET, BY TYPE, 2020-2027 (USD MILLION) 28
FIGURE 9 GLOBAL PACKAGED WATER TREATMENT SYSTEM MARKET, BY APPLICATION, 2020-2027 (USD MILLION) 32
FIGURE 10 GLOBAL PACKAGED WATER TREATMENT SYSTEM MARKET SHARE (%), 2020 36
FIGURE 11 GLOBAL PACKAGED WATER TREATMENT SYSTEM MARKET, BY REGION, 2020-2027 (USD MILLION) 37
FIGURE 12 NORTH AMERICA PACKAGED WATER TREATMENT SYSTEM MARKET SHARE (%), 2020 38
FIGURE 13 NORTH AMERICA PACKAGED WATER TREATMENT SYSTEM MARKET, BY COUNTRY, 2020-2027 (USD MILLION) 39
FIGURE 14 EUROPE PACKAGED WATER TREATMENT SYSTEM MARKET SHARE (%), 2020 44
FIGURE 15 EUROPE PACKAGED WATER TREATMENT SYSTEM MARKET, BY COUNTRY 2020-2027 (USD MILLION) 44
FIGURE 16 ASIA-PACIFIC PACKAGED WATER TREATMENT SYSTEM MARKET SHARE (%), 2020 55
FIGURE 17 ASIA-PACIFIC PACKAGED WATER TREATMENT SYSTEM MARKET, BY COUNTRY 2020-2027 (USD MILLION) 55
FIGURE 18 MIDDLE EAST & AFRICA PACKAGED WATER TREATMENT SYSTEM MARKET SHARE (%), 2020 62
FIGURE 19 MIDDLE EAST & AFRICA PACKAGED WATER TREATMENT SYSTEM MARKET, BY COUNTRY 2020-2027 (USD MILLION) 63
FIGURE 20 GROWTH STRATEGIES ADOPTED BY KEY PLAYERS IN GLOBAL PACKAGED WATER TREATMENT SYSTEM, 2020-2020, (%) 72
FIGURE 21 EXPANSION: % SHARE BY KEY PLAYERS, 2020-2020, (%) 73
FIGURE 22 NEW PRODUCT DEVELOPMENT: % SHARE BY KEY PLAYERS, 2020-2020,(%) 74
FIGURE 23 GE WATER & PROCESS TECHNOLOGIES: TOTAL REVENUE VS SEGMENTAL REVENUE 76
FIGURE 24 GE WATER & PROCESS TECHNOLOGIES: GEOGRAPHICAL REVENUE MIX (2020) 76
FIGURE 25 GE WATER & PROCESS TECHNOLOGIES: KEY DEVELOPMENTS, 2020-2020 (IN %) 77
FIGURE 26 SWOT ANALYSIS 78
FIGURE 27 WPL LIMITED: KEY DEVELOPMENTS (%) 80
FIGURE 28 VEOLIA WATER TECHNOLOGIES: TOTAL REVENUE VS SEGMENTAL REVENUE 82
FIGURE 29 VEOLIA WATER TECHNOLOGIES: GEOGRAPHICAL REVENUE MIX (2020) 83
FIGURE 30 VEOLIA WATER TECHNOLOGY: KEY DEVELOPMENTS, 2020-2020 (IN %) 84
FIGURE 31 SWOT ANALYSIS 84
FIGURE 32 RWL WATER: KEY DEVELOPMENTS, 2020-2020 (IN %) 86
FIGURE 33 SWOT ANALYSIS 86
FIGURE 34 SWOT ANALYSIS 90
FIGURE 35 TONKA EQUIPMENT COMPANY: KEY DEVELOPMENTS, 2020-2020 (IN %) 96
$37.29 Billion
9.41%
Middle East and Africa
2022-2028
The Packaged Water Treatment System Market will gain a 9.41% CAGR was closed at a figure worth USD 23.96 billion to reach a final market figure worth USD 37.29 billion significant value from 2022 to 2028.
The Packaged Water Treatment System market will achieve huge growth in the forecast period. Packaged water treatment systems are an alternative to traditional in-ground treatment systems. The system is also used to hold a large amount of water. One can easily transport This water treatment device to other locations. Water treatment is identical to other treatment methods, but some system models may include unique treatment elements such as adsorptive clarifiers. Both business and residential complexes can use this without having any thought. The growing population, rapid urbanisation, and emerging economies in several countries, for instance, China and India and other Asian countries, are driving the Packaged Water Treatment System Market. The system is used in the pharmaceutical manufacturing facility to reduce overall costs. This treatment removes suspended particles from the water and increases the overall water look. In the process, several technologies are used, such as a moving bed biofilm reactor, membrane bioreactor, and others that provide a cost-effective water treatment method. The increasing government regulation for environmental sustainability and technologies used for packaged and wastewater water treatment are prominent factors that drive the market.
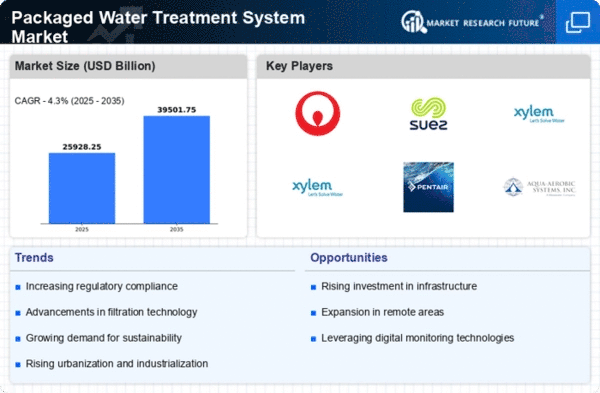
The most prominent major key players in the packaged water treatment system market all across the globe are mentioned below:
April 2022 - The food regulator has asked food commissioners of states and union territories to review the licences granted to bottlers following mounting complaints about packaged still and mineral water being sold without BIS certification in the scorching summer heat.
The Illinois Environmental Protection Agency (Illinois EPA) is announcing the issuance of $182,222,203 in water infrastructure. The loans are to the local governments and sanitary districts for the third quarter of the Fiscal Year 2022, January – March 2022.
The Michigan Department of Environment, Great Lakes, and Energy (EGLE) ordered ZF Active Safety US Inc. to install a treatment system. The system addresses unacceptable levels of vinyl chloride contamination stemming from the former Kelsey-Hayes property on Oak Street just north of downtown.
Drivers
The packages water treatment system market is on its way to global growth as there has been a huge rise in the global population. The increased degree of urbanization calls for a major boost in the global industry especially during the forecast period that ends in 2028. One of the major factors of the market is that the market products can fit into compact and small places. Also, it helps in reducing installation followed by the civil and labor costs. These are some of the factors that will help the market widen its scope and operations during the forecast period that ends in 2028. There is an increased call for the availability of freshwater resources which is another factor that will drive the market towards growth by the end of the forecast period in 2028.
Restraints
The rise of growth drivers for the market in the global market during the forecast period is followed by the restraints that will challenge the growth predicts for the market by the market experts and industry leaders. The rising population has brought along issues like less availability of water which is a natural resource. Hence, to curb the same, the global governments are setting tribunals and following strict environmental rules regarding the disposal of water in growing countries like India and China that are a part of the APAC region.
Technology Analysis
The packaged water treatment system industry is witnessing a close degree of technological development that is resulting in enhancing the degree of expansion that is taking place. Also, industrialization is a recent reality across the major global regions which is likely to boost the degree of opportunities available to the market for growth and development during the forecast period that ends in 2028. Escalating water misuse, pollution, and contamination levels followed by the increased worries amongst the rising global population have positive attributes for the market and expand at an excellent rate during the forecast period of 2021-2028.
The packaged water treatment market has been divided all across the globe based on type, application, and region.
Based on the Type
The market has been divided all across the globe based on the type into SBR, Reverse Osmosis, MBBR, MBR, Extended Aeration, and many others.
Based on the Application
The market has been divided all across the globe based on the application into the municipal sector, industrial sector, and others.
Based on the Region
The market has been divided worldwide based on the region into the North American region, Asia-Pacific region, European region, Latin American region, and the Middle East and African region.
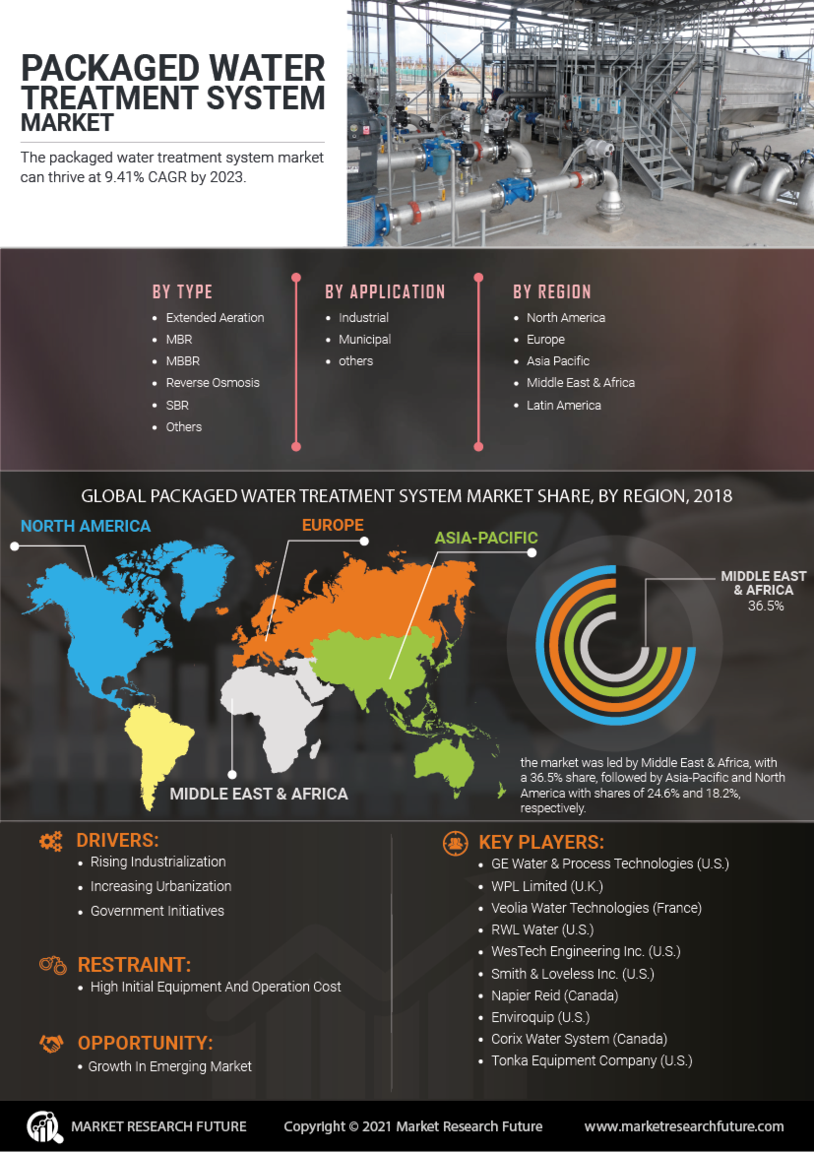
The packaged water treatment market has been divided all across the globe based on the region into North American region, Asia-Pacific region, European region, Latin American region, and the Middle East and African region. The largest market share in the global market is held by the Middle East and African region owing to increasing urbanization coupled with establishments of well-maintained drainage system that drives the market demand in this region. Moreover, increasing investment by the government for improving the living standard is another driving factor. In 2019, this region held a 36.5% market share.
Being the fastest-emerging economy, the second-largest market share in the global market is held by the Asia-Pacific region owing to increasing demand for fresh as this region contains highly populous countries like China and India that creates more market demand in this region. Moreover, increasing initiatives are taken by governments of various nations for improving water purification systems also creates more market demand in this region. In 2019, this region held a 30% market share.
The third-largest market share in the global market is held by the North American region owing to the presence of countries like the US, Canada, and Mexico coupled with the presence of a large chunk of major key players drive the market demand in this region. Moreover, increasing investment by various private and public enterprises for improving the quality of water is another factor that drives the market demand. In 2019, this region held an 18.2% market share.
The least market share in the global market is held by the Latin American region and the European region owing to low initiatives and investment is done for the treatment of water programs.
The packaged water treatment system market size has been affected because of the arrival of the novel coronavirus pandemic. The markets have been facing a crunch of resources and skilled labor that is hampering the ability of the market to meet the rising needs of the target audience.
Hence, the global markets and governments are increasing their investment in the research and development departments that will prevent the misuse of water and promote optimal and judicious use.
This global packaged water treatment system market research report consists of the following components mentioned below:
Study Objectives
This market research report contains factors that drive the growth of the market in the global market and the factors that restrict its growth in the global market. The technical analysis in the global market during the forecasted period is mentioned. The impact of the COVID 19 on the global market is mentioned. The future growth rate in the packaged water treatment system market during the review period is estimated and mentioned.
Report Attribute/Metric | Details |
---|---|
Market Size | 2030: Significant Value |
CAGR | 9.41% CAGR (2022-2030) |
Base Year | 2021 |
Forecast Period | 2022-2030 |
Historical Data | 2019 & 2020 |
Forecast Units | Value (USD Million) |
Report Coverage | Revenue Forecast, Competitive Landscape, Growth Factors, and Trends |
Segments Covered | Type, Application |
Geographies Covered | North America, Europe, Asia-Pacific, and Rest of the World (RoW) |
Key Vendors | GE Water & Process Technologies (U.S.), WPL Limited (U.K.), Veolia Water Technologies (France), RWL Water (U.S.), WesTech Engineering, Inc. (U.S.), Smith & Loveless Inc. (U.S.), Napier Reid (Canada), Enviroquip (U.S.), Corix Water System (Canada), Tonka Equipment Company (U.S.) |
Key Market Opportunities | Growth In Emerging Market |
Key Market Drivers |
|
Frequently Asked Questions (FAQ) :
The packaged water treatment system market can thrive at 9.41% CAGR by 2023.
On conclusion of forecast period, the packaged water treatment system market can achieve a sizable valuation.
Corix Water System (Canada), Enviroquip (U.S.), and Tonka Equipment Company (U.S.) are some noteworthy companies in the packaged water treatment system market.
MBR 29, MBBR, Extended Aeration 29, Reverse Osmosis, and SBR are types of packaged water treatment systems
North America packaged water treatment system market poised to achieve considerable value due to surge in reverse osmosis utility.