ID: MRFR/IA - E/1926-CR | April 2017 | Region: Global | 68 Pages
1 Executive Summary
2 Research Methodology
2.1 Scope Of The Study
2.1.1 Definition
2.1.2 Research Objective
2.1.3 Assumptions
2.1.4 Limitations
2.2 Research Process
2.2.1 Primary Research
2.2.2 Secondary Research
2.3 Market Size Estimation
2.4 Forecast Model
3 Market Dynamics
3.1 Market Drivers
3.2 Market Inhibitors
3.3 Supply/Value Chain Analysis
3.4 Porterβs Five Forces Analysis
4 Americas Packaged Water Treatment System Market, By Type
4.1 Introduction
4.2 Extended Aeration
4.3 MBR
4.4 MBBR
4.5 SBR
4.6 Reverse Osmosis
4.7 Others
5 Americas Packaged Water Treatment System Market, By Application
5.1 Introduction
5.2 Municipal
5.3 Industrial
5.4 Others
6 Regional Market Analysis
6.1 Introduction
6.2 North America
6.2.1 U.S.
6.2.2 Canada
6.2.3 Mexico
6.3 Latin America
6.3.1 Brazil
6.3.2 Argentina
6.3.3 Venezuela
6.3.4 Chile
7 Competitive Analysis
7.1 Introduction
7.2 Competitive Scenario
7.2.1 Market Share Analysis
7.2.2 Market Development Analysis
7.2.3 Type/Service Benchmarking
7.3 GE Water & Process Technologies (U.S.)
7.3.1 Overview
7.3.2 Type/Service Offering
7.3.3 Strategy
7.4 RWL Water (U.S.)
7.4.1 Overview
7.4.2 Type/Service Offering
7.4.3 Strategy
7.5 WesTech Engineering Inc. (U.S.)
7.5.1 Overview
7.5.2 Type/Service Offering
7.5.3 Strategy
7.6 Smith & Loveless Inc. (U.S.)
7.6.1 Overview
7.6.2 Type/Service Offering
7.6.3 Strategy
7.7 Napier-Reid Ltd. (Canada)
7.7.1 Overview
7.7.2 Type/Service Offering
7.7.3 Strategy
7.8 Enviroquip (U.S.)
7.8.1 Overview
7.8.2 Type/Service Offering
7.8.3 Strategy
7.9 Corix Water System (Canada)
7.9.1 Overview
7.9.2 Type/Service Offering
7.9.3 Strategy
8 List Of Tables
TABLE 1 GLOBAL PACKAGED WATER TREATMENT SYSTEM MARKET, BY TYPE, 2020-2027 (USD MILLION) 29
TABLE 2 GLOBAL PACKAGED WATER TREATMENT SYSTEM MARKET, BY APPLICATION, 2020-2027 (USD MILLION) 33
TABLE 3 GLOBAL PACKAGED WATER TREATMENT SYSTEM MARKET, BY REGION, 2020-2027 (USD MILLION) 38
TABLE 4 NORTH AMERICA PACKAGED WATER TREATMENT SYSTEM MARKET, BY COUNTRY, 2020-2027 (USD MILLION) 39
TABLE 5 NORTH AMERICA PACKAGED WATER TREATMENT SYSTEM MARKET, BY TYPE 2020-2027 (USD MILLION) 40
TABLE 6 NORTH AMERICA PACKAGED WATER TREATMENT SYSTEM MARKET, BY APPLICATION 2020-2027 (USD MILLION) 40
TABLE 7 US PACKAGED WATER TREATMENT SYSTEM MARKET, BY TYPE 2020-2027 (USD MILLION) 41
TABLE 8 US PACKAGED WATER TREATMENT SYSTEM MARKET, BY APPLICATION 2020-2027 (USD MILLION) 42
TABLE 9 CANADA PACKAGED WATER TREATMENT SYSTEM MARKET, BY TYPE 2020-2027 (USD MILLION) 43
TABLE 10 CANADA PACKAGED WATER TREATMENT SYSTEM MARKET, BY APPLICATION 2020-2027 (USD MILLION) 43
TABLE 11 EUROPE PACKAGED WATER TREATMENT SYSTEM MARKET, BY COUNTRY 2020-2027 (USD MILLION) 45
TABLE 12 EUROPE PACKAGED WATER TREATMENT SYSTEM MARKET, BY TYPE 2020-2027 (USD MILLION) 46
TABLE 13 EUROPE PACKAGED WATER TREATMENT SYSTEM MARKET, BY APPLICATION 2020-2027 (USD MILLION) 46
TABLE 14 GERMANY PACKAGED WATER TREATMENT SYSTEM MARKET, BY TYPE 2020-2027 (USD MILLION) 47
TABLE 15 GERMANY PACKAGED WATER TREATMENT SYSTEM MARKET, BY APPLICATION 2020-2027 (USD MILLION) 48
TABLE 16 UK PACKAGED WATER TREATMENT SYSTEM MARKET, BY TYPE 2020-2027 (USD MILLION) 49
TABLE 17 UK PACKAGED WATER TREATMENT SYSTEM MARKET, BY APPLICATION 2020-2027 (USD MILLION) 49
TABLE 18 FRANCE PACKAGED WATER TREATMENT SYSTEM MARKET, BY TYPE 2020-2027 (USD MILLION) 50
TABLE 19 FRANCE PACKAGED WATER TREATMENT SYSTEM MARKET, BY APPLICATION 2020-2027 (USD MILLION) 51
TABLE 20 ITALY PACKAGED WATER TREATMENT SYSTEM MARKET, BY TYPE 2020-2027 (USD MILLION) 52
TABLE 21 ITALY PACKAGED WATER TREATMENT SYSTEM MARKET, BY APPLICATION 2020-2027 (USD MILLION) 53
TABLE 22 REST OF EUROPE PACKAGED WATER TREATMENT SYSTEM MARKET, BY TYPE 2020-2027 (USD MILLION) 53
TABLE 23 REST OF EUROPE PACKAGED WATER TREATMENT SYSTEM MARKET, BY APPLICATION 2020-2027 (USD MILLION) 54
TABLE 24 ASIA-PACIFIC PACKAGED WATER TREATMENT SYSTEM MARKET, BY COUNTRY 2020-2027 (USD MILLION) 56
TABLE 25 ASIA-PACIFIC PACKAGED WATER TREATMENT SYSTEM MARKET, BY TYPE 2020-2027 (USD MILLION) 56
TABLE 26 ASIA-PACIFIC PACKAGED WATER TREATMENT SYSTEM MARKET, BY APPLICATION 2020-2027 (USD MILLION) 57
TABLE 27 CHINA PACKAGED WATER TREATMENT SYSTEM MARKET, BY TYPE 2020-2027 (USD MILLION) 58
TABLE 28 CHINA PACKAGED WATER TREATMENT SYSTEM MARKET, BY APPLICATION 2020-2027 (USD MILLION) 58
TABLE 29 JAPAN PACKAGED WATER TREATMENT SYSTEM MARKET, BY TYPE 2020-2027 (USD MILLION) 59
TABLE 30 JAPAN PACKAGED WATER TREATMENT SYSTEM MARKET, BY APPLICATION 2020-2027 (USD MILLION) 60
TABLE 31 INDIA PACKAGED WATER TREATMENT SYSTEM MARKET, BY TYPE 2020-2027 (USD MILLION) 61
TABLE 32 INDIA PACKAGED WATER TREATMENT SYSTEM MARKET, BY APPLICATION 2020-2027 (USD MILLION) 61
TABLE 33 REST OF ASIA-PACIFIC PACKAGED WATER TREATMENT SYSTEM MARKET, BY TYPE 2020-2027 (USD MILLION) 62
TABLE 34 REST OF ASIA-PACIFIC PACKAGED WATER TREATMENT SYSTEM MARKET, BY APPLICATION 2020-2027 (USD MILLION) 62
TABLE 35 MIDDLE EAST & AFRICA PACKAGED WATER TREATMENT SYSTEM MARKET, BY COUNTRY 2020-2027 (USD MILLION) 64
TABLE 36 MIDDLE EAST & AFRICA PACKAGED WATER TREATMENT SYSTEM MARKET, BY TYPE 2020-2027 (USD MILLION) 64
TABLE 37 MIDDLE EAST & AFRICA PACKAGED WATER TREATMENT SYSTEM MARKET, BY APPLICATION 2020-2027 (USD MILLION) 65
TABLE 38 UAE PACKAGED WATER TREATMENT SYSTEM MARKET, BY TYPE 2020-2027 (USD MILLION) 65
TABLE 39 UAE PACKAGED WATER TREATMENT SYSTEM MARKET, BY APPLICATION 2020-2027 (USD MILLION) 66
TABLE 40 SAUDI ARABIA PACKAGED WATER TREATMENT SYSTEM MARKET, BY TYPE 2020-2027 (USD MILLION) 66
TABLE 41 SAUDI ARABIA PACKAGED WATER TREATMENT SYSTEM MARKET, BY APPLICATION 2020-2027 (USD MILLION) 67
TABLE 42 SOUTH AFRICA PACKAGED WATER TREATMENT SYSTEM MARKET, BY TYPE 2020-2027 (USD MILLION) 67
TABLE 43 SOUTH AFRICA PACKAGED WATER TREATMENT SYSTEM MARKET, BY APPLICATION 2020-2027 (USD MILLION) 68
TABLE 44 REST OF MIDDLE EAST & AFRICA PACKAGED WATER TREATMENT SYSTEM MARKET, BY TYPE 2020-2027 (USD MILLION) 68
TABLE 45 REST OF MIDDLE EAST & AFRICA PACKAGED WATER TREATMENT SYSTEM MARKET, BY APPLICATION 2020-2027 (USD MILLION) 69
TABLE 46 LATIN AMERICA PACKAGED WATER TREATMENT SYSTEM MARKET, BY TYPE 2020-2027 (USD MILLION) 70
TABLE 47 LATIN AMERICA PACKAGED WATER TREATMENT SYSTEM MARKET, BY APPLICATION 2020-2027 (USD MILLION) 71
9 List Of Figures
FIGURE 1 RESEARCH PROCESS OF MRFR 15
FIGURE 2 TOP DOWN & BOTTOM UP APPROACH 17
FIGURE 3 DRIVERS & RESTRAINTS IMPACT ANALYSIS OF PACKAGED WATER TREATMENT SYSTEM 19
FIGURE 4 WORLD: INDUSTRY, VALUE ADDED (ANNUAL % GROWTH), 2012-2020 20
FIGURE 5 GLOBAL: URBAN POPULATION, 2012-2020 (USD BILLION) 21
FIGURE 6 PORTER'S 5 FORCES ANALYSIS 23
FIGURE 7 VALUE CHAIN ANALYSIS 25
FIGURE 8 GLOBAL PACKAGED WATER TREATMENT SYSTEM MARKET, BY TYPE, 2020-2027 (USD MILLION) 28
FIGURE 9 GLOBAL PACKAGED WATER TREATMENT SYSTEM MARKET, BY APPLICATION, 2020-2027 (USD MILLION) 32
FIGURE 10 GLOBAL PACKAGED WATER TREATMENT SYSTEM MARKET SHARE (%), 2020 36
FIGURE 11 GLOBAL PACKAGED WATER TREATMENT SYSTEM MARKET, BY REGION, 2020-2027 (USD MILLION) 37
FIGURE 12 NORTH AMERICA PACKAGED WATER TREATMENT SYSTEM MARKET SHARE (%), 2020 38
FIGURE 13 NORTH AMERICA PACKAGED WATER TREATMENT SYSTEM MARKET, BY COUNTRY, 2020-2027 (USD MILLION) 39
FIGURE 14 EUROPE PACKAGED WATER TREATMENT SYSTEM MARKET SHARE (%), 2020 44
FIGURE 15 EUROPE PACKAGED WATER TREATMENT SYSTEM MARKET, BY COUNTRY 2020-2027 (USD MILLION) 44
FIGURE 16 ASIA-PACIFIC PACKAGED WATER TREATMENT SYSTEM MARKET SHARE (%), 2020 55
FIGURE 17 ASIA-PACIFIC PACKAGED WATER TREATMENT SYSTEM MARKET, BY COUNTRY 2020-2027 (USD MILLION) 55
FIGURE 18 MIDDLE EAST & AFRICA PACKAGED WATER TREATMENT SYSTEM MARKET SHARE (%), 2020 63
FIGURE 19 MIDDLE EAST & AFRICA PACKAGED WATER TREATMENT SYSTEM MARKET, BY COUNTRY 2020-2027 (USD MILLION) 63
FIGURE 20 GROWTH STRATEGIES ADOPTED BY KEY PLAYERS IN GLOBAL PACKAGED WATER TREATMENT SYSTEM, 2020-2027, (%) 72
FIGURE 21 EXPANSION: % SHARE BY KEY PLAYERS, 2020-2027, (%) 73
FIGURE 22 NEW PRODUCT DEVELOPMENT: % SHARE BY KEY PLAYERS, 2020-2027,(%) 74
FIGURE 23 GE WATER & PROCESS TECHNOLOGIES: TOTAL REVENUE VS SEGMENTAL REVENUE 76
FIGURE 24 GE WATER & PROCESS TECHNOLOGIES: GEOGRAPHICAL REVENUE MIX (2020) 76
FIGURE 25 GE WATER & PROCESS TECHNOLOGIES: KEY DEVELOPMENTS, 2020-2027 (IN %) 77
FIGURE 26 SWOT ANALYSIS 78
FIGURE 27 WPL LIMITED: KEY DEVELOPMENTS (%) 80
FIGURE 28 VEOLIA WATER TECHNOLOGIES: TOTAL REVENUE VS SEGMENTAL REVENUE 82
FIGURE 29 VEOLIA WATER TECHNOLOGIES: GEOGRAPHICAL REVENUE MIX (2020) 83
FIGURE 30 VEOLIA WATER TECHNOLOGY: KEY DEVELOPMENTS, 2020-2027 (IN %) 84
FIGURE 31 SWOT ANALYSIS 84
FIGURE 32 RWL WATER: KEY DEVELOPMENTS, 2020-2027 (IN %) 86
FIGURE 33 SWOT ANALYSIS 86
FIGURE 34 SWOT ANALYSIS 90
FIGURE 35 TONKA EQUIPMENT COMPANY: KEY DEVELOPMENTS, 2020-2027 (IN %) 96
$9 Billion
9.60%
North America
2022-2030
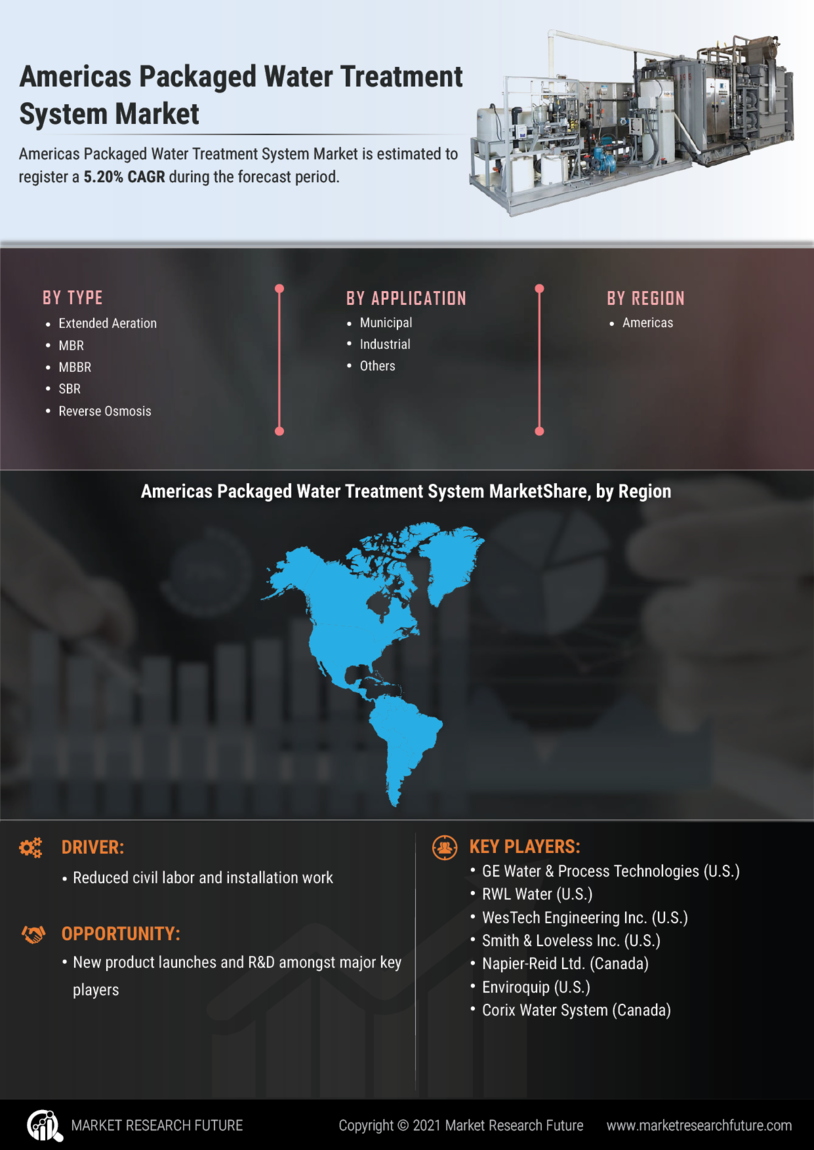
The Americas packaged water treatment system market is expected to boost at a CAGR of 9.60% with a value of USD 9.22 billion during the projected 2022-2030.
Water treatment System is carried out to decrease the TSS levels as per the end-user requirement and hence differ depending on the factors such as TSS level, location and application; removal of the suspended solids and microorganisms is done by the differentiating the chemical, physical and biological properties of the water and its constituents. The water treatment equipment is chosen based on the properties of the constituents such as density, quantity, chemical reactivity, boiling point, solubility, melting point, volatility, the purity level of water and similar others, and this was due to increasing consumption of the water, strict government regulations regarding the TSS level, and rising the industrialization across the world. Furthermore, the higher cost of the equipment is expected to restrain the market's growth during the analysis forecasting years.
Packaged wastewater treatment plants refers to treating sewage or industrial wastewater using a pre-engineered and self-contained facility. It involves the removal of the coarse solids and grit using the large fitting screens, followed by the skimming of organic and inorganic sediments found in the oil. The grease and light solids. In the following steps, secondary or biological sludge is formed by mixing the deposits separated from the water to remove any remaining microorganisms.
GE Water & Process Technologies (U.S.), RWL Water (U.S.), WesTech Engineering Inc. (U.S.), Smith & Loveless Inc. (U.S.), Napier-Reid Ltd. (Canada), Enviroquip (U.S.) and Corix Water System (Canada) are some of the leading players operating in this market.
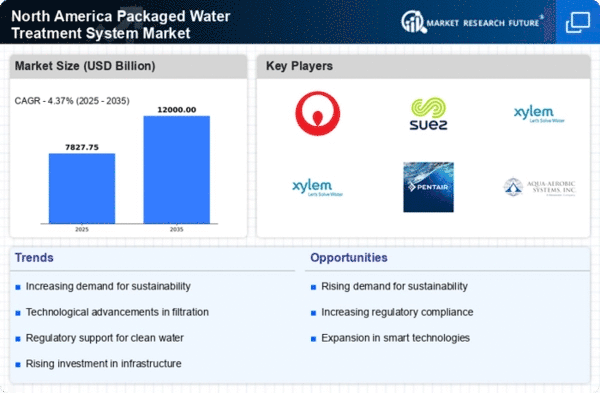
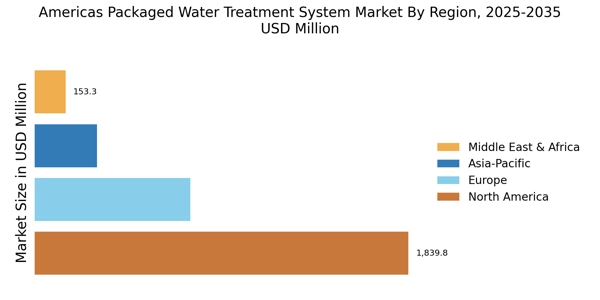
North America is leading the market for packaged water treatment system market with share of 73.52% in 2015. The region is expected to grow at 5.20% CAGR during the forecast period. Factors such as increasing demand from the oil & gas industry and scarcity of clean water is driving the market in the region. While, Latin America is projected to grow at 2.90% CAGR during the forecast period.
The packaged water treatment systems market are basically pre-assembled, skid mounted and factory tested systems with fewer requirements for installation and reduced on-site construction cost. These are used to store ample amount of water and can be easily transported to the required site. The packaged water treatment system is highly recommended for residential complexes and industries.
Product Analysis
Additional Information
Geographic Analysis
Company Information
The report for Americas Packaged Water Treatment System Market of Market Research Future comprises of extensive primary research along with the detailed analysis of qualitative as well as quantitative aspects by various industry experts, key opinion leaders to gain the deeper insight of the market and industry performance. The report gives the clear picture of current market scenario which includes historical and projected market size in terms of value and volume, technological advancement, macro economical and governing factors in the market. The report provides details information and strategies of the top key players in the industry. The report also gives a broad study of the different market segments and regions.
Report Attribute/Metric | Details |
---|---|
Market Size |
|
CAGR | 9.60% CAGR (2020-2030) |
Base Year | 2021 |
Forecast Period | 2020-2030 |
Historical Data | 2019 & 2020 |
Forecast Units | Value (USD Million) |
Report Coverage | Revenue Forecast, Competitive Landscape, Growth Factors, and Trends |
Segments Covered | Type and Application |
Geographies Covered | North America, Europe, Asia-Pacific, and Rest of the World (RoW) |
Key Vendors | GE Water & Process Technologies (U.S.), RWL Water (U.S.), WesTech Engineering Inc. (U.S.), Smith & Loveless Inc. (U.S.), Napier-Reid Ltd. (Canada), Enviroquip (U.S.) and Corix Water System (Canada) |
Key Market Opportunities | New product launches and R&D amongst major key players |
Key Market Drivers | Reduced civil labor and installation work |
Frequently Asked Questions (FAQ) :
The market growth rate in the years ahead can be approximately 9.60%.
The global market can accrue a valuation of USD 3577.7 million by the end of the review period.
Napier-Reid Ltd. (Canada), Enviroquip (U.S.), GE Water & Process Technologies (U.S.), WesTech Engineering Inc. (U.S.), Smith & Loveless Inc. (U.S.), RWL Water (U.S.), Corix Water System (Canada), are the notable companies in the global market.
Depending on the type, extended aeration segment is leading the market.
Rising urbanization as well as compact size of the packaged water treatment system makes municipal the leading application segment in the market.
North America holds the largest share of 73.52% in the market.
Latin America can attain a growth rate of 2.90% during the forecast timeframe.