ID: MRFR/HC/6356-HCR | February 2021 | Region: Global | 85 pages
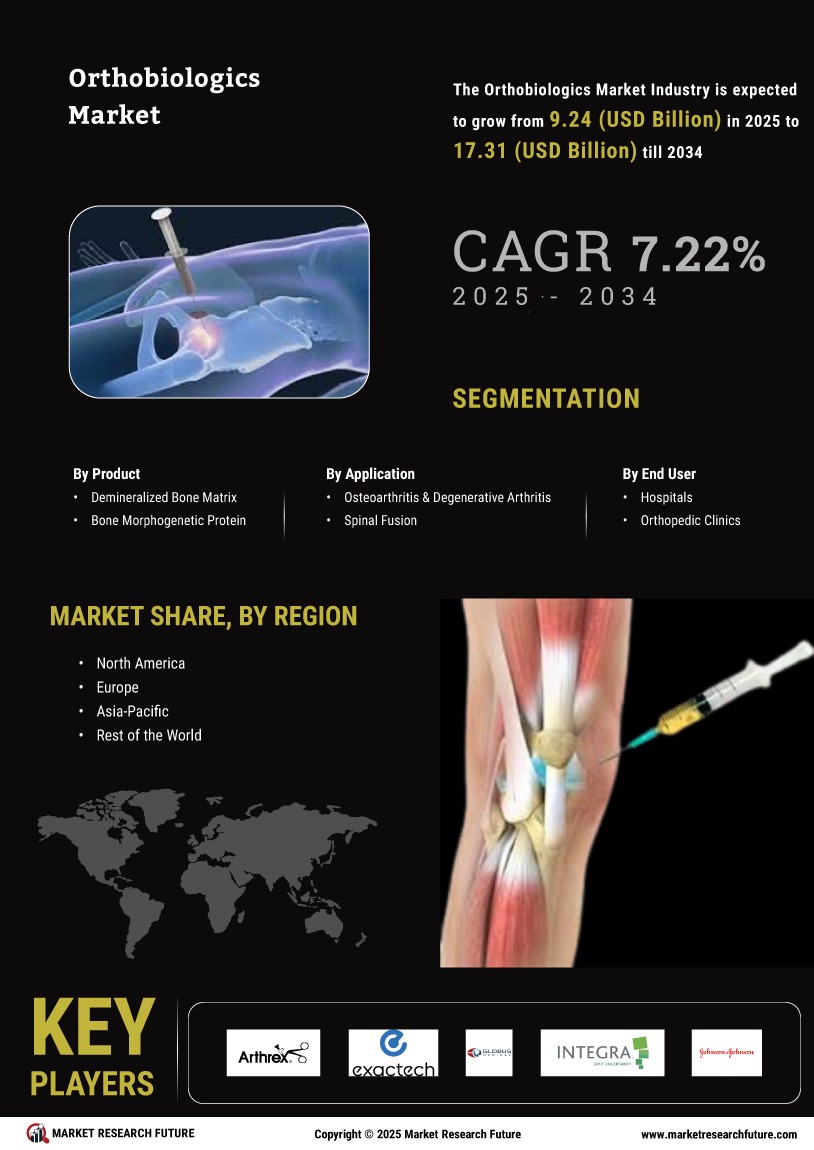
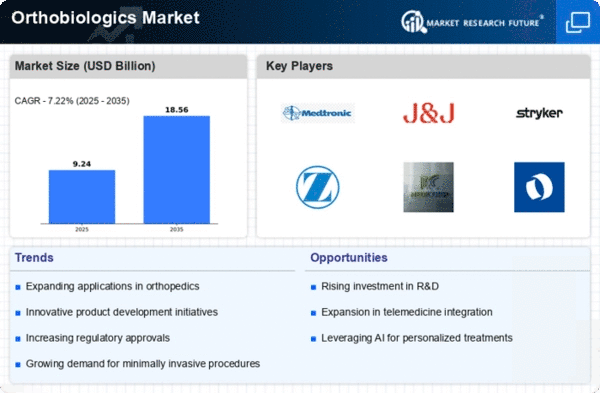
The Global Orthobiologics Market is accounted for USD 4,964 million in 2019 and expected to register 5.6% CAGR during the forecast period (2019–2024).
Orthobiologics are substances that are used by orthopedic surgeons to heal injuries more quickly. The orthobiologics are used to improve the tendons, ligaments, healing of broken bones and injured muscles. Also, these products are derived from substances that are naturally found in the body. When they are used in higher concentrations, orthobiologic substances help speed up the healing process.
The increasing cases of trauma and sports injury, demand for biologics in minimally invasive procedures, approval of products, and raising awareness are expected to drive the growth of the global orthobiologics market during the forecast period. Moreover, emerging technological innovations in biomaterials, rising obese and geriatric population, and rising research and development activities by top players such as mergers, expansion, and collaboration for the development of new products and launches by major players are also boosting the growth of the market. For instance, according to the data provided by U.S. Department of Commerce, in 2015, the total population above the age 60 was around 902.28 million, whereas, in 2018, the total population above the age of 60 are around 991.24 million. The population above 60’s year are growing with a rate of 3.18% per years.
However, less reimbursement policy may hamper the growth of the market during the assessment period.
The global orthobiologics market has been segmented on the basis of product, application, end-user, and region.
On the basis of product, the market has been classified as a Demineralized bone matrix (DBM), Bone morphogenetic protein (BPM), Allograft, Viscosupplementation products, Synthetic bone substitutes, and Others.
Based on application, the market has been divided into Osteoarthritis & degenerative arthritis, Spinal fusion, Fracture recovery, Soft tissue injuries, and Others. By application spinal fusion segment dominant, the market in 2018 due to increasing sports-related injuries, the prevalence of spine and traumatic injuries, and accidents.
By end user, the market has been segmented into Hospitals, Orthopedic Clinics, and Others.
The market has been segmented, by region, into the Americas, Europe, Asia-Pacific, and the Middle East & Africa. The orthobiologics market in the Americas has further been segmented into North America and South America, with the North American market divided into the US and Canada.
The European orthobiologics market has been segmented into Western Europe and Eastern Europe. Western Europe has been sub-segmented into Germany, France, the UK, Italy, Spain, and the rest of Western Europe.
The orthobiologics market in Asia-Pacific has been divided into Japan, China, India, South Korea, Australia, and the rest of Asia-Pacific. The orthobiologics market in the Middle East & Africa has been segmented into the Middle East and Africa.
Source: MRFR Analysis
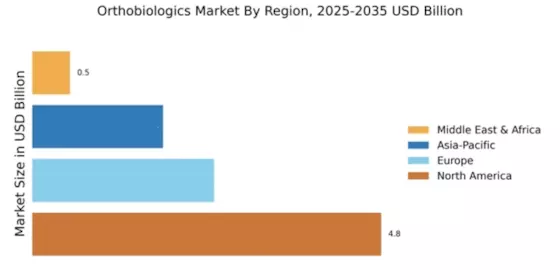
Americas is likely to dominate the orthobiologics market during the forecast period owing to the advanced technologies, increasing funding & investments by major players, and rising prevalence of sports-related injuries & injuries caused due to falls and accidents. For instance, according to the report published by the American Orthopaedic Society for Sports Medicine in 2017, around 3.5 million kids below age 14 obtain medical treatment for sports injuries each year.
The European are likely to be the second-largest market in the global orthobiologics market owing to the rising geriatric population, government funding and support of the healthcare sector coupled with increasing research and development, and rising awareness.
The Asia-Pacific market is expected to hold a significant share in the orthobiologics market. The market growth in this region can be attributed to the rise in demand for advanced treatment, awareness of orthobiologics, and rising investments in healthcare. Also, countries such as India and China are considering the fastest growing region due to a government focused toward adopting advance treatment from a developed country.
The market in the Middle East & Africa is expected to account for the smallest share of the global orthobiologics market due to an underdeveloped healthcare sector, lack of technical knowledge, and poor medical facilities.
Some of the key players in the global orthobiologics market are Arthrex, Inc., Exactech, Inc., Globus Medical Inc., Integra LifeSciences, Johnson & Johnson, Medline Industries, Inc., NuVasive, Inc., Stryker Corporation, Wright Medical Group N.V., Zimmer Biomet, and Others
Company Profiles
Intended Audience
Frequently Asked Questions (FAQ) :
Orthobiologics market was valued at USD 4.9 billion in 2019.
Orthobiologics market is expected to exhibit a strong 5.6% CAGR over the forecast period from 2019 to 2024.
The increasing demand for effective trauma healing agents for sports and muscle injuries is the major driver for the orthobiologics market.
The Americas is the leading regional market for orthobiologics.
Leading players in the orthobiologics market include Exactech, Arthrex, Globus Medical, Wright Medical Group, and Integra LifeSciences, among others.
Table of Contents:
Chapter 1. Report Prologue
Chapter 2. Market Introduction
2.1. Definition
2.2. Scope of the Study
2.2.1. Research Objective
2.2.2. Assumptions
2.2.3. Limitations
Chapter 3. Research Methodology
3.1. Introduction
3.2. Primary Research
3.3. Secondary Research
3.4. Market Size Estimation
Chapter 4. Market Dynamics
4.1. Drivers
4.2. Restraints
4.3. Opportunities
4.4. Challenges
4.5. Macroeconomic Indicators
Chapter 5. Market Factor Analysis
5.1. Porter’s Five Forces Analysis
5.1.1. Bargaining Power of Suppliers
5.1.2. Bargaining Power of Buyers
5.1.3. Threat of New Entrants
5.1.4. Threat of Substitutes
5.1.5. Intensity of Rivalry
5.2. Value Chain Analysis
5.3. Investment Feasibility Analysis
Chapter 6. Global Orthobiologics Market, by Product
6.1. Introduction
6.2. Demineralized bone matrix (DBM)
Market Estimates & Forecast, by Region, 2020–2027
Market Estimates & Forecast, by Country, 2020–2027
6.3. Bone morphogenetic protein (BPM)
Market Estimates & Forecast, by Region, 2020–2027
Market Estimates & Forecast, by Country, 2020–2027
6.4. Allograft
Market Estimates & Forecast, by Region, 2020–2027
Market Estimates & Forecast, by Country, 2020–2027
6.5. Viscosupplementation products
Market Estimates & Forecast, by Region, 2020–2027
Market Estimates & Forecast, by Country, 2020–2027
6.6. Synthetic bone substitutes
Market Estimates & Forecast, by Region, 2020–2027
Market Estimates & Forecast, by Country, 2020–2027
6.7. Others
Chapter 7. Global Orthobiologics Market, by Application
7.1. Introduction
7.2. Osteoarthritis & degenerative arthritis
Market Estimates & Forecast, by Region, 2020–2027
Market Estimates & Forecast, by Country, 2020–2027
7.3. Spinal fusion
Market Estimates & Forecast, by Region, 2020–2027
Market Estimates & Forecast, by Country, 2020–2027
7.4. Fracture recovery
Market Estimates & Forecast, by Region, 2020–2027
Market Estimates & Forecast, by Country, 2020–2027
7.5. Soft tissue injuries
Market Estimates & Forecast, by Region, 2020–2027
Market Estimates & Forecast, by Country, 2020–2027
7.6. Others
Chapter 8. Global Orthobiologics Market, by End User
8.1. Introduction
8.2. Hospitals
Market Estimates & Forecast, by Region, 2020–2027
Market Estimates & Forecast, by Country, 2020–2027
8.3. Orthopedic Clinics
Market Estimates & Forecast, by Region, 2020–2027
Market Estimates & Forecast, by Country, 2020–2027
8.4. Others
Chapter 9. Global Orthobiologics Market, by Region
9.1. Introduction
9.2. Americas
9.2.1. North America
9.2.1.1. US
9.2.1.2. Canada
9.2.2. Latin America
9.3. Europe
9.3.1. Western Europe
9.3.1.1. Germany
9.3.1.2. France
9.3.1.3. Italy
9.3.1.4. Spain
9.3.1.5. UK
9.3.1.6. Rest of Western Europe
9.3.2. Eastern Europe
9.4. Asia-Pacific
9.4.1. Japan
9.4.2. China
9.4.3. India
9.4.4. Australia
9.4.5. South Korea
9.4.6. Rest of Asia-Pacific
9.5. Middle East & Africa
9.5.1. Middle East
9.5.2. Africa
Chapter 10. Company Landscape
10.1. Introduction
10.2. Market Share Analysis
10.3. Key Developments & Strategies
Chapter 11. Company Profiles
11.1. Arthrex, Inc.
11.1.1. Company Overview
11.1.2. Product Overview
11.1.3. Financial Overview
11.1.4. Key Developments
11.1.5. SWOT Analysis
11.1.6. Key Strategies
11.2. Exactech, Inc.
11.2.1. Company Overview
11.2.2. Product Overview
11.2.3. Financial Overview
11.2.4. Key Developments
11.2.5. SWOT Analysis
11.2.6. Key Strategies
11.3. Globus Medical Inc
11.3.1. Company Overview
11.3.2. Product Overview
11.3.3. Financial Overview
11.3.4. Key Developments
11.3.5. SWOT Analysis
11.3.6. Key Strategies
11.4. Integra LifeSciences
11.4.1. Company Overview
11.4.2. Product Overview
11.4.3. Financial Overview
11.4.4. Key Developments
11.4.5. SWOT Analysis
11.4.6. Key Strategies
11.5. Johnson & Johnson
11.5.1. Company Overview
11.5.2. Product Overview
11.5.3. Financial Overview
11.5.4. Key Developments
11.5.5. SWOT Analysis
11.5.6. Key Strategies
11.6. Medline Industries, Inc
11.6.1. Company Overview
11.6.2. Product Overview
11.6.3. Financial Overview
11.6.4. Key Developments
11.6.5. SWOT Analysis
11.6.6. Key Strategies
11.7. NuVasive, Inc.
11.7.1. Company Overview
11.7.2. Product Overview
11.7.3. Financial Overview
11.7.4. Key Developments
11.7.5. SWOT Analysis
11.7.6. Key Strategies
11.8. Stryker Corporation
11.8.1. Company Overview
11.8.2. Product Overview
11.8.3. Financial Overview
11.8.4. Key Developments
11.8.5. SWOT Analysis
11.8.6. Key Strategies
11.9. Wright Medical Group N.V.
11.9.1. Company Overview
11.9.2. Product Overview
11.9.3. Financial Overview
11.9.4. Key Developments
11.9.5. SWOT Analysis
11.9.6. Key Strategies
11.10. Zimmer Biomet
11.10.1. Company Overview
11.10.2. Product Overview
11.10.3. Financial Overview
11.10.4. Key Developments
11.10.5. SWOT Analysis
11.10.6. Key Strategies
11.11. Others
Chapter 12. MRFR Conclusion
12.1. Key Findings
12.1.1. From CEO’s Viewpoint
12.1.2. Unmet Needs of the Market
12.2. Key Companies to Watch
12.3. Predictions for the Orthobiologics Industry
Chapter 13. Appendix
LIST OF TABLES
Table 1. Global Orthobiologics Market Synopsis, 2020–2027
Table 2. Global Orthobiologics Market Estimates and Forecast, 2020–2027 (USD Million)
Table 3. Global Orthobiologics Market, by Region, 2020–2027 (USD Million)
Table 4. Global Orthobiologics Market, by Product, 2020–2027 (USD Million)
Table 5. Global Orthobiologics Market, by Application, 2020–2027 (USD Million)
Table 6. Global Orthobiologics Market, by End User, 2020–2027 (USD Million)
Table 7. North America: Orthobiologics Market, by Product, 2020–2027 (USD Million)
Table 8. North America: Orthobiologics Market, by Application, 2020–2027 (USD Million)
Table 9. North America: Orthobiologics Market, by End User, 2020–2027 (USD Million)
Table 10. US: Orthobiologics Market, by Product, 2020–2027 (USD Million)
Table 11. US: Orthobiologics Market, by Application, 2020–2027 (USD Million)
Table 12. US: Orthobiologics Market, by End User, 2020–2027 (USD Million)
Table 13. Canada: Orthobiologics Market, by Product, 2020–2027 (USD Million)
Table 14. Canada: Orthobiologics Market, by Application, 2020–2027 (USD Million)
Table 15. Canada: Orthobiologics Market, by End User, 2020–2027 (USD Million)
Table 16. Latin America: Orthobiologics Market, by Product, 2020–2027 (USD Million)
Table 17. Latin America: Orthobiologics Market, by Application, 2020–2027 (USD Million)
Table 18. Latin America: Orthobiologics Market, by End User, 2020–2027 (USD Million)
Table 19. Europe: Orthobiologics Market, by Product, 2020–2027 (USD Million)
Table 20. Europe: Orthobiologics Market, by Application, 2020–2027 (USD Million)
Table 21. Europe: Orthobiologics Market, by End User, 2020–2027 (USD Million)
Table 22. Western Europe: Orthobiologics Market, by Product, 2020–2027 (USD Million)
Table 23. Western Europe: Orthobiologics Market, by Application, 2020–2027 (USD Million)
Table 24. Western Europe: Orthobiologics Market, by End User, 2020–2027 (USD Million)
Table 25. Eastern Europe: Orthobiologics Market, by Product, 2020–2027 (USD Million)
Table 26. Eastern Europe: Orthobiologics Market, by Application, 2020–2027 (USD Million)
Table 27. Eastern Europe: Orthobiologics Market, by End User, 2020–2027 (USD Million)
Table 28. Asia-Pacific: Orthobiologics Market, by Product, 2020–2027 (USD Million)
Table 29. Asia-Pacific: Orthobiologics Market, by Application, 2020–2027 (USD Million)
Table 30. Asia-Pacific: Orthobiologics Market, by End User, 2020–2027 (USD Million)
Table 31. Middle East & Africa: Orthobiologics Market, by Product, 2020–2027 (USD Million)
Table 32. Middle East & Africa: Orthobiologics Market, by Application, 2020–2027 (USD Million)
Table 33. Middle East & Africa: Orthobiologics Market, by End User, 2020–2027 (USD Million)
LIST OF FIGURES
Figure 1. Research Process
Figure 2. Segmentation for Global Orthobiologics Market
Figure 3. Segmentation Market Dynamics for Global Orthobiologics Market
Figure 4. Global Orthobiologics Market Share, by Product, 2020
Figure 5. Global Orthobiologics Market Share, by Application, 2020
Figure 6. Global Orthobiologics Market Share, by End User, 2020
Figure 7. Global Orthobiologics Market Share, by Region, 2020
Figure 8. North America: Orthobiologics Market Share, by Country, 2020
Figure 9. Europe: Orthobiologics Market Share, by Country, 2020
Figure 10. Asia-Pacific: Orthobiologics Market Share, by Country, 2020
Figure 11. Middle East & Africa: Orthobiologics Market Share, by Country, 2020
Figure 12. Global Orthobiologics Market: Company Share Analysis, 2020 (%)
Figure 13. Arthrex, Inc.: Key Financials
Figure 14. Arthrex, Inc.: Segmental Revenue
Figure 15. Arthrex, Inc.: Geographical Revenue
Figure 16. Exactech, Inc.: Key Financials
Figure 17. Exactech, Inc.: Segmental Revenue
Figure 18. Exactech, Inc.: Geographical Revenue
Figure 19. Globus Medical Inc: Key Financials
Figure 20. Globus Medical Inc: Segmental Revenue
Figure 21. Globus Medical Inc: Geographical Revenue
Figure 22. Integra LifeSciences: Key Financials
Figure 23. Integra LifeSciences: Segmental Revenue
Figure 24. Integra LifeSciences: Geographical Revenue
Figure 25. Johnson & Johnson: Key Financials
Figure 26. Johnson & Johnson: Segmental Revenue
Figure 27. Johnson & Johnson: Geographical Revenue
Figure 28. Medline Industries, Inc: Key Financials
Figure 29. Medline Industries, Inc: Segmental Revenue
Figure 30. Medline Industries, Inc: Geographical Revenue
Figure 31. NuVasive, Inc.: Key Financials
Figure 32. NuVasive, Inc.: Segmental Revenue
Figure 33. NuVasive, Inc.: Geographical Revenue
Figure 34. Stryker Corporation: Key Financials
Figure 35. Stryker Corporation: Segmental Revenue
Figure 36. Stryker Corporation: Geographical Revenue
Figure 37. Wright Medical Group N.V.: Key Financials
Figure 38. Wright Medical Group N.V.: Segmental Revenue
Figure 39. Wright Medical Group N.V.: Geographical Revenue
Figure 40. Wright Medical Group N.V.: Key Financials
Figure 41. Wright Medical Group N.V.: Segmental Revenue
Figure 42. Wright Medical Group N.V.: Geographical Revenue
This table of content is tentative and subject to change as the research progresses.
Please Note: Financial details of company cannot be provided if the information of the company is not available in public domain and or reliable source.