ID: MRFR/HC/5765-HCR | February 2021 | Region: Global | 100 pages
Market Scenario
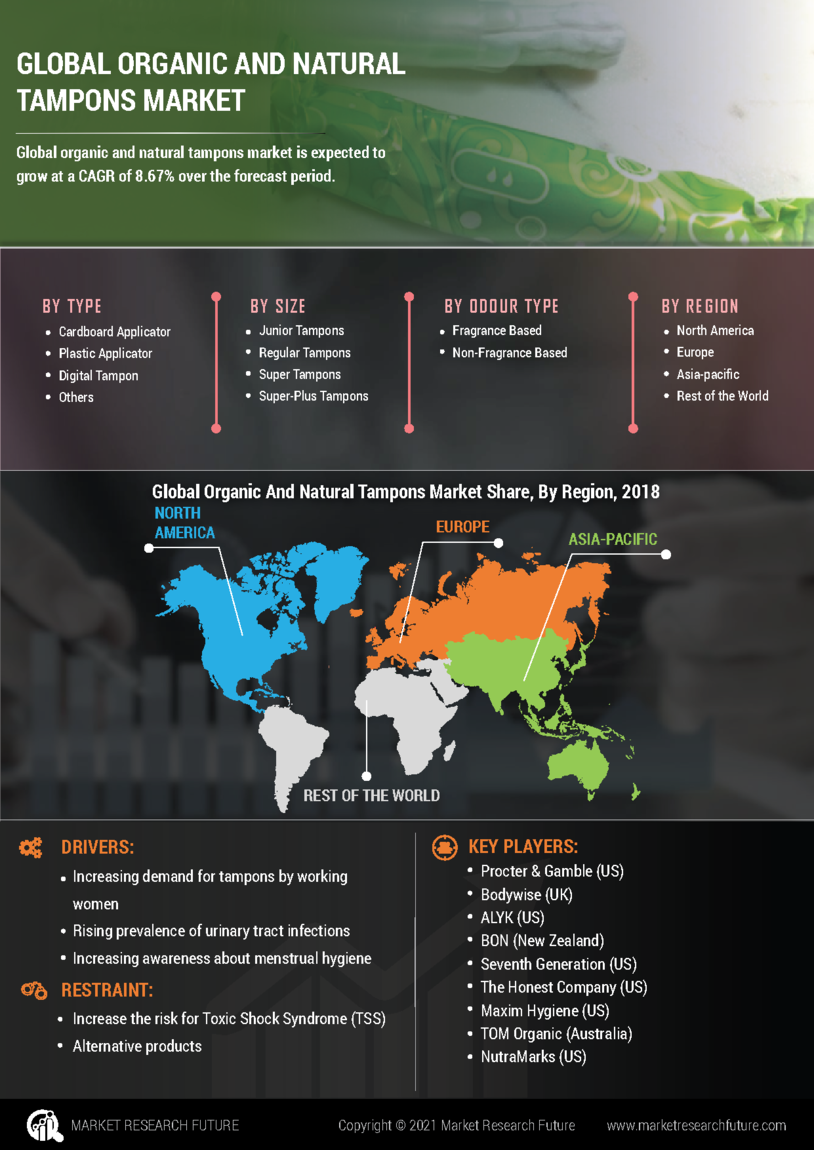
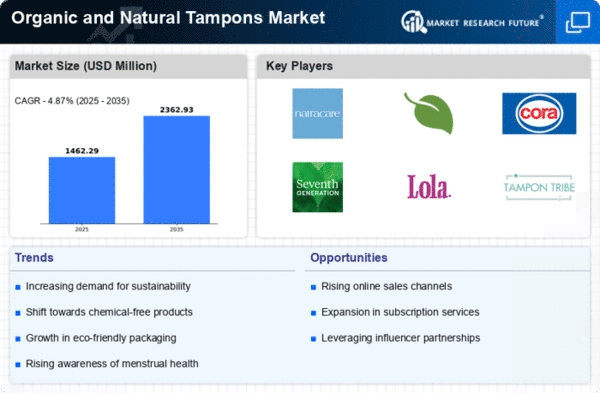
Global organic and natural tampons market is expected to grow significantly over the forecast period. It is anticipated that the market held value of USD 590.6 million in 2017 and is projected to grow at a CAGR of 8.67% over the forecast period. Tampon is used to manage menstrual flow and also it provides more comfort and physical freedom as compared to other menstrual hygiene products.
The factors such as increasing demand for tampons by working women, the rising prevalence of urinary tract infections, and increasing awareness about menstrual hygiene are expected to propel the growth of the market. However, increase the risk for Toxic Shock Syndrome (TSS) and availability of alternative products hamper the market growth over the forecast period.
Segmentation
The global organic and natural tampons market has been segmented into type, size, and odour type.
Based on type, organic and natural tampons market is segmented into cardboard applicator, plastic applicator, digital tampon, and others.
Based on size, organic and natural tampons market is segmented into junior tampons, regular tampons, super tampons, and super-plus tampons. The regular tampons segment is expected to account for the largest share segment of the market in 2017.
Based on odour type, organic and natural tampons market is segmented into fragrance based and non-fragrance based. The non-fragrance-based segment is expected to account for the largest share segment of the market in 2017.
The organic and natural tampons market segmented, by region, into the Americas, Europe, Asia-Pacific, and the Middle East & Africa. The organic and natural tampons market in the Americas further segmented into North America and South America, with the North American market divided into the US and Canada.
The European organic and natural tampons market has been segmented into Western Europe and Eastern Europe. Western Europe has further been classified as Germany, France, the UK, Italy, Spain, and the rest of Western Europe.
The organic and natural tampons market in Asia-Pacific has been segmented into Japan, China, India, South Korea, Australia, and the rest of Asia-Pacific. The organic and natural tampons market in the Middle East & Africa segmented into the Middle East and Africa.
Key players
Procter & Gamble (US), Bodywise (UK), ALYK (US), BON (New Zealand), Seventh Generation (US), The Honest Company (US), Maxim Hygiene (US), TOM Organic (Australia), and NutraMarks (US) are some of the key players in the global organic and natural tampons market.
Regional Market Summary
Global Organic and Natural Tampons Market Share (%), by Region, 2017
Source: Annual Reports and Sec filings
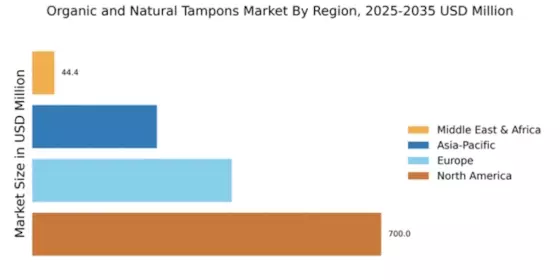
Geographically, the Americas is anticipated to dominate the global organic and natural tampons market owing to a well-established player, increasing demand for tampons by working women, and the rising prevalence of urinary tract infections.
Europe is expected to hold the second largest position in the global organic and natural tampons market. The market growth in this region is attributed to increasing awareness about menstrual hygiene.
The organic and natural tampons market in Asia-Pacific region consists of countries namely China, Japan, Republic of Korea, India, Australia and Rest of Asia-Pacific. The Asia-Pacific region is expected to be fastest growing region.
The Middle East & Africa has the least share of the Organic and Natural Tampons market.
Global Organic and Natural Tampons Market, by Type
Global Organic and Natural Tampons Market, by Size
Global Organic and Natural Tampons Market, by Odour Type
Global Organic and Natural Tampons Market, by Region
Global Organic and Natural Tampons, by Key Players
Intended Audience
Frequently Asked Questions (FAQ) :
Global Organic And Natural Tampons Market had a valuation of USD 590.6 million in 2017.
Organic And Natural Tampons Market can record a CAGR of 8.67% during the forecast period of 2018 to 2023.
Better alternative and chances of toxic shock syndrome (TSS) can hold back the Organic And Natural Tampons Market growth.
In 2017, the regular tampons segment was leading the Organic And Natural Tampons Market.
In 2017, the non-fragrance segment was leading the Organic And Natural Tampons Market.
Table of Contents:
Chapter 1. Report Prologue
Chapter 2. Market Introduction
2.1. Definition
2.2. Scope of the Study
2.2.1. Research Objective
2.2.2. Assumptions
2.2.3. Limitations
Chapter 3. Research Methodology
3.1. Introduction
3.2. Primary Research
3.3. Secondary Research
3.4. Market Size Estimation
Chapter 4. Market Dynamics
4.1. Drivers
4.2. Restraints
4.3. Opportunities
4.4. Challenges
4.5. Macroeconomic Indicators
4.6. Detection Technique Trends & Assessment
Chapter 5. Market Factor Analysis
5.1. Porter’s Five Forces Analysis
5.1.1. Bargaining Power of Suppliers
5.1.2. Bargaining Power of Buyers
5.1.3. Threat of New Entrants
5.1.4. Threat of Substitutes
5.1.5. Intensity of Rivalry
5.2. Value Chain Analysis
5.3. Investment Feasibility Analysis
5.4. Pricing Analysis
Chapter 6. Global Organic and Natural Tampons Market, by Type
6.1. Introduction
6.2. Cardboard Applicator
Market Estimates & Forecast, by Region, 2018–2023
Market Estimates & Forecast, by Country, 2018–2023
6.3. Plastic Applicator
Market Estimates & Forecast, by Region, 2018–2023
Market Estimates & Forecast, by Country, 2018–2023
6.4. Digital Tampon
Market Estimates & Forecast, by Region, 2018–2023
Market Estimates & Forecast, by Country, 2018–2023
6.5. Others
Market Estimates & Forecast, by Region, 2018–2023
Market Estimates & Forecast, by Country, 2018–2023
Chapter 7. Global Organic and Natural Tampons Market, by Size
7.1. Introduction
7.2. Junior Tampons
Market Estimates & Forecast, by Region, 2018–2023
Market Estimates & Forecast, by Country, 2018–2023
7.3. Regular Tampons
Market Estimates & Forecast, by Region, 2018–2023
Market Estimates & Forecast, by Country, 2018–2023
7.4. Super Tampons
Market Estimates & Forecast, by Region, 2018–2023
Market Estimates & Forecast, by Country, 2018–2023
7.5. Super-Plus Tampons
Market Estimates & Forecast, by Region, 2018–2023
Market Estimates & Forecast, by Country, 2018–2023
Chapter 8. Global Organic and Natural Tampons Market, by Odour Type
8.1. Introduction
8.2. Fragrance Based
Market Estimates & Forecast, by Region, 2018–2023
Market Estimates & Forecast, by Country, 2018–2023
8.3. Non-Fragrance Based
Market Estimates & Forecast, by Region, 2018–2023
Market Estimates & Forecast, by Country, 2018–2023
Chapter 9. Global Organic and Natural Tampons Market, by Region
9.1. Introduction
9.2. Americas
9.2.1. North America
9.2.1.1. US
9.2.1.2. Canada
9.2.2. South America
9.3. Europe
9.3.1. Western Europe
9.3.1.1. Germany
9.3.1.2. France
9.3.1.3. Italy
9.3.1.4. Spain
9.3.1.5. UK
9.3.1.6. Rest of Western Europe
9.3.2. Eastern Europe
9.4. Asia-Pacific
9.4.1. Japan
9.4.2. China
9.4.3. India
9.4.4. Australia
9.4.5. South Korea
9.4.6. Rest of Asia-Pacific
9.5. Middle East & Africa
9.5.1. Middle East
9.5.2. Africa
Chapter 10. Company Landscape
10.1. Introduction
10.2. Market Share Analysis
10.3. Key Developments & Strategies
Chapter 11. Company Profiles
11.1. Procter & Gamble
11.1.1. Company Overview
11.1.2. Type Overview
11.1.3. Financials Overview
11.1.4. Key Developments
11.1.5. SWOT Analysis
11.1.6. Key Strategies
11.2. Bodywise
11.2.1. Company Overview
11.2.2. Type Overview
11.2.3. Financials Overview
11.2.4. Key Developments
11.2.5. SWOT Analysis
11.2.6. Key Strategies
11.3. ALYK
11.3.1. Company Overview
11.3.2. Type Overview
11.3.3. Financials Overview
11.3.4. Key Developments
11.3.5. SWOT Analysis
11.3.6. Key Strategies
11.4. BON
11.4.1. Company Overview
11.4.2. Type Overview
11.4.3. Financials Overview
11.4.4. Key Developments
11.4.5. SWOT Analysis
11.4.6. Key Strategies
11.5. Seventh Generation
11.5.1. Company Overview
11.5.2. Type Overview
11.5.3. Financials Overview
11.5.4. Key Developments
11.5.5. SWOT Analysis
11.5.6. Key Strategies
11.6. The Honest Company
11.6.1. Company Overview
11.6.2. Type Overview
11.6.3. Financials Overview
11.6.4. Key Developments
11.6.5. SWOT Analysis
11.6.6. Key Strategies
11.7. Maxim Hygiene
11.7.1. Company Overview
11.7.2. Type Overview
11.7.3. Financials Overview
11.7.4. Key Developments
11.7.5. SWOT Analysis
11.7.6. Key Strategies
11.8. TOM Organic
11.8.1. Company Overview
11.8.2. Type Overview
11.8.3. Financials Overview
11.8.4. Key Developments
11.8.5. SWOT Analysis
11.8.6. Key Strategies
11.9. NutraMarks
11.9.1. Company Overview
11.9.2. Type Overview
11.9.3. Financials Overview
11.9.4. Key Developments
11.9.5. SWOT Analysis
11.9.6. Key Strategies
11.10. Others
Chapter 12. MRFR Conclusion
12.1. Key Findings
12.1.1. From CEO’s View point
12.1.2. Unmet Needs of the Market
12.2. Key Companies to Watch
12.3. Predictions for the Organic and Natural Tampons Industry
Chapter 13. Appendix
LIST OF TABLES
Table 1. Global Organic and Natural Tampons Market Synopsis, 2018–2023
Table 2. Global Organic and Natural Tampons Market Estimates and Forecast, 2018–2023 (USD Million)
Table 3. Global Organic and Natural Tampons Market, by Region, 2018–2023 (USD Million)
Table 4. Global Organic and Natural Tampons Market, by Type, 2018–2023 (USD Million)
Table 5. Global Organic and Natural Tampons Market, by Size, 2018–2023 (USD Million)
Table 6. Global Organic and Natural Tampons Market, by Odour Type, 2018–2023 (USD Million)
Table 7. North America: Organic and Natural Tampons Market, by Type, 2018–2023 (USD Million)
Table 8. North America: Organic and Natural Tampons Market, by Size, 2018–2023 (USD Million)
Table 9. North America: Organic and Natural Tampons Market, by Odour Type, 2018–2023 (USD Million)
Table 10. US: Organic and Natural Tampons Market, by Type, 2018–2023 (USD Million)
Table 11. US: Organic and Natural Tampons Market, by Size, 2018–2023 (USD Million)
Table 12. US: Organic and Natural Tampons Market, by Odour Type, 2018–2023 (USD Million)
Table 13. Canada: Organic and Natural Tampons Market, by Type, 2018–2023 (USD Million)
Table 14. Canada: Organic and Natural Tampons Market, by Size, 2018–2023 (USD Million)
Table 15. Canada: Organic and Natural Tampons Market, by Odour Type, 2018–2023 (USD Million)
Table 16. South America: Organic and Natural Tampons Market, by Type, 2018–2023 (USD Million)
Table 17. South America: Organic and Natural Tampons Market, by Size, 2018–2023 (USD Million)
Table 18. South America: Organic and Natural Tampons Market, by Odour Type, 2018–2023 (USD Million)
Table 19. Europe: Organic and Natural Tampons Market, by Type, 2018–2023 (USD Million)
Table 20. Europe: Organic and Natural Tampons Market, by Size, 2018–2023 (USD Million)
Table 21. Europe: Organic and Natural Tampons Market, by Odour Type, 2018–2023 (USD Million)
Table 22. Western Europe: Organic and Natural Tampons Market, by Type, 2018–2023 (USD Million)
Table 23. Western Europe: Organic and Natural Tampons Market, by Size, 2018–2023 (USD Million)
Table 24. Western Europe: Organic and Natural Tampons Market, by Odour Type, 2018–2023 (USD Million)
Table 25. Eastern Europe: Organic and Natural Tampons Market, by Type, 2018–2023 (USD Million)
Table 26. Eastern Europe: Organic and Natural Tampons Market, by Size, 2018–2023 (USD Million)
Table 27. Eastern Europe: Organic and Natural Tampons Market, by Odour Type, 2018–2023 (USD Million)
Table 28. Asia-Pacific: Organic and Natural Tampons Market, by Type, 2018–2023 (USD Million)
Table 29. Asia-Pacific: Organic and Natural Tampons Market, by Size, 2018–2023 (USD Million)
Table 30. Asia-Pacific: Organic and Natural Tampons Market, by Odour Type, 2018–2023 (USD Million)
Table 31. Middle East & Africa: Organic and Natural Tampons Market, by Type, 2018–2023 (USD Million)
Table 32. Middle East & Africa: Organic and Natural Tampons Market, by Size, 2018–2023 (USD Million)
Table 33. Middle East & Africa: Organic and Natural Tampons Market, by Odour Type, 2018–2023 (USD Million)
LIST OF FIGURES
Figure 1. Research Process
Figure 2. Segmentation for Global Organic and Natural Tampons Market
Figure 3. Market Dynamics for Global Organic and Natural Tampons Market
Figure 4. Global Organic and Natural Tampons Market Share, by Type, 2017
Figure 5. Global Organic and Natural Tampons Market Share, by Size, 2017
Figure 6. Global Organic and Natural Tampons Market Share, by Odour Type, 2017
Figure 7. Global Organic and Natural Tampons Market Share, by Region, 2017
Figure 8. North America: Organic and Natural Tampons Market Share, by Country, 2017
Figure 9. Europe: Organic and Natural Tampons Market Share, by Country, 2017
Figure 10. Asia-Pacific: Organic and Natural Tampons Market Share, by Country, 2017
Figure 11. Middle East & Africa: Organic and Natural Tampons Market Share, by Country, 2017
Figure 12. Global Organic and Natural Tampons Market: Company Share Analysis, 2017 (%)
Figure 13. Procter & Gamble: Key Financials
Figure 14. Procter & Gamble: Segmental Revenue
Figure 15. Procter & Gamble: Geographical Revenue
Figure 16. Bodywise: Key Financials
Figure 17. Bodywise: Segmental Revenue
Figure 18. Bodywise: Geographical Revenue
Figure 19. ALYK: Key Financials
Figure 20. ALYK: Segmental Revenue
Figure 21. ALYK: Geographical Revenue
Figure 22. BON: Key Financials
Figure 23. BON: Segmental Revenue
Figure 24. BON: Geographical Revenue
Figure 25. Seventh Generation: Key Financials
Figure 26. Seventh Generation: Segmental Revenue
Figure 27. Seventh Generation: Geographical Revenue
Figure 28. The Honest Company: Key Financials
Figure 29. The Honest Company: Segmental Revenue
Figure 30. The Honest Company: Geographical Revenue
Figure 31. Maxim Hygiene: Key Financials
Figure 32. Maxim Hygiene: Segmental Revenue
Figure 33. Maxim Hygiene: Geographical Revenue
Figure 34. NutraMarks: Key Financials
Figure 35. NutraMarks: Segmental Revenue
Figure 36. NutraMarks: Geographical Revenue
This table of content is tentative and subject to change as the research progresses.
Please Note: Financial details of company cannot be provided if the information of the company is not available in public domain and or reliable source.