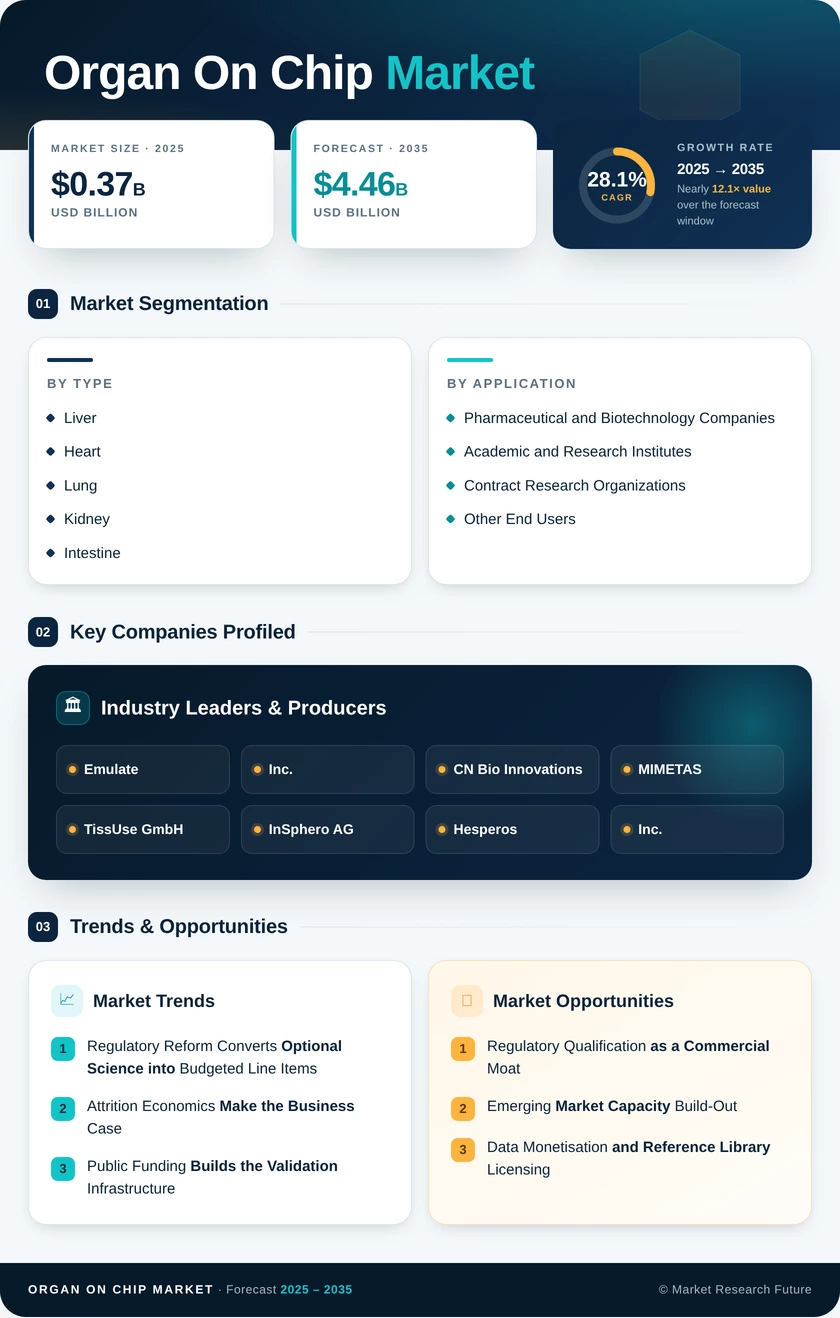
Organ on chip Market (2026 - 2035)

ID: MRFR/HC/7026-HCR 120 Pages Nidhi Mandole Last Updated: September 15, 2026
Organ-on-a-chip Market Research Report: Size, Share, Trend Analysis By Organ Type (Lung-on-Chip, Heart-on-Chip, Liver-on-Chip, Intestine-on-Chip, Kidney-on-Chip, Human-on-Chip), By Applications (Drug Discovery, Toxicology Research, Others) and By End-User (Pharmaceutical Companies, Research Organizations, Others) – Forecast to 2035
Organ on chip Market
Market Size
Forecast Period2026-2035
CAGR (2026-2035)28.1%
2025 Market SizeUSD 0.37 Billion
2035 Market SizeUSD 4.46 Billion
Key Players
Emulate, Inc.
CN Bio Innovations
MIMETAS
TissUse GmbH
InSphero AG
Hesperos, Inc.
Opportunities
  • Regulatory Qualification as a Commercial Moat
  • Emerging Market Capacity Build-Out
  • Data Monetisation and Reference Library Licensing
  1. 1 Market Overview |
    1. 1.1 Study Assumptions & Market Definition |
    2. 1.2 Scope of the Study |
    3. 1.3 Research Methodology
  2. 2 Market Summary & Key Report Takeaways |
    1. 2.1 By Organ Type |
    2. 2.2 By Application |
    3. 2.3 By End User |
    4. 2.4 By Geography
  3. 3 Global Market Size & Forecast (2021–2035) |
    1. 3.1 Historical Market Size (2021–2025) |
    2. 3.2 Current & Forecast Market Size (2026–2035) |
    3. 3.3 Market Size by Revenue (USD Billion) |
    4. 3.4 Year-over-Year Growth Analysis
  4. 4 Market Dynamics — Drivers |
    1. 4.1 Regulatory Phase-Out of Mandatory Animal Testing |
    2. 4.2 Clinical Trial Attrition Economics |
    3. 4.3 Public Research Funding for Human-Based Models |
    4. 4.4 iPSC Supply Chain Maturation
  5. 5 Market Dynamics — Restraints |
    1. 5.1 Absence of Harmonised Validation Standards |
    2. 5.2 Cost per Data Point versus Legacy Assays |
    3. 5.3 Shortage of Trained Operators |
    4. 5.4 Vendor Lock-In on Proprietary Consumables
  6. 6 Market Opportunity Analysis |
    1. 6.1 Regulatory Qualification as a Commercial Moat |
    2. 6.2 Emerging Market Capacity Build-Out |
    3. 6.3 Data Monetisation and Reference Library Licensing |
    4. 6.4 Multi-Organ Coupling for ADME Prediction |
    5. 6.5 Chemical and Cosmetics Testing Beyond Pharma |
    6. 6.6 Industry Value Chain Analysis |
    7. 6.7 Porter's Five Forces Analysis
  7. 7 Regional Analysis |
    1. 7.1 North America | |
      1. 7.1.1 United States | |
      2. 7.1.2 Canada | |
      3. 7.1.3 Mexico |
    2. 7.2 Europe | |
      1. 7.2.1 Germany | |
      2. 7.2.2 United Kingdom | |
      3. 7.2.3 France | |
      4. 7.2.4 Italy | |
      5. 7.2.5 Spain | |
      6. 7.2.6 Nordic Countries | |
      7. 7.2.7 Russia | |
      8. 7.2.8 Rest of Europe |
    3. 7.3 Asia-Pacific | |
      1. 7.3.1 China | |
      2. 7.3.2 India | |
      3. 7.3.3 Japan | |
      4. 7.3.4 South Korea | |
      5. 7.3.5 ASEAN | |
      6. 7.3.6 Rest of Asia-Pacific |
    4. 7.4 South America | |
      1. 7.4.1 Brazil | |
      2. 7.4.2 Argentina | |
      3. 7.4.3 Rest of South America |
    5. 7.5 Middle East & Africa | |
      1. 7.5.1 Saudi Arabia | |
      2. 7.5.2 UAE | |
      3. 7.5.3 South Africa | |
      4. 7.5.4 Egypt | |
      5. 7.5.5 Rest of Middle East & Africa
  8. 8 Future Outlook (2026–2035) |
    1. 8.1 Machine Learning and Predictive Model Integration |
    2. 8.2 Service Economics versus Instrument Sales |
    3. 8.3 Standardisation and Vendor Consolidation |
    4. 8.4 Patient-Specific Chips in Clinical Decision-Making
  9. 9 Segmentation Analysis |
    1. 9.1 By Organ Type | |
      1. 9.1.1 Liver | |
      2. 9.1.2 Heart | |
      3. 9.1.3 Lung | |
      4. 9.1.4 Kidney | |
      5. 9.1.5 Intestine | |
      6. 9.1.6 Other Organ Types |
    2. 9.2 By Application | |
      1. 9.2.1 Drug Discovery and Lead Identification | |
      2. 9.2.2 Toxicology and Safety Assessment | |
      3. 9.2.3 Disease Modelling | |
      4. 9.2.4 Personalized Medicine | |
      5. 9.2.5 Other Applications |
    3. 9.3 By End User | |
      1. 9.3.1 Pharmaceutical and Biotechnology Companies | |
      2. 9.3.2 Academic and Research Institutes | |
      3. 9.3.3 Contract Research Organizations | |
      4. 9.3.4 Other End Users
  10. 10 Competitive Landscape |
    1. 10.1 Market Share Analysis (2026) |
    2. 10.2 Competitive Benchmarking Matrix |
    3. 10.3 Company Profiles | |
      1. 10.3.1 Emulate, Inc. | |
      2. 10.3.2 CN Bio Innovations | |
      3. 10.3.3 MIMETAS | |
      4. 10.3.4 TissUse GmbH | |
      5. 10.3.5 InSphero AG | |
      6. 10.3.6 Hesperos, Inc. | |
      7. 10.3.7 Nortis, Inc. | |
      8. 10.3.8 AxoSim, Inc. | |
      9. 10.3.9 AlveoliX AG | |
      10. 10.3.10 BiomimX S.r.l. | |
      11. 10.3.11 SynVivo, Inc. | |
      12. 10.3.12 Draper Laboratory
  11. 11 Recent Developments & News
  12. 12 Report Scope & Methodology |
    1. 12.1 Study Period & Base Year |
    2. 12.2 Data Sources & Citations |
    3. 12.3 Abbreviations
  13. 13 Detailed Sources and Citations
  14. 14 Frequently Asked Questions
  15. 15 LIST OF TABLES |
  16. TABLE 1 Global Organ-on-a-chip Market Size & Forecast, by Revenue (USD Billion), 2021–2035 |
  17. TABLE 2 Global Organ-on-a-chip Market – Year-over-Year Growth Analysis, 2021–2035 |
  18. TABLE 3 Driver Impact Analysis – Estimated Contribution to Growth Momentum, 2026–2035 |
  19. TABLE 4 Restraint Impact Analysis – Estimated Drag on Growth Momentum, 2026–2035 |
  20. TABLE 5 Global Market Size, by Region, 2021–2035 (USD Billion) |
  21. TABLE 6 North America Market Size, by Country, 2021–2035 (USD Billion) |
  22. TABLE 7 Europe Market Size, by Country, 2021–2035 (USD Billion) |
  23. TABLE 8 Asia-Pacific Market Size, by Country, 2021–2035 (USD Billion) |
  24. TABLE 9 South America Market Size, by Country, 2021–2035 (USD Billion) |
  25. TABLE 10 Middle East & Africa Market Size, by Country, 2021–2035 (USD Billion) |
  26. TABLE 11 Global Market Size, by Organ Type, 2021–2035 (USD Billion) |
  27. TABLE 12 Global Market Size, by Application, 2021–2035 (USD Billion) |
  28. TABLE 13 Global Market Size, by End User, 2021–2035 (USD Billion) |
  29. TABLE 14 North America Market Size, by Organ Type and Application, 2021–2035 (USD Billion) |
  30. TABLE 15 Europe Market Size, by Organ Type and Application, 2021–2035 (USD Billion) |
  31. TABLE 16 Asia-Pacific Market Size, by Organ Type and Application, 2021–2035 (USD Billion) |
  32. TABLE 17 South America Market Size, by Organ Type and Application, 2021–2035 (USD Billion) |
  33. TABLE 18 Middle East & Africa Market Size, by Organ Type and Application, 2021–2035 (USD Billion) |
  34. TABLE 19 Competitive Benchmarking Matrix, 2026 |
  35. TABLE 20 Company Profiles – Key Players |
  36. TABLE 21 Recent Developments & Strategic Announcements, 2023–2025 |
  37. TABLE 22 Report Scope & Methodology Summary |
  38. TABLE 23 Detailed Sources and Citations
  39. 16 LIST OF FIGURES |
  40. FIGURE 1 Market Dynamics – Drivers, Restraints, and Opportunities Snapshot |
  41. FIGURE 2 Industry Value Chain Analysis |
  42. FIGURE 3 Porter's Five Forces Analysis |
  43. FIGURE 4 Global Market Size Trend and Forecast, 2021–2035 (USD Billion) |
  44. FIGURE 5 Year-over-Year Growth Rate Trend, 2022–2035 (%) |
  45. FIGURE 6 Market Share by Organ Type, 2025 vs 2035 (%) |
  46. FIGURE 7 Market Share by Application, 2025 vs 2035 (%) |
  47. FIGURE 8 Market Share by End User, 2025 vs 2035 (%) |
  48. FIGURE 9 Regional Market Share Distribution, 2025 (%) |
  49. FIGURE 10 Regional Market Share Distribution, 2035 (%) |
  50. FIGURE 11 Regional CAGR Comparison, 2026–2035 (%) |
  51. FIGURE 12 Competitive Landscape – Estimated Revenue Share Ranges, 2026 |
  52. FIGURE 13 Vendor Positioning Matrix – Capability versus Regulatory Readiness |
  53. FIGURE 14 Country-Level Growth Heat Map, 2026–2035

Segmentation Quick Reference

DimensionSub-SegmentsDominant SegmentFastest Growing Segment
By Organ TypeLiver; Heart; Lung; Kidney; Intestine; Other Organ TypesLiverOther Organ Types (Multi-Organ)
By ApplicationDrug Discovery and Lead Identification; Toxicology and Safety Assessment; Disease Modelling; Personalized Medicine; Other ApplicationsDrug Discovery and Lead IdentificationToxicology and Safety Assessment
By End UserPharmaceutical and Biotechnology Companies; Academic and Research Institutes; Contract Research Organizations; Other End UsersPharmaceutical and Biotechnology CompaniesContract Research Organizations
By GeographyNorth America; Europe; Asia-Pacific; South America; Middle East & AfricaNorth AmericaAsia-Pacific


Market Segmentation Overview

By Organ Type

Sub-SegmentKey Trend
LiverRemains the default entry purchase; hepatotoxicity screening drives repeat consumable demand
HeartContractility and field-potential readouts align with existing proarrhythmia guidance
LungAir-liquid interface designs gain traction for inhaled biologics and respiratory infection work
KidneyProximal tubule models expand as transporter-mediated toxicity gains regulatory attention
IntestineAbsorption and microbiome co-culture applications broaden the addressable use case
Other Organ TypesMulti-organ and body-on-chip coupling moves the category toward systemic pharmacokinetics


Organ selection follows attrition risk rather than scientific elegance. Buyers start with the organ that kills the most candidates, then expand laterally once the workflow is embedded — which is why liver installations reliably precede everything else.

By Application

Sub-SegmentKey Trend
Drug Discovery and Lead IdentificationLargest current spend; used for internal triage where evidentiary burden is lowest
Toxicology and Safety AssessmentFastest expansion as regulatory qualification pathways formalise
Disease ModellingRare disease and oncology programmes drive bespoke device demand
Personalized MedicinePatient-derived screening pilots await reimbursement clarity
Other ApplicationsCosmetics, agrochemical, and government testing add non-pharmaceutical volume


Application mix is the leading indicator for this industry. When toxicology overtakes discovery in revenue terms — likely early in the 2030s — it will signal that chip data has moved from advisory to submission-grade.

By End User

Sub-SegmentKey Trend
Pharmaceutical and Biotechnology CompaniesDominant spender; adoption concentrated in safety and translational science functions
Academic and Research InstitutesGenerate the peer-reviewed validation that unlocks industry procurement
Contract Research OrganizationsFastest growth; convert capital purchases into per-study operating expense
Other End UsersChemical, cosmetics, and government laboratories diversify the demand base


The end-user picture explains why service revenue is scaling faster than hardware. Small and mid-sized biotechs cannot justify instrument capital, but they can approve a study invoice — and contract research organisations are built to capture exactly that demand.




Download PDF ×

We do not share your information with anyone. However, we may send you emails based on your report interest from time to time. You may contact us at any time to opt-out.