Segmentation Quick Reference
| Dimension | Sub-Segments | Dominant Segment | Fastest Growing Segment |
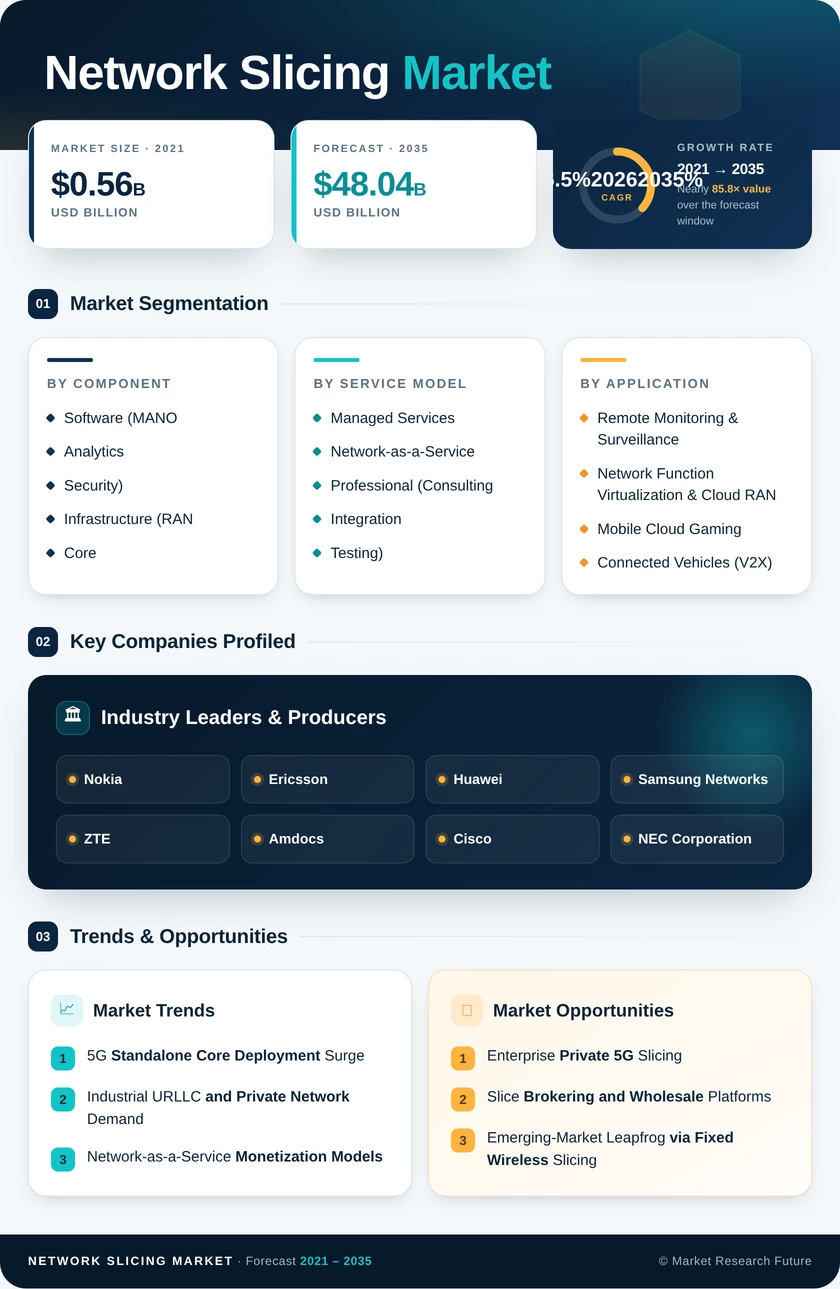
| Component | Software (MANO, Analytics, Security); Infrastructure (RAN, Core, Transport) | Software | Infrastructure – RAN |
| Service Model | Managed Services; Network-as-a-Service; Professional (Consulting, Integration, Testing) | Managed Services | Network-as-a-Service |
| Application | Remote Monitoring & Surveillance; Network Function Virtualization & Cloud RAN; Mobile Cloud Gaming; Connected Vehicles (V2X) | Remote Monitoring & Surveillance | Mobile Cloud Gaming |
| End-User Industry | Automotive & Transportation; Media & Entertainment; Healthcare; Manufacturing; Energy & Utilities | Automotive & Transportation | Media & Entertainment |
| Geography | North America; Europe; Asia-Pacific; South America; Middle East & Africa | North America | Asia-Pacific |
Market Segmentation Overview
By Component
| Sub-Segment | Key Trend |
| Software (MANO, Analytics, Security) | Cloud-native orchestration platforms replacing legacy OSS/BSS stacks |
| Infrastructure – RAN | O-RAN-compliant slice-aware radios enabling dynamic spectrum allocation |
| Infrastructure – Core | 5G SA core upgrades driving control-plane and user-plane separation |
| Infrastructure – Transport | SDN-enabled backhaul supporting deterministic slice SLAs |
Software remains the dominant component as operators invest in MANO platforms, analytics engines, and security modules that automate slice lifecycle management across multi-vendor environments.
By Service Model
| Sub-Segment | Key Trend |
| Managed Services | Outsourced end-to-end slice operations for operators lacking in-house expertise |
| Network-as-a-Service | API-driven self-service enterprise portals for pay-per-use slice procurement |
| Professional – Consulting | Strategic advisory on slice monetization roadmaps and business-case modeling |
| Professional – Integration | Multi-vendor integration services addressing interoperability across RAN, core, and transport |
| Professional – Testing | SLA validation and slice conformance testing prior to commercial launch |
Managed services lead as the default engagement model, while network-as-a-service is accelerating fastest as enterprises demand programmable, on-demand connectivity.
By Application
| Sub-Segment | Key Trend |
| Remote Monitoring & Surveillance | Dedicated slices for smart city, industrial IoT, and public safety video feeds |
| Network Function Virtualization & Cloud RAN | Virtualized network functions are consolidating onto shared infrastructure via slicing |
| Mobile Cloud Gaming | Ultra-low-latency slices supporting cloud-rendered gaming at scale |
| Connected Vehicles (V2X) | Mission-critical slices for autonomous driving and fleet telemetry |
Remote monitoring holds the largest share due to widespread smart city and industrial IoT deployments, while mobile cloud gaming represents the fastest-growing use case.
By End-User Industry
| Sub-Segment | Key Trend |
| Automotive & Transportation | V2X communication, connected fleet management, and autonomous driving pilots |
| Media & Entertainment | Live event streaming, XR experiences, and immersive content delivery |
| Healthcare | Remote surgery, telemedicine, and connected hospital campus networks |
| Manufacturing | URLLC-grade slices for robotic assembly and predictive maintenance |
| Energy & Utilities | Grid monitoring, smart metering, and distributed energy resource management |
Automotive and transportation lead adoption driven by stringent V2X reliability requirements, while media and entertainment is expanding fastest as immersive content formats demand dedicated low-latency slices.